
“One of the frustrating things for people who miss the first rally in a bull market is that they wait for the big correction, and it never comes. The market just keeps climbing and climbing.” Martin Zweig, American stock investor
What a difference three days makes. After a 2.4% drop on Monday, the S&P 500 has gained more than 1.5% for three consecutive days and many potentially bullish triggers have occurred as a result. Are the lows in? At this point I’d have to say yes, as what we’ve just seen isn’t consistent with a bear market, but we also live in a world where tweets and news drive volatility (my colleague, Sonu Varghese, wrote about this in his blog yesterday) Still, I found the recent action extremely encouraging that better times could be coming.
The Zweig Breadth Thrust
First off, the Zweig Breadth Thrust (ZBT) was discovered many decades ago by the great Marty Zweig. If you’ve never heard about him, look him up, I believe he is one of the greats.
What is it? From Investopedia:
Known as the Zweig Breadth Thrust Indicator, named for American stock investor and financial analyst Martin Zweig, the calculation measures how quickly sentiment in the market shifts.
It does so by dividing the 10-day moving average of the number of advancing stocks by the total number of stocks. When it “thrusts” from a level below 40% to more than 61.5% in a 10-day period, it triggers a signal. You can read more about this signal here.
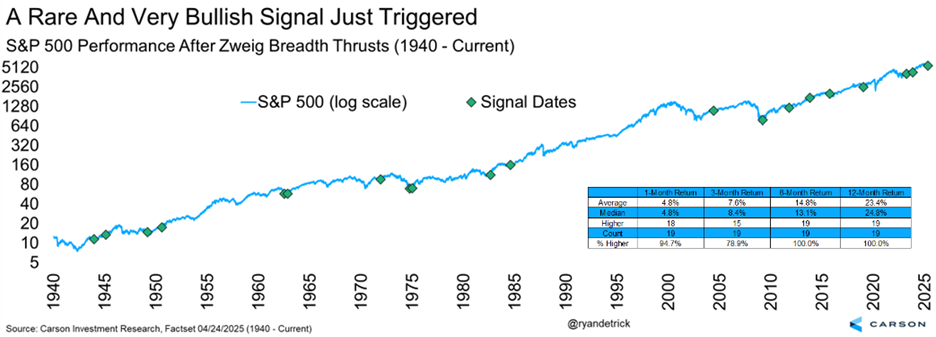
The bottom line for readers is this happens when stocks go from very oversold to very overbought in a quick fashion. Sound familiar? Think of it like a washout and then buyers step in big time. Again, this is rare, with the previous 19 times it had happened (back to WWII) that had a year of data after the signal showed higher prices every single time. Look at those green dots below, not the worst time to expect better times coming. Yes, this runs counter to the constant stream of bad news and the feelings of many investors, but as we noted in Worries and Uncertainty Grow, But There Are Positives this over the top negativity could be a contrarian indicator.
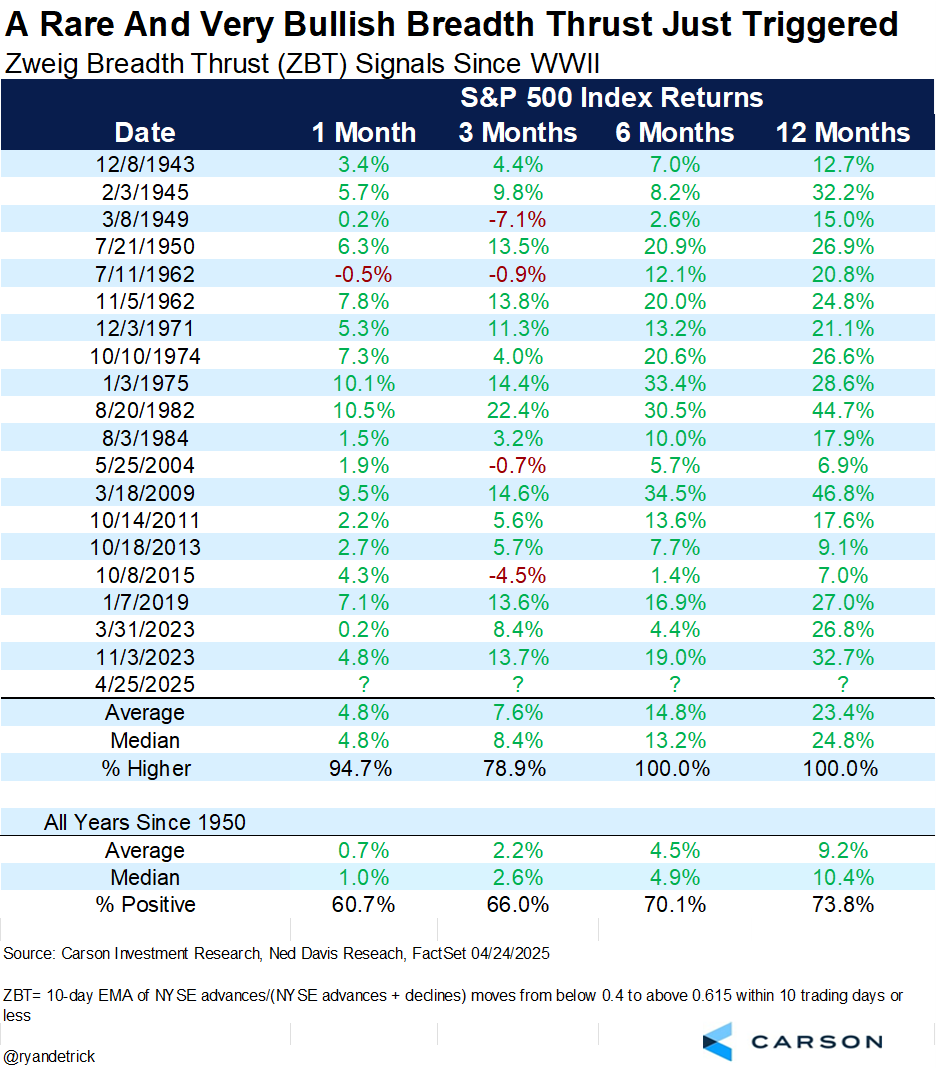
Here’s a table breakdown of all the ZBTs we’ve seen since WWII. Again, up more than 23% a year later and never lower is something I don’t think we should ignore. The median 6-month gain of 13% would put it right on track for the 2025 bull case Sonu described in his blog (the scenario in which almost all the extreme tariffs are rolled back as the Trump administration looks to avoid economic and market pain).
Up Big Three In A Row
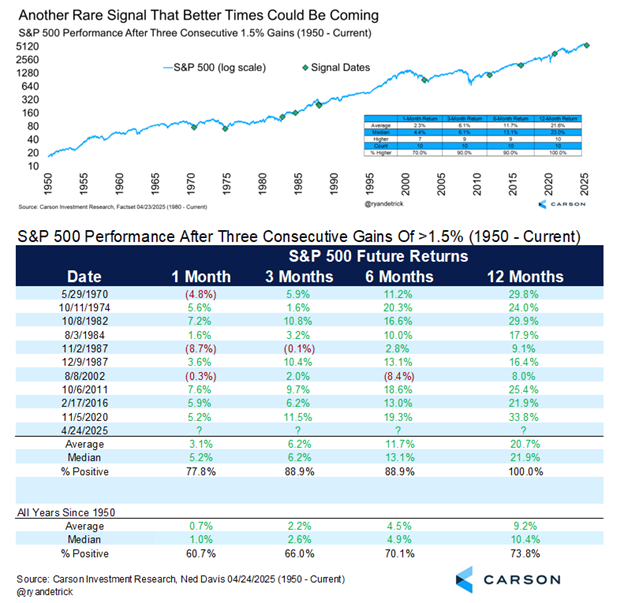
It doesn’t stop there though, as the S&P 500 just gained more than 1.5% for three days in a row. Once again, strong future returns are common after historic buying thrusts like this. In fact, this one showed stocks were higher a year later every time, 10 for 10.
A Lot Of Stocks Up The Past Three Days
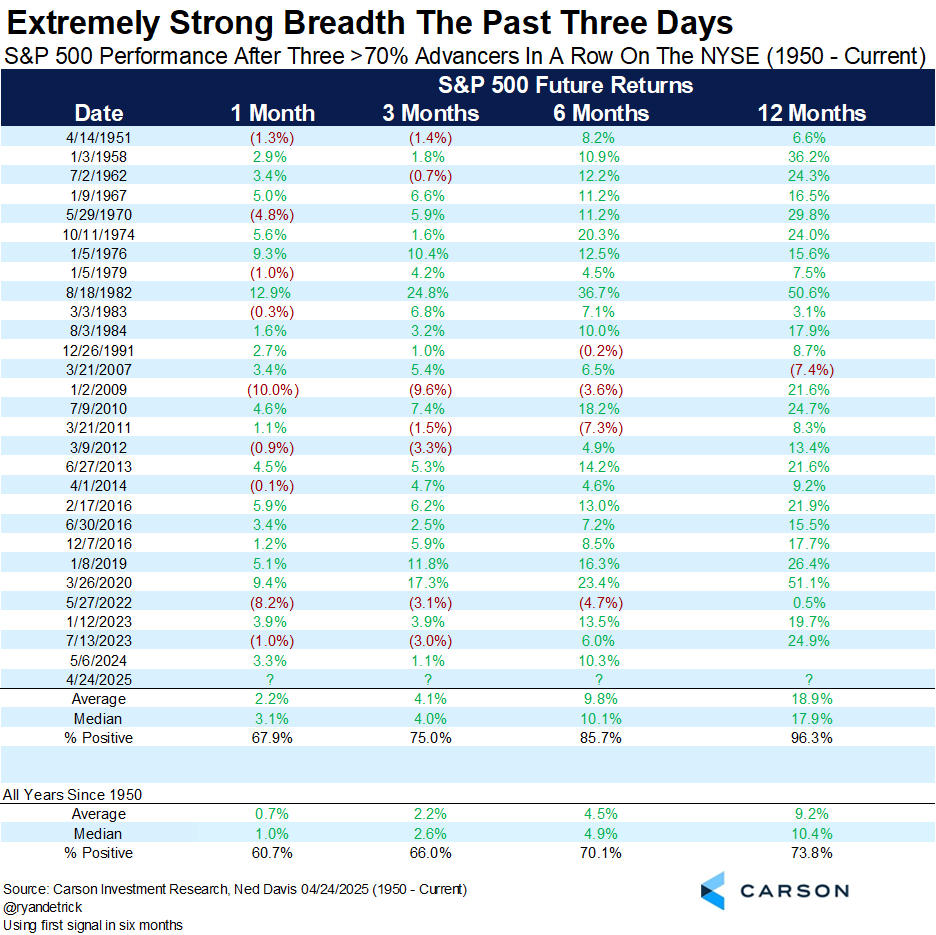
More than 70% of the stocks on the NYSE were higher the past three days as well, another rare and potentially bullish clue. This time stocks show strong future performance and higher a year later 26 out of 27 times.

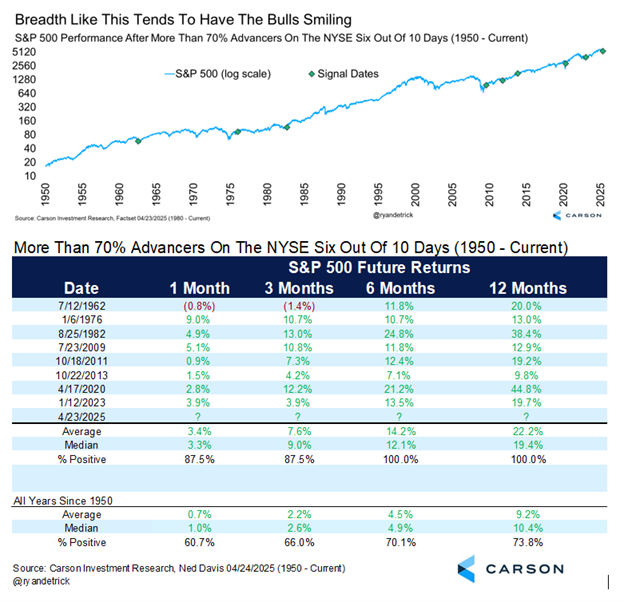
Two Weeks Of Buying
It isn’t just the past three days though, we’ve been seeing extreme buying the past two weeks, again a rare and potentially bullish signal. We recently saw six out of 10 days with more than 70% advancers on the NYSE. This has a smaller sample size (only eight), but again very strong future returns.
Dates like the lows in 1982, 2009, and 2020 show up this time, which always catches my attention. The next 6 months later were never lower and up more than 14% on average, while higher a year later every time and up more than 22% on average should have bulls smiling later in 2025.
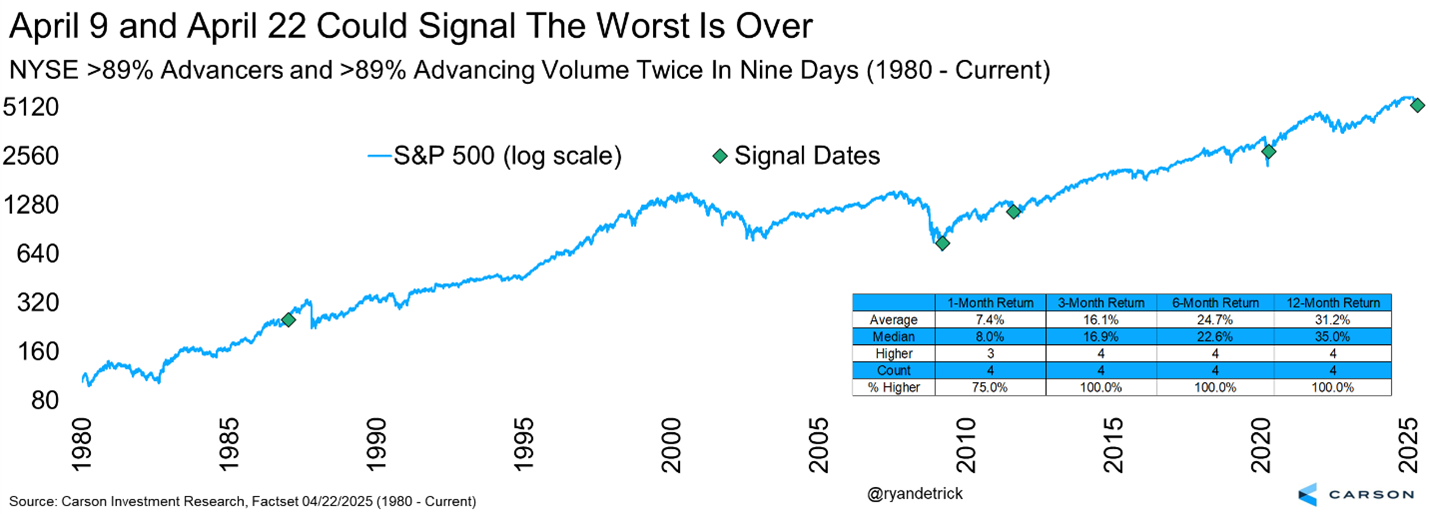
Two Huge Days
The S&P 500 soared 9.5% on April 9th and an incredible 94% of all stocks advanced that day. That was a clue something was happening, but we wanted to see another strong day near by to confirm things. Well, that happened on Tuesday when there was another big up day with many stocks higher. In fact, on April 9 and 22 we saw more than 89% of the stocks and volume advance. This occurred within nine days of each other and is extremely rare, but another clue the bulls are trying to take back control.
Some of the other dates we saw two days this strong, this close to each other? Early 1987, March 2009, August 2011 after the US Debt downgrade, and the COVID lows in March 2020. Again, small sample size, yes, but boy oh boy, I wouldn’t be ignoring this one. Another thing to note, all those historical times, policymakers stepped in to provide relief in a big way, and we could very well see that again this time – with the Trump administration dialing back tariffs in a significant way (which is what they suggested this week) and Fed rate cuts in the back half of the year. 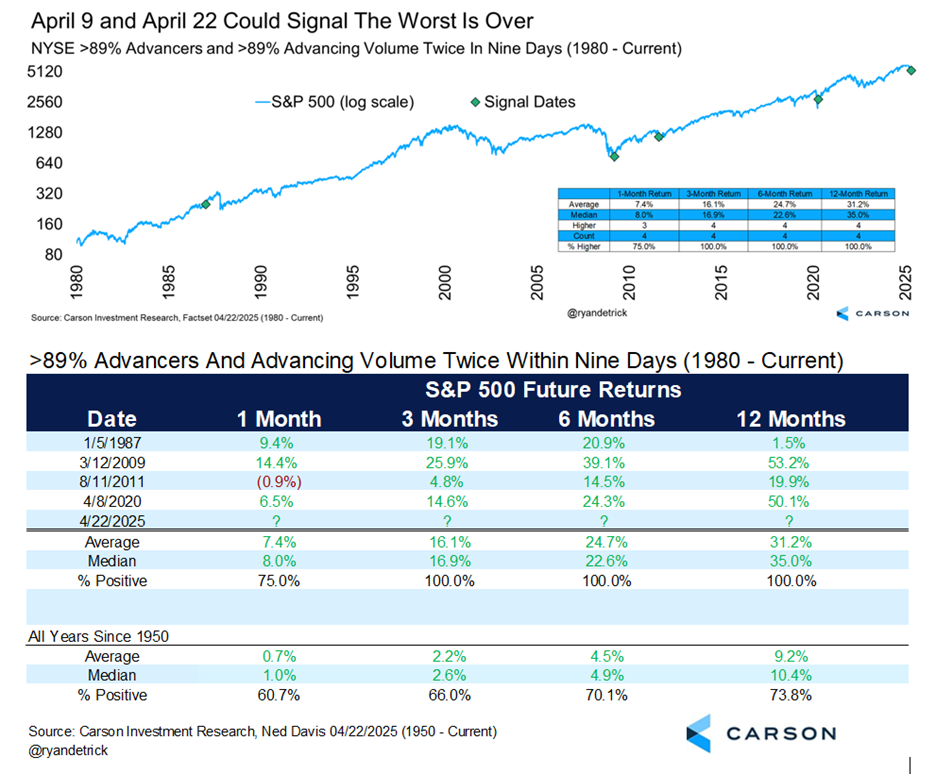
When Do You See This?
Lastly, Ed Yareni noted the purely over-the-top views at The Economist the past few weeks. Few magazines have been better contrarian indicators than this one over the past few decades and I’m going to think they did it once again. Ask yourself, do we see covers like this near bottoms or tops? If you’ve read this far, you know my take.

In conclusion, I am of the opinion the weight of the evidence suggests the lows are in and stocks should trend higher over the coming months. No, we didn’t expect Liberation Day to be what it was and there is always a risk we could see something like that again, but the extreme breadth we’ve seen lately, coupled with some of the most bearish sentiment I’ve seen in my 26 year career, suggests investors should be open to better times.
Stay on Top of Market Trends
The Carson Investment Research newsletter offers up-to-date market news, analysis and insights. Subscribe today!
"*" indicates required fields
Thanks for reading!
For more content by Ryan Detrick, Chief Market Strategist click here.
7901200.1.-0425-A