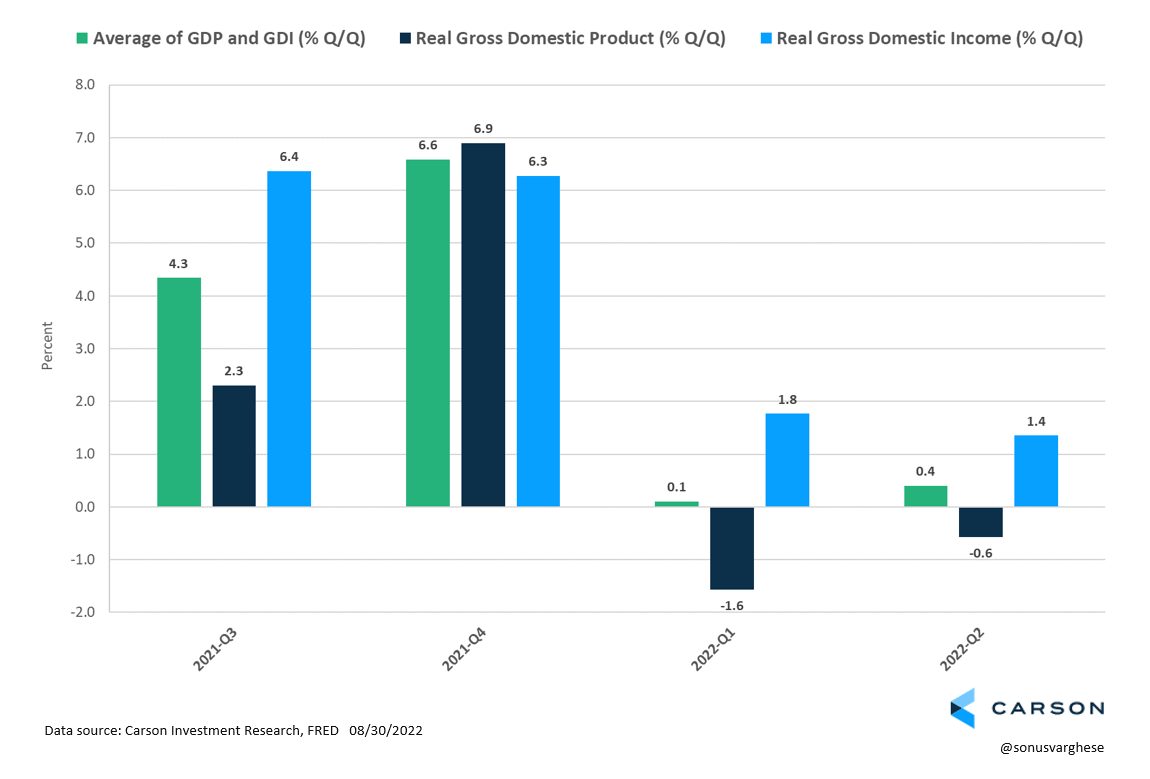
Depends on what you’re looking at. Economic output as measured by GDP (Gross Domestic Product) fell 1.6% in the first quarter and 0.6% in the second quarter. So, it’s perfectly reasonable to conclude that the economy shrunk in the first half of the year. In other words, we were or are in the middle of a recession.
Yet GDI, which is Gross Domestic Income, rose 1.8% in the first quarter and 1.4% in the second quarter.
Wait, what? You’re probably thinking “what exactly is GDI”. Don’t we always use GDP to measure the economy?
Well, kind of.
Some background will help here. I’m going to walk through an example the Bureau of Economic Analysis (BEA) uses in their primer. The BEA is the government agency that measures and releases all these numbers.
Consider a simple economy with just one product, bread. Bread is produced in 3 stages:
- Wheat is grown, harvested, and sold by a farmer to a miller for $1. The farmer’s income and “value-add” to the economy is $1.
- The miller uses wheat (an “intermediate product”) to produce flour that he sells to a baker for $3. The miller’s income and “value-add” to the economy is $3 minus $1, or $2.
- The baker uses the flour to produce bread, which he sells to the “final consumer” for $7. The baker’s income and “value-add” to the economy is $7 minus $3, or $4.
Economic output for this simple economy is $7, and can be measured in a couple of different ways:
- GDP is the value of the final sale to the consumer, i.e. $7.
- GDI is the total income made by everyone along the way. The farmer makes $1, the miller makes $2 and the baker makes $4, all of which also add up to $7.$1, the miller makes $2 and the baker makes $4, all of which also adds up to $7.
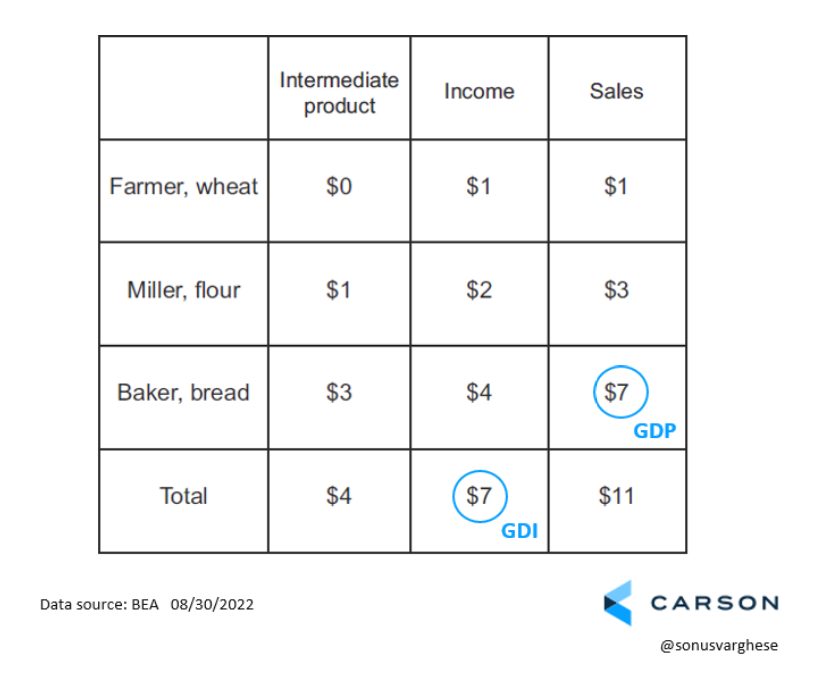
As you can see, both approaches get you to the same place. GDP and GDI should match exactly because all the spending in the economy must equal the income earned by everyone in the economy over a certain period.
In reality, GDP and GDI often differ. This is because they are calculated using different components that are measured using different sources.
GDP is measured by adding up the spending of households, businesses, government, and foreigners (via exports). Household spending makes the bulk of this, at just under 70%.
In contrast, GDI is measured by adding up the total income for everyone in the economy, including compensation for workers, interest income, rental income, small business income, corporate profits, and taxes on production and imports. Employee compensation, which includes benefits, makes up the bulk of this, at 55%.
The BEA reports GDP a month after a quarter end, whereas we must wait another month to get GDI data. Typically, all the focus is on GDP while GDI is a bit of an afterthought and barely reported in the press. It usually doesn’t matter because they track fairly close to each other. But as you can see at the right end of the chart below, the difference has been growing.
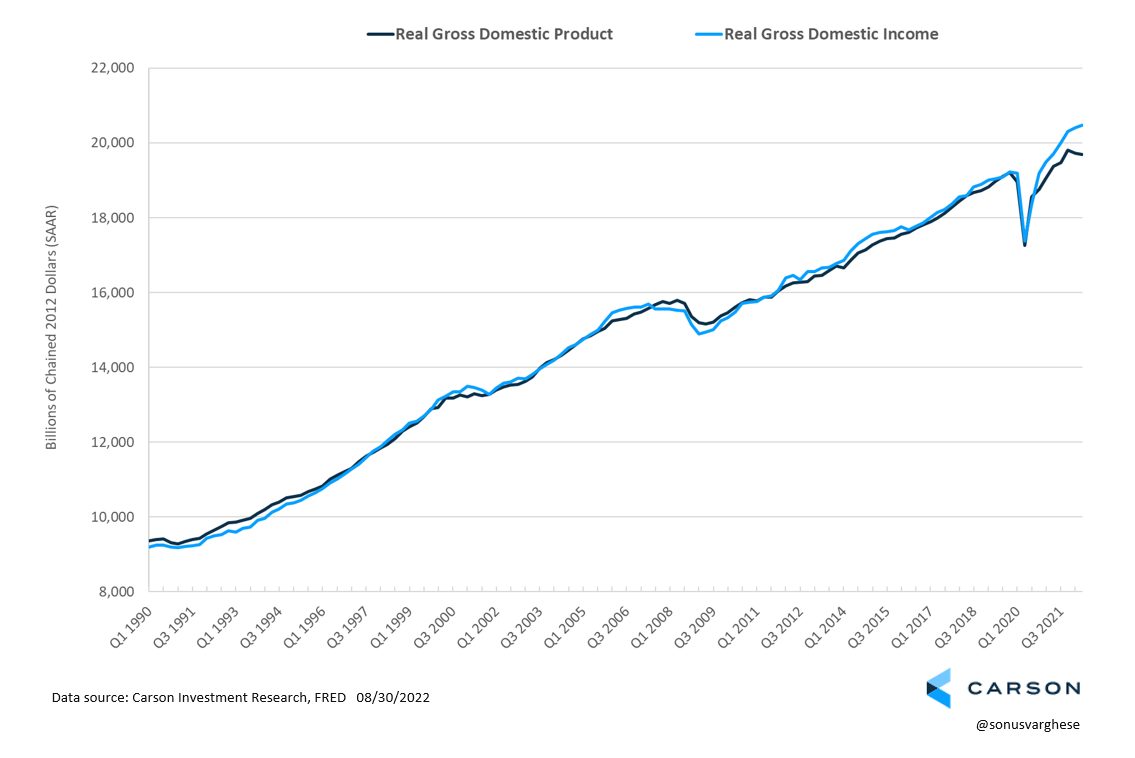
The BEA actually tracks the difference, labeling it the “statistical discrepancy”. Note that this is purely a result of measurement mismatches – as we discussed above there is no structural reason as to why they should differ. Right now, the difference is at its widest ever at 4% of GDP, just under $1 trillion in nominal terms.
That is why you are seeing two completely different readings of the economy. Which one is correct? There’s no right answer here, though in the past we have seen GDP revised in the direction of GDI as opposed to the other way around. For one thing, more than half of GDI is made up of employee compensation, which the government has a fairly good idea of since it collects taxes.
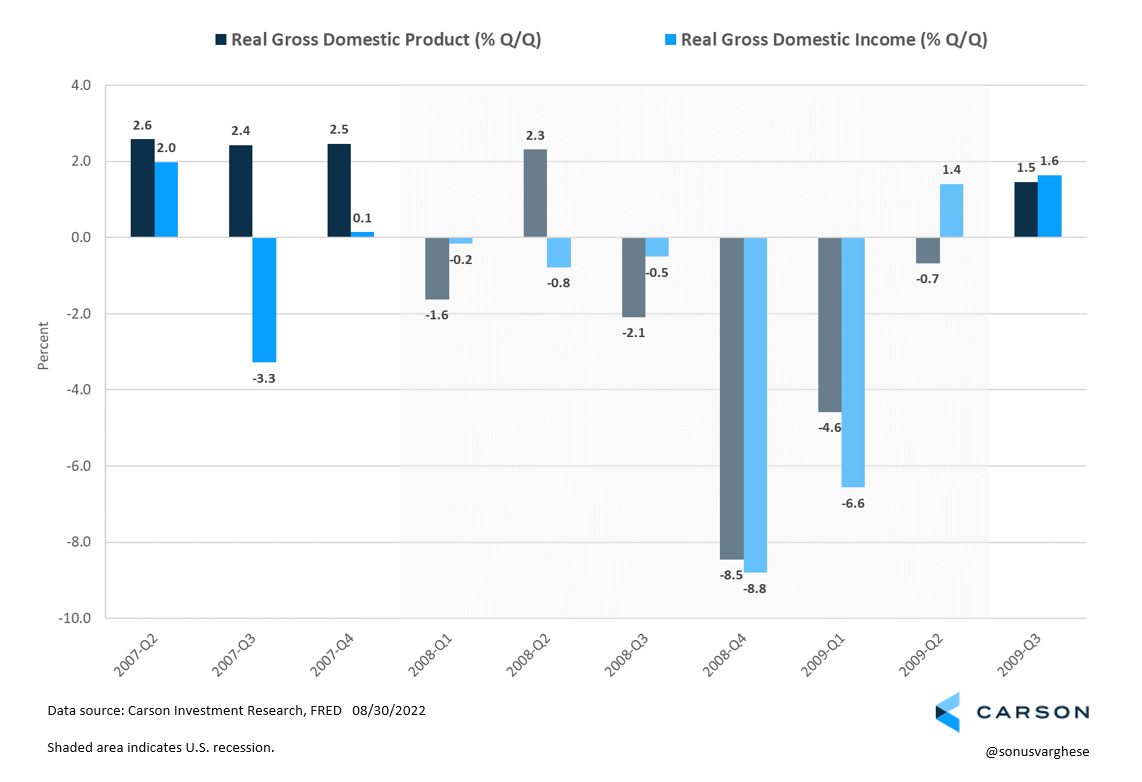
Even back in 2007, GDI was more indicative of the economic slowdown and recession. It fell in the second half of 2007 even as GDP pointed toward an expanding economy.
Perhaps the best approach is to take the average of GDP and GDI. The government calls it “Gross Domestic Output”. And using the average, we can see growth was slightly positive in the first and second quarters of 2022, rising 0.1% and 0.4%, respectively. But the economy clearly slowed from last year.
At the end of the day, we don’t really need to wait until GDP or GDI data is released to gauge what’s happening with the economy. These are released well after the quarter ends and revised several times over the next few years.
Instead, our team looks at several indicators that are more timely – including employment, industrial production, consumption, and income. As I wrote last week, the latest industrial production numbers do not indicate a recession. Real income and consumption data for July also point away from recession. The employment report for August will tell us a lot more about the economy right now. So, we do not have to wait for the third quarter GDP report, which will be released only at the end of October. Or the GDI data which will come out only at the end of November!
