
“There are decades where nothing happens; and there are weeks where decades happen.” Source Unknown
The escalating tension between Israel and Iran has many investors worried about what could happen next. Although we won’t pretend to know the answer, we do understand that while geopolitical events can cause near-term market volatility, they rarely cause major problems for markets longer term.
We don’t want to minimize the events overseas, but we hear this question frequently, so we reviewed 40 major historical geopolitical events to determine the market impact. On average, we found that stocks were higher three months later. While some of these events caused recessions and likely hurt overall returns, in many cases stocks did just fine. This was probably because a stronger economy was able to absorb the impact, even if the events were sometimes devastating from a human perspective.
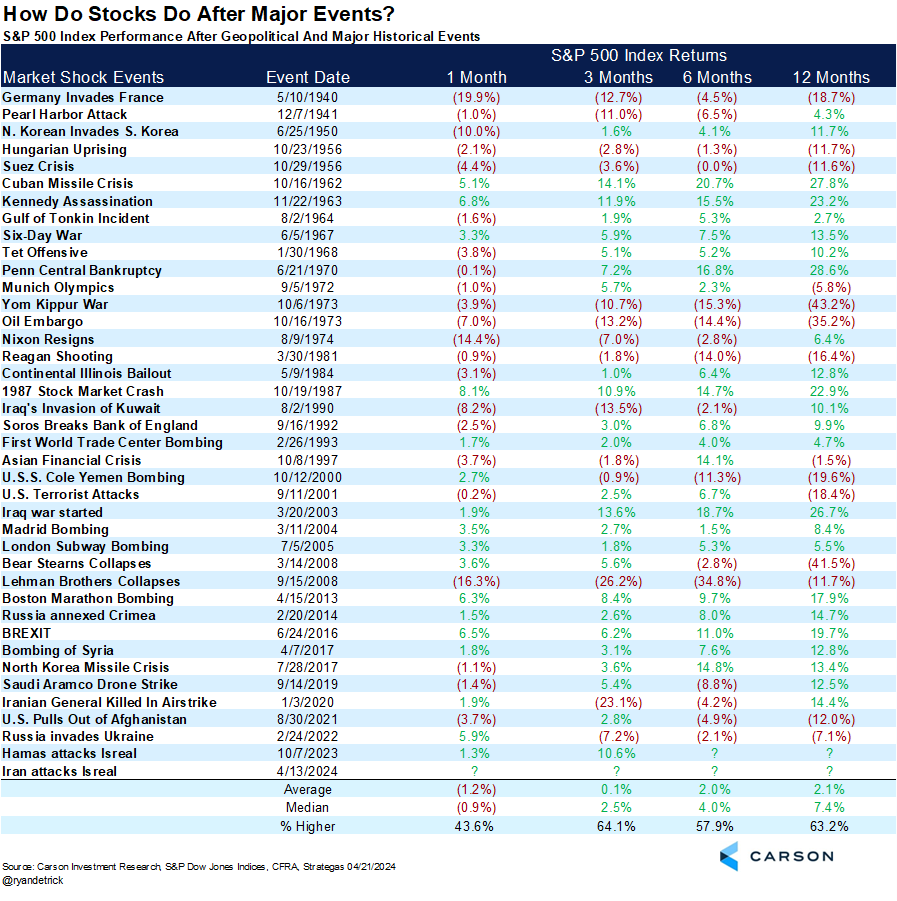
Should the conflict between Iran and Israel continue to escalate, pulling in other countries, of course we would expect additional near-term volatility, especially given the sensitivity of inflation to oil prices. But, for now, it appears tensions have calmed in the region, and as long as the U.S. economy remains firm, which is likely, we expect the bull market to continue.
This Is Normal
The news headlines have been scary recently, but after the market run off the late-October lows, investors have been quite spoiled. From the Oct. 27 lows until the March 28 peak, the S&P 500 added 27.6%, marking one of the best five-month rallies in history. As we’ve noted previously, some weakness or choppy action after that kind of run is perfectly normal.
Stay on Top of Market Trends
The Carson Investment Research newsletter offers up-to-date market news, analysis and insights. Subscribe today!
"*" indicates required fields
Most years tend to see more than three 5% corrections on average, and 2024 only just had its first. Even more interesting, many years have seen a 10% correction (we average about one a year), but have still managed to finish the year higher, with 2023 as the most recent example. Could the current 5.5% mild correction turn into a 10% correction? Anything is possible, but for now we do not expect markets to go that far.
We are actually encouraged by the fear starting to build up in the market. A month ago, nearly everyone was a bull, so these bouts of volatility are necessary to flush out the weak hands. Flows are moving out of equities, sentiment polls are turning dour, and overall anecdotal sentiment is much different than it was a few months ago. All in all, a choppy period and potentially a little more weakness could be in the cards, but we believe a tactical low is near.
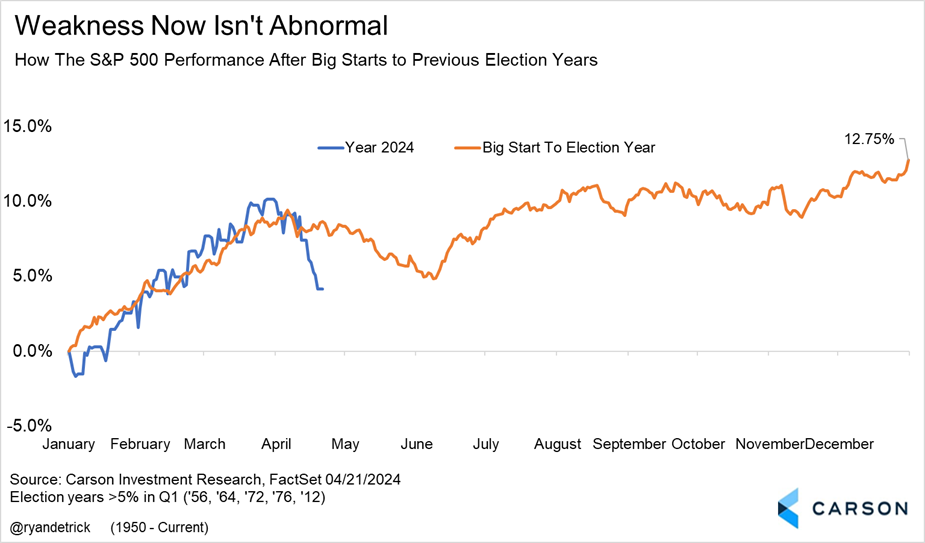
Reviewing previous election years that started strong shows that choppy weakness could last until after Memorial Day, but a summer rally is also likely. So, don’t lose faith now. This is all part of the process, and we continue to expect a strong second half of the year.
Three Charts That Caught My Attention
Last week was the worst week of the year for stocks, but was it really that bad? I mean, technology and former highfliers were crushed, but regional banks had a great week.
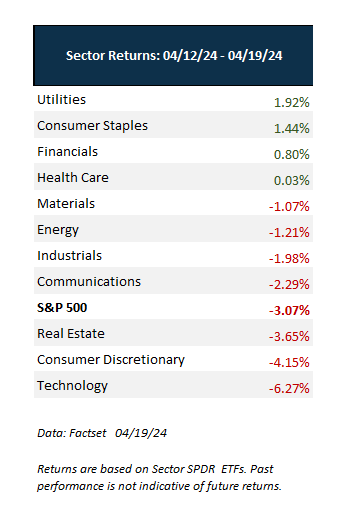
Here are three charts that caught my attention recently. The first one shows that four sectors were green and eight sectors outperformed the S&P 500 last week. We’ve been in the camp all year that we liked cyclicals like industrials and financials, so to see this outperformance is a welcome sign and one we expect to continue.
Last Friday, for instance, saw more than 300 stocks in the S&P 500 finish higher, yet the index lost close to 1%. I looked back in history (using data back to 1998) and found only one other day that happened. Usually when a lot of stocks are up, the index is green. But we know why this happened—it was mainly due to tech falling, with NVIDIA down 10% on the day and other names down significantly as well. We’ve been market-weight tech all year and have anticipated a likely pause in the group and potential rotation into cyclicals, and that may be what’s taking place.
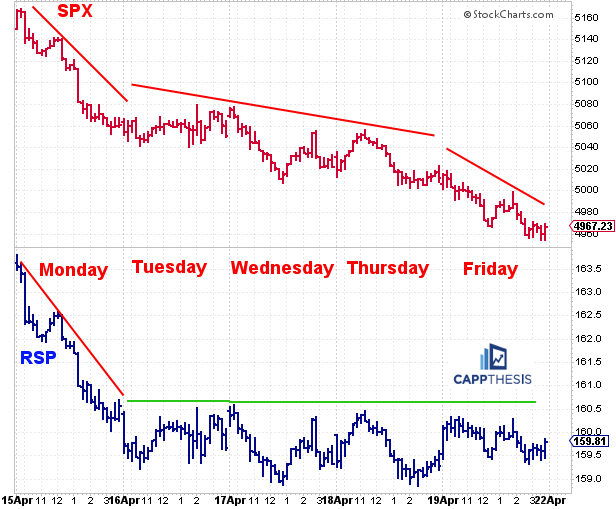
Second, I liked this chart from Frank Cappaleri, Founder of CappThesis, that showed the S&P 500 fell each day last week, but the equal-weighted S&P 500 (the bottom pane) was flat the last four days of the week. Again, under the surface, things weren’t as bad as it appeared and the potential for a tactical low grew.
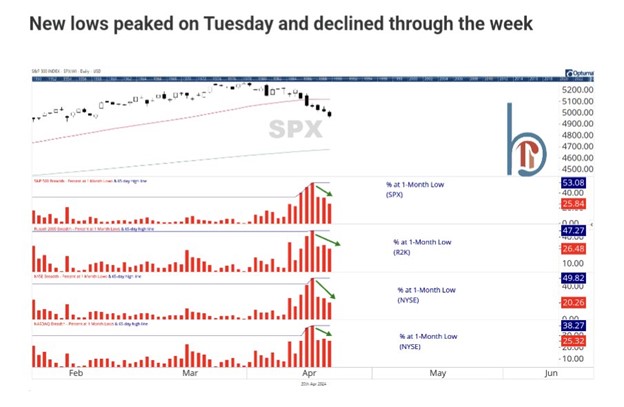
The third chart I liked recently came from Scott Brown, Founder of Brown Technical Insights, and it showed last Tuesday was the peak in new monthly lows, even though we know prices continued to decline. This is what we call a positive divergence and shows that strength is building under the surface, increasing the odds of a rally.
The headlines aren’t good, but no market bottom in history has happened on good headlines, so this is a positive development. Are we at the lows yet? Maybe not, but for now we don’t expect the current 5% mild correction to turn into a 10% correction. Some more frustrating chop could be in play going forward, which would be perfectly normal.
For more on geopolitical events and your investments, Sonu Varghese, VP Global Macro Strategist, and I did a Take Five video (live from Central Park) on this important subject.
For more content by Ryan Detrick, Chief Market Strategist click here.
02212049-0424-A
