There were few surprises in the Consumer Price Index (CPI) inflation data yesterday for July. The “headline” reading was in line with expectations at 0.2%, which brought the one-year reading down to 2.9% versus expectations of 3.0%. The core reading (excluding food and energy) was also in line with expectations at 0.2% for the month and ticked down from 3.0% to 2.9% for the year.
Here are some key takeaways from the report:
While the 0.2% monthly move was aligned with expectations when rounded, it’s worth highlighting that both numbers before rounding were at the low end of the possible range (0.155% and 0.165% for the headline and core number respectively).
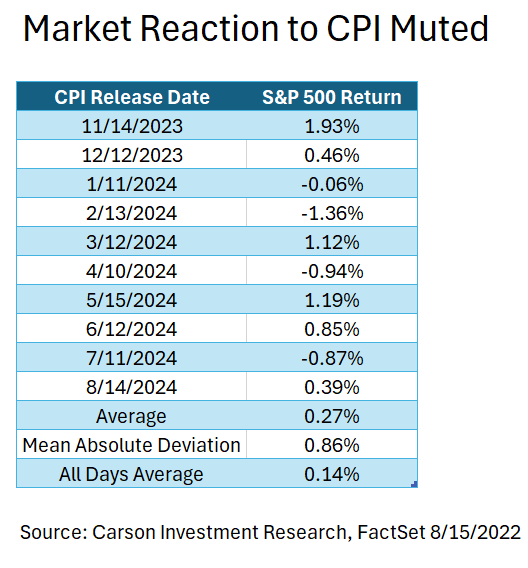
The response of the S&P 500 was the most muted, independent of direction, since January, the index climbing a modest 0.4%. This is a far cry from the outsized 1.8% decline we saw when the job report was released on August 2 and lower than the average move of 0.9%, independent of direction over the last 10 months for CPI day. We’ll take the muted market reaction as a positive, if only because less market volatility around inflation data is a signal that we have greater clarity that the path to normalization is well in place. In fact, if you look over the last three months, the Fed is comfortably below its inflation target.
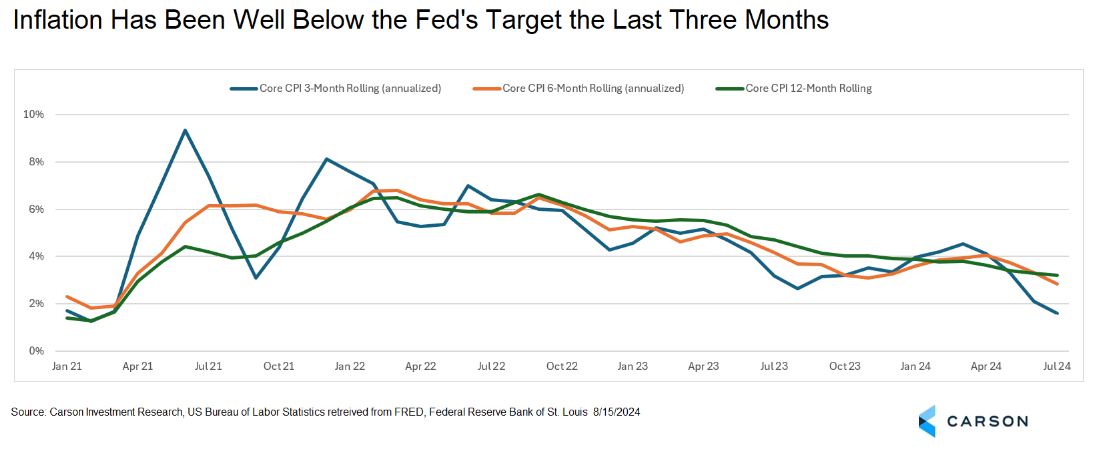
As seen below, the most recent three months is well below the one-year number, indicating the larger contributions to one-year inflation are coming from staler data. With the latest numbers, we are at 0.4% annualized headline inflation over the last three months thanks to falling energy prices and 1.6% annualized for core inflation. Note that PCE inflation, the Fed’s preferred metric, tends to run about 0.4% below CPI inflation historically, so CPI at 2.4% would be consistent with inflation at the Fed’s target of 2.0% measured by PCE. While the last six months annualized has run just a little hotter than that (2.5% for headline and 2.8% for core), it’s certainly not just a couple of data points telling us we’re near target. In fact, the last three month’s core readings were the three lowest of the last year and the 1.6% annualized inflation over those three months is significantly below the Fed’s target.
The market-implied odds of a 0.50%-point cut in September edged down slightly in response to the report, from 53% to 37.5% according to the CME analysis. That’s not a major move, but it highlights that the most recent report did not disrupt the Fed’s chosen inflation narrative of “making progress but we’re not quite there yet.” (We do think we’re there.) It also reflects the decreasing concern since the August 2 job report that the economy has weakened substantially.
We’ll learn more about the Fed’s assessment of the economy at its annual Jackson Hole symposium on August 22-24, but “Fed speak” of late has generally pushed back against a 0.50% cut, framing the question as whether to cut at all. The latter is already fully baked into expectations and it would likely be a negative shock if the Fed didn’t cut in September. Given current data, we think a 0.50% cut would be justified without it signaling panic, but the Fed is more likely to want to start with 0.25%. As always, what the Fed does depends on what the data looks like over the next month and we think the 25 versus 50 debate is live even if the Fed’s preference is likely for 25 all else equal. The September Federal Open Market Committee (FOMC) meeting takes place September 17-18.
Inside the numbers, the shelter data continues to be funky. We’ve talked quite a bit about the spread between real time new rental agreements and the numbers that are flowing through to CPI. Shelter inflation slowed sharply in the prior month’s report and there was probably some giveback this month as it moved back toward the sticky level we’ve seen over much of the last year, but we don’t think last month was just an aberration. The real-time data on rents will continue to make itself felt and shelter inflation should continue to moderate. It is interesting to note how much inflation has been able to come down despite official shelter data continuing to be sticky. While shelter inflation remains elevated at 5.1% year over year, the one-year number has now declined for 16 consecutive months, the longest streak on record going back to 1954.

Stay on Top of Market Trends
The Carson Investment Research newsletter offers up-to-date market news, analysis and insights. Subscribe today!
"*" indicates required fields
Car insurance is also a component that remains elevated as insurers seek to make up for underwriting losses and more sophisticated (and safer) cars become increasingly expensive to repair. But there are also some measurement challenges with this data and other sources indicate that this number, while high, may be exaggerated in the official data.
Vehicle prices, one of the main inflation victims during the pandemic due to supply chain disruptions, have been moderating. Used care prices continue to decline, and the price decreases accelerated last month to -2.3% month over month from -1.5% the prior month. Used car prices are now down 10.9% year over year. We’re also seeing some relief with new vehicles. New vehicle prices have declined every month this year and have been falling year over year since March.
All in all, the numbers show continued progress on inflation and the market reaction likely reflects conviction the trend is solidly in place. That may seem obvious, but we still hear a lot of concerns about the potential for inflation to reaccelerate. But looking under the hood, we just haven’t seen it and continue to view inflation risk as last year’s story.
For more content by Barry Gilbert, VP, Asset Allocation Strategist click here.
02368409-0824-A


