On the face of it, the May payroll report was ok. The economy created 139,000 jobs in May (above expectations for a 126,000 increase) and the unemployment rate was unchanged at 4.2%. But pop the hood and there’s cause for concern.
For one thing, we got a net 95,000 downward revision of jobs created in March and April:
- March was revised down by 65,000, from 185,000 to 120,000. Remarkably, this was first reported as a 228,000.
- April was revised down by 30,000 from 177,000 to 147,000.
This brings the 3-month average to 135,000. That’s well below the 209,000 average we saw back in December, and even below the 2019 pace of 166,000.
Here’s the other thing — the payroll data is based on surveys of over 120,000 businesses representing over 630,000 worksites. These are much larger than any private surveys but there’s still noise associated with it (which is why we get large revisions). The “statistical significance at the 90 percent confidence level” is 136,000. What does that mean? If you’re well above this number, you can be fairly sure job growth is positive. If you’re at this number, like right now (and also seeing downward momentum), we can’t be sure the economy is actually creating any net jobs. Not a certainty, but it’s an uncomfortable place.
Now, immigration has more or less completely collapsed, and so the economy probably needs about 100,000 jobs (if not less) to keep up with population growth, since it’s growing more slowly. And if it does this, as seems to be the case if you take the 3-month average at face value (and assume no more downward revisions), the unemployment rate shouldn’t increase.
The unemployment rate actually comes from a survey of about 60,000 eligible households, and it is much noisier than the payroll survey. That’s why it’s more useful to look at ratios like the unemployment rate or employment-population ratios with this survey. The May household survey showed that employment fell by almost 700,000, but the confidence interval here is 600,000 (like I said, it’s noisy). At the same time, the denominator for the unemployment rate, i.e. the labor force, also fell by 625,000. That’s why the unemployment rate remained unchanged at 4.2%. A labor force that is shrinking is not great for the economy, but it will hide weakness when calculating the unemployment rate.
Meanwhile, the prime-age (25-54) employment population ratio pulled back from 80.7% to 80.5%. By itself, that’s still pretty good and higher than anything we saw from 2001-2019, but the question is whether it sticks around here. I like to look at this metric because it helps offset demographic issues (due to an aging population) and issues around how “unemployment” is defined.

Distribution of Job Growth Isn’t Great
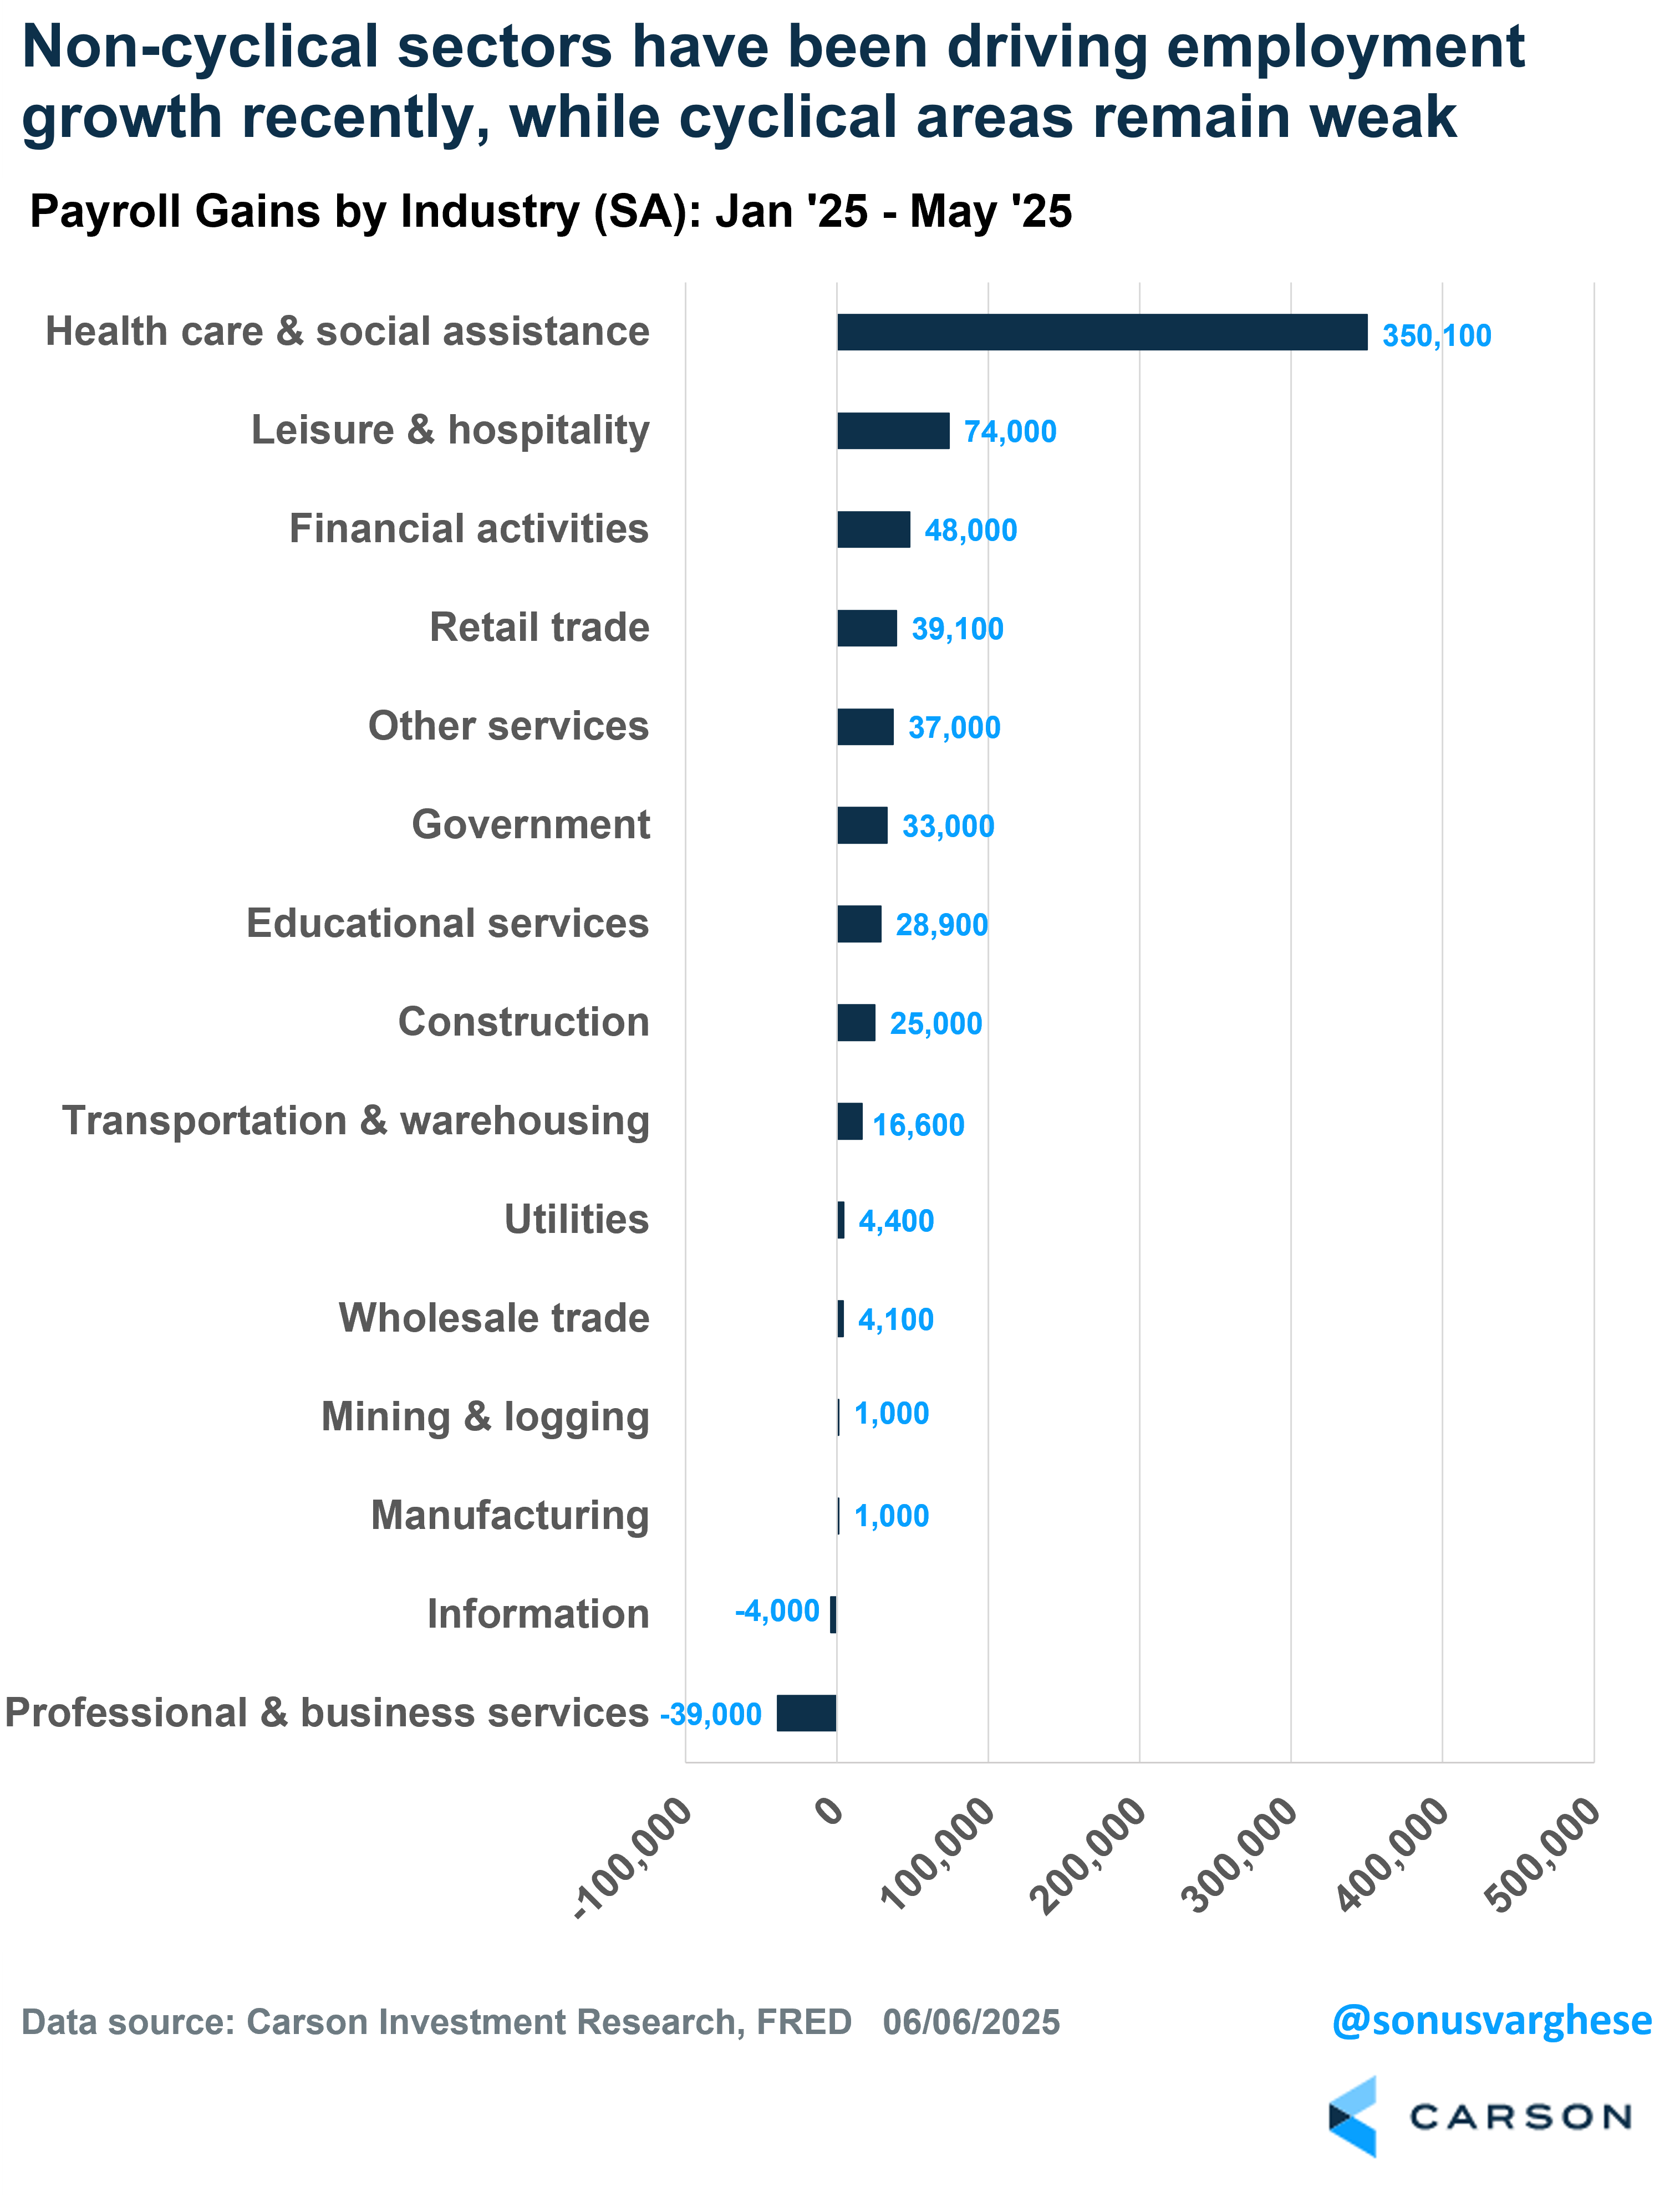
The composition of job growth across sectors also gave less cause for comfort. Close to 63% of jobs created in May were in the non-cyclical sectors of health care and social assistance and private education (+87,000). Employment in cyclical areas like professional and business services, information (including technology jobs), and manufacturing fell by 24,000. The one positive is that leisure and hospitality jobs rose by 48,000 — these aren’t high-paying jobs but it tells you that service sector activity like restaurant spending and travel remain healthy.
The composition of job growth in May follows a theme we’ve seen over the past year, and especially year to date. Over the first 5 months of this year, the economy has created 619,000 jobs (averaging 124,000 per month). Of that…
- Health care, social assistance, and private education: 379,00 (61%)
- Government: 33,000 (5%)
- Leisure and hospitality: 74,000 (12%)
That’s really skewed, and not exactly what you would see if the economy was firing on all cylinders. The big picture is that cyclical areas of the economy are weak, buffeted by both tariffs / tariff uncertainty, and high interest rates.
Tariff Uncertainty + Fed Pause = More Slowing
We still have no idea what the end game is with a big piece of the announced tariffs. They’re simply on pause now. The average effective tariff rate in the US was about 2% at the start of the year. It’s certainly going to much higher than that. It’s currently around 15%, but it’s an open question whether stays here, or moves closer to 10%, or moves even higher than 20%.
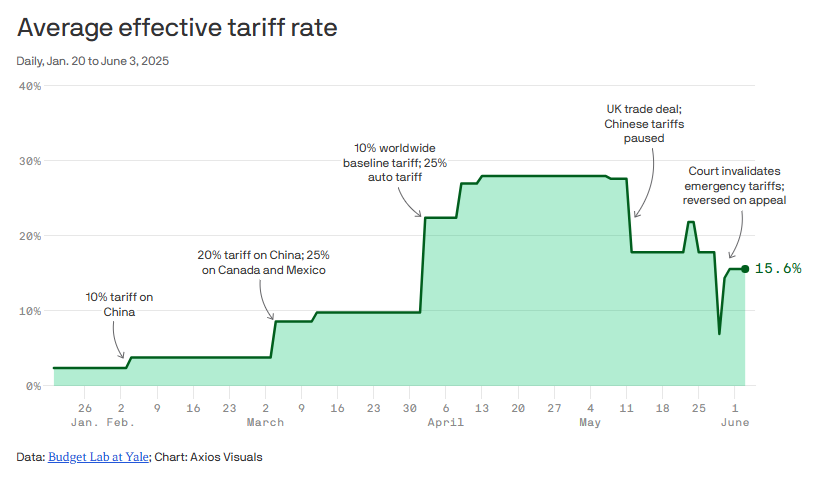
Ultimately, American business will figure out how to live with these tariffs. Either they take the hit to their margins or pass price increases to consumers. But the ongoing uncertainty, and possibility of inflation flaring up again, is likely to keep the Fed on the sidelines for longer.
Stay on Top of Market Trends
The Carson Investment Research newsletter offers up-to-date market news, analysis and insights. Subscribe today!
"*" indicates required fields
Moreover, with the headline data (like the unemployment rate) suggesting the labor market is ok, the Fed may believe it has time to wait for more data. The market’s currently expecting about two more 0.25%-point cuts from the Fed this year, but we may not even see one if the unemployment rate doesn’t move much higher than 4.5% (and given the falloff in immigration, it may not).
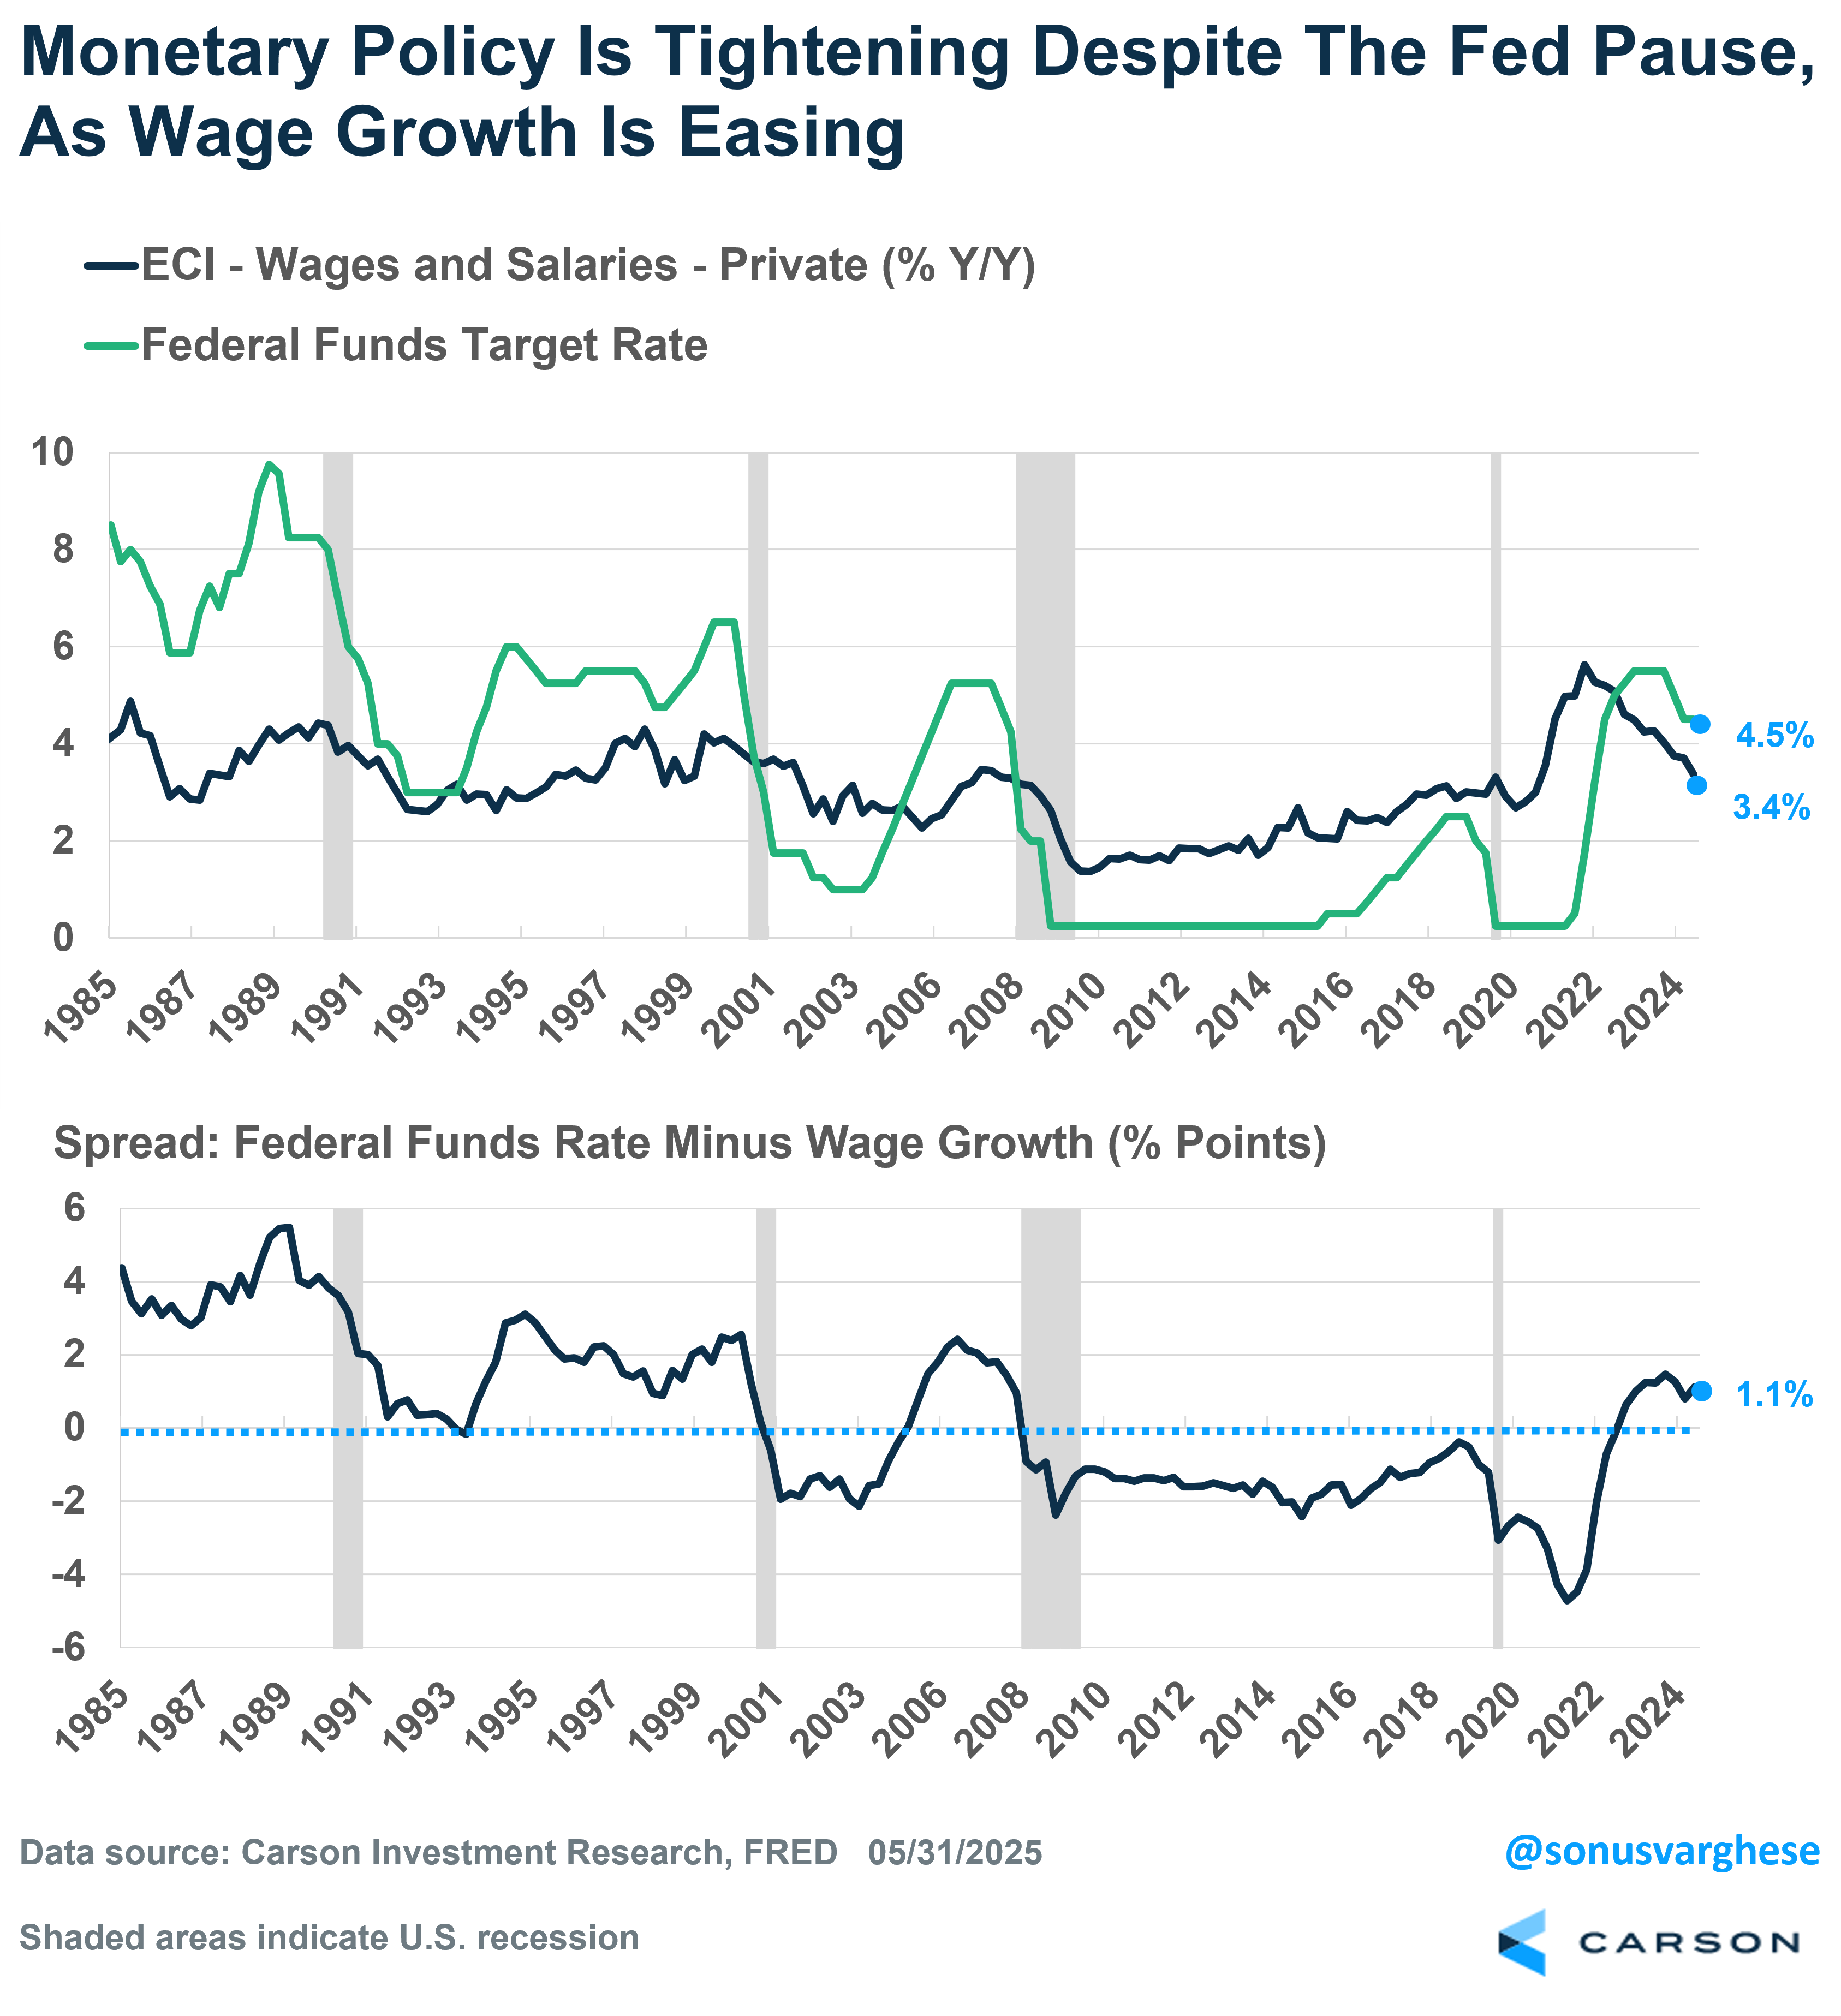
So what looks like labor market resiliency on the surface may hide weakness underneath. In my last blog, I discussed how a broad range of economic indicators, as captured in our proprietary economic index for the US, indicates that economic momentum is sliding. Also keep in mind that pausing on rate cuts is not a benign status quo — policy is implicitly getting tighter because wage growth is easing. Historically, the fed funds rate rising well above the pace of wages, i.e. increasingly tight monetary policy, has constricted the economy and ultimately these situations ended up in recessions.
Trouble in Housing
In short, policy is tight right now and it’s going to remain tight until the Fed sees more data. And that’s going to drag even more on cyclical areas of the economy, notably housing. We have a big problem in housing and some of that is because of what happened soon after Covid.
Most homeowners were able to buy or refinance at mortgage rates close to 3% in 2020 – 2021, and that meant more money in household pockets. But once rates surged in 2022, new homebuyers were locked out of the market as affordability collapsed. In addition to high mortgage rates, inventory was low and so prices moved higher. Existing homeowners were reluctant to put their house on the market because that would involve switching from an ultra-low mortgage rate to something well above 6%. Higher home prices is good for homeowners unless you want to move to another home (because that home is also more expensive) with a higher mortgage rate. Of course, this can go on for only so long. If you have to move, you have to move and this year we’re starting to see supply increasing , i.e. inventory is normalizing as more homes are put on the market. But that also means prices are easing in several cities across the country, notably in the South.
Even as supply is increasing, elevated mortgage rates close to 7% are creating a demand side problem as well. Mortgage applications are up 17% since last year, but they’re still a whopping 40% below average 2019 levels. Refinancings are down 65% from average 2019 levels. Remember, this a key mechanism by which homeowners can access home equity (which they have more of), but the door is shut because of elevated rates.

The tariff mess in April led some forecasters to predict an economic crash, as early as this summer. We were not in that camp, but that doesn’t mean we’re out of the woods. The whole tariff situation and ensuing uncertainty, along with headline labor market data hiding underlying weakness, simply increases the risk of tight monetary policy, and elevated interest rates becoming a larger and larger drag on the economy. That’s a slow burn, but a burn nonetheless with risks increasing as we get closer to year end and in early 2026.
8048221.1.-06.06.25 A
For more content by Sonu Varghese, VP, Global Macro Strategist click here
