We can use fairly timely economic data without having to wait for GDP data or calls from a “recession dating committee” (at the National Bureau of Economic Research) to gauge whether the economy is close to or in a recession, or even recovering for that matter. This includes data like initial unemployment claims, unemployment rate, survey data, housing starts and permits, factory activity and new orders, etc. A recession is a broad-based decline in economic activity and so you want to use a wide swath of data to capture the aggregate economy. I wrote about this in a recent piece on “how to identify a recession, and why it matters for investors.”
One challenge with economic data is that we get so much of it, and a lot of times it can send conflicting signals. It can be hard to parse through all of it and come up with an updated view of the economy after every data release. One approach is to combine these into a single indicator, i.e. a “leading economic index” (LEI). It’s “leading” because the idea is to give you an early warning signal about economic turning points.
Simply put, it tells you what the economy is doing today and what it is likely to do in the near future.
This is the rationale behind our Carson proprietary leading economic index (LEI). We create a leading economic index for the US and 28 other countries across the world (we used to have one for Russia but not anymore).
- Each one is custom built to capture the dynamics of those economies, and we roll them up to form an aggregate measure for different regions (for example, developed and emerging markets) and the world overall.
- Our LEIs include both soft data (like consumer and business sentiment) and hard data (though the US version doesn’t include any of the six NBER indicators).
- Our LEI include even market data. Stock prices can be a useful part of the mix, as it potentially carries information about the economy before economic data reflects what’s happening (though market data typically forms less than 5% of our index).
For the US specifically, our LEI includes 20+ components, including:
- Consumer-related indicators (makes up 50% of the index)
- Housing activity (18%)
- Business and manufacturing activity (22%)
- Financial markets (10%)
We believe our proprietary LEI captures the dynamics of the US economy better than other popular leading indicators, which tend to be geared toward the manufacturing sector, business activity, and sentiment. Keep in mind that consumer spending generally makes up over two-thirds of the economy, and we believe it’s important to capture that (especially labor market dynamics).
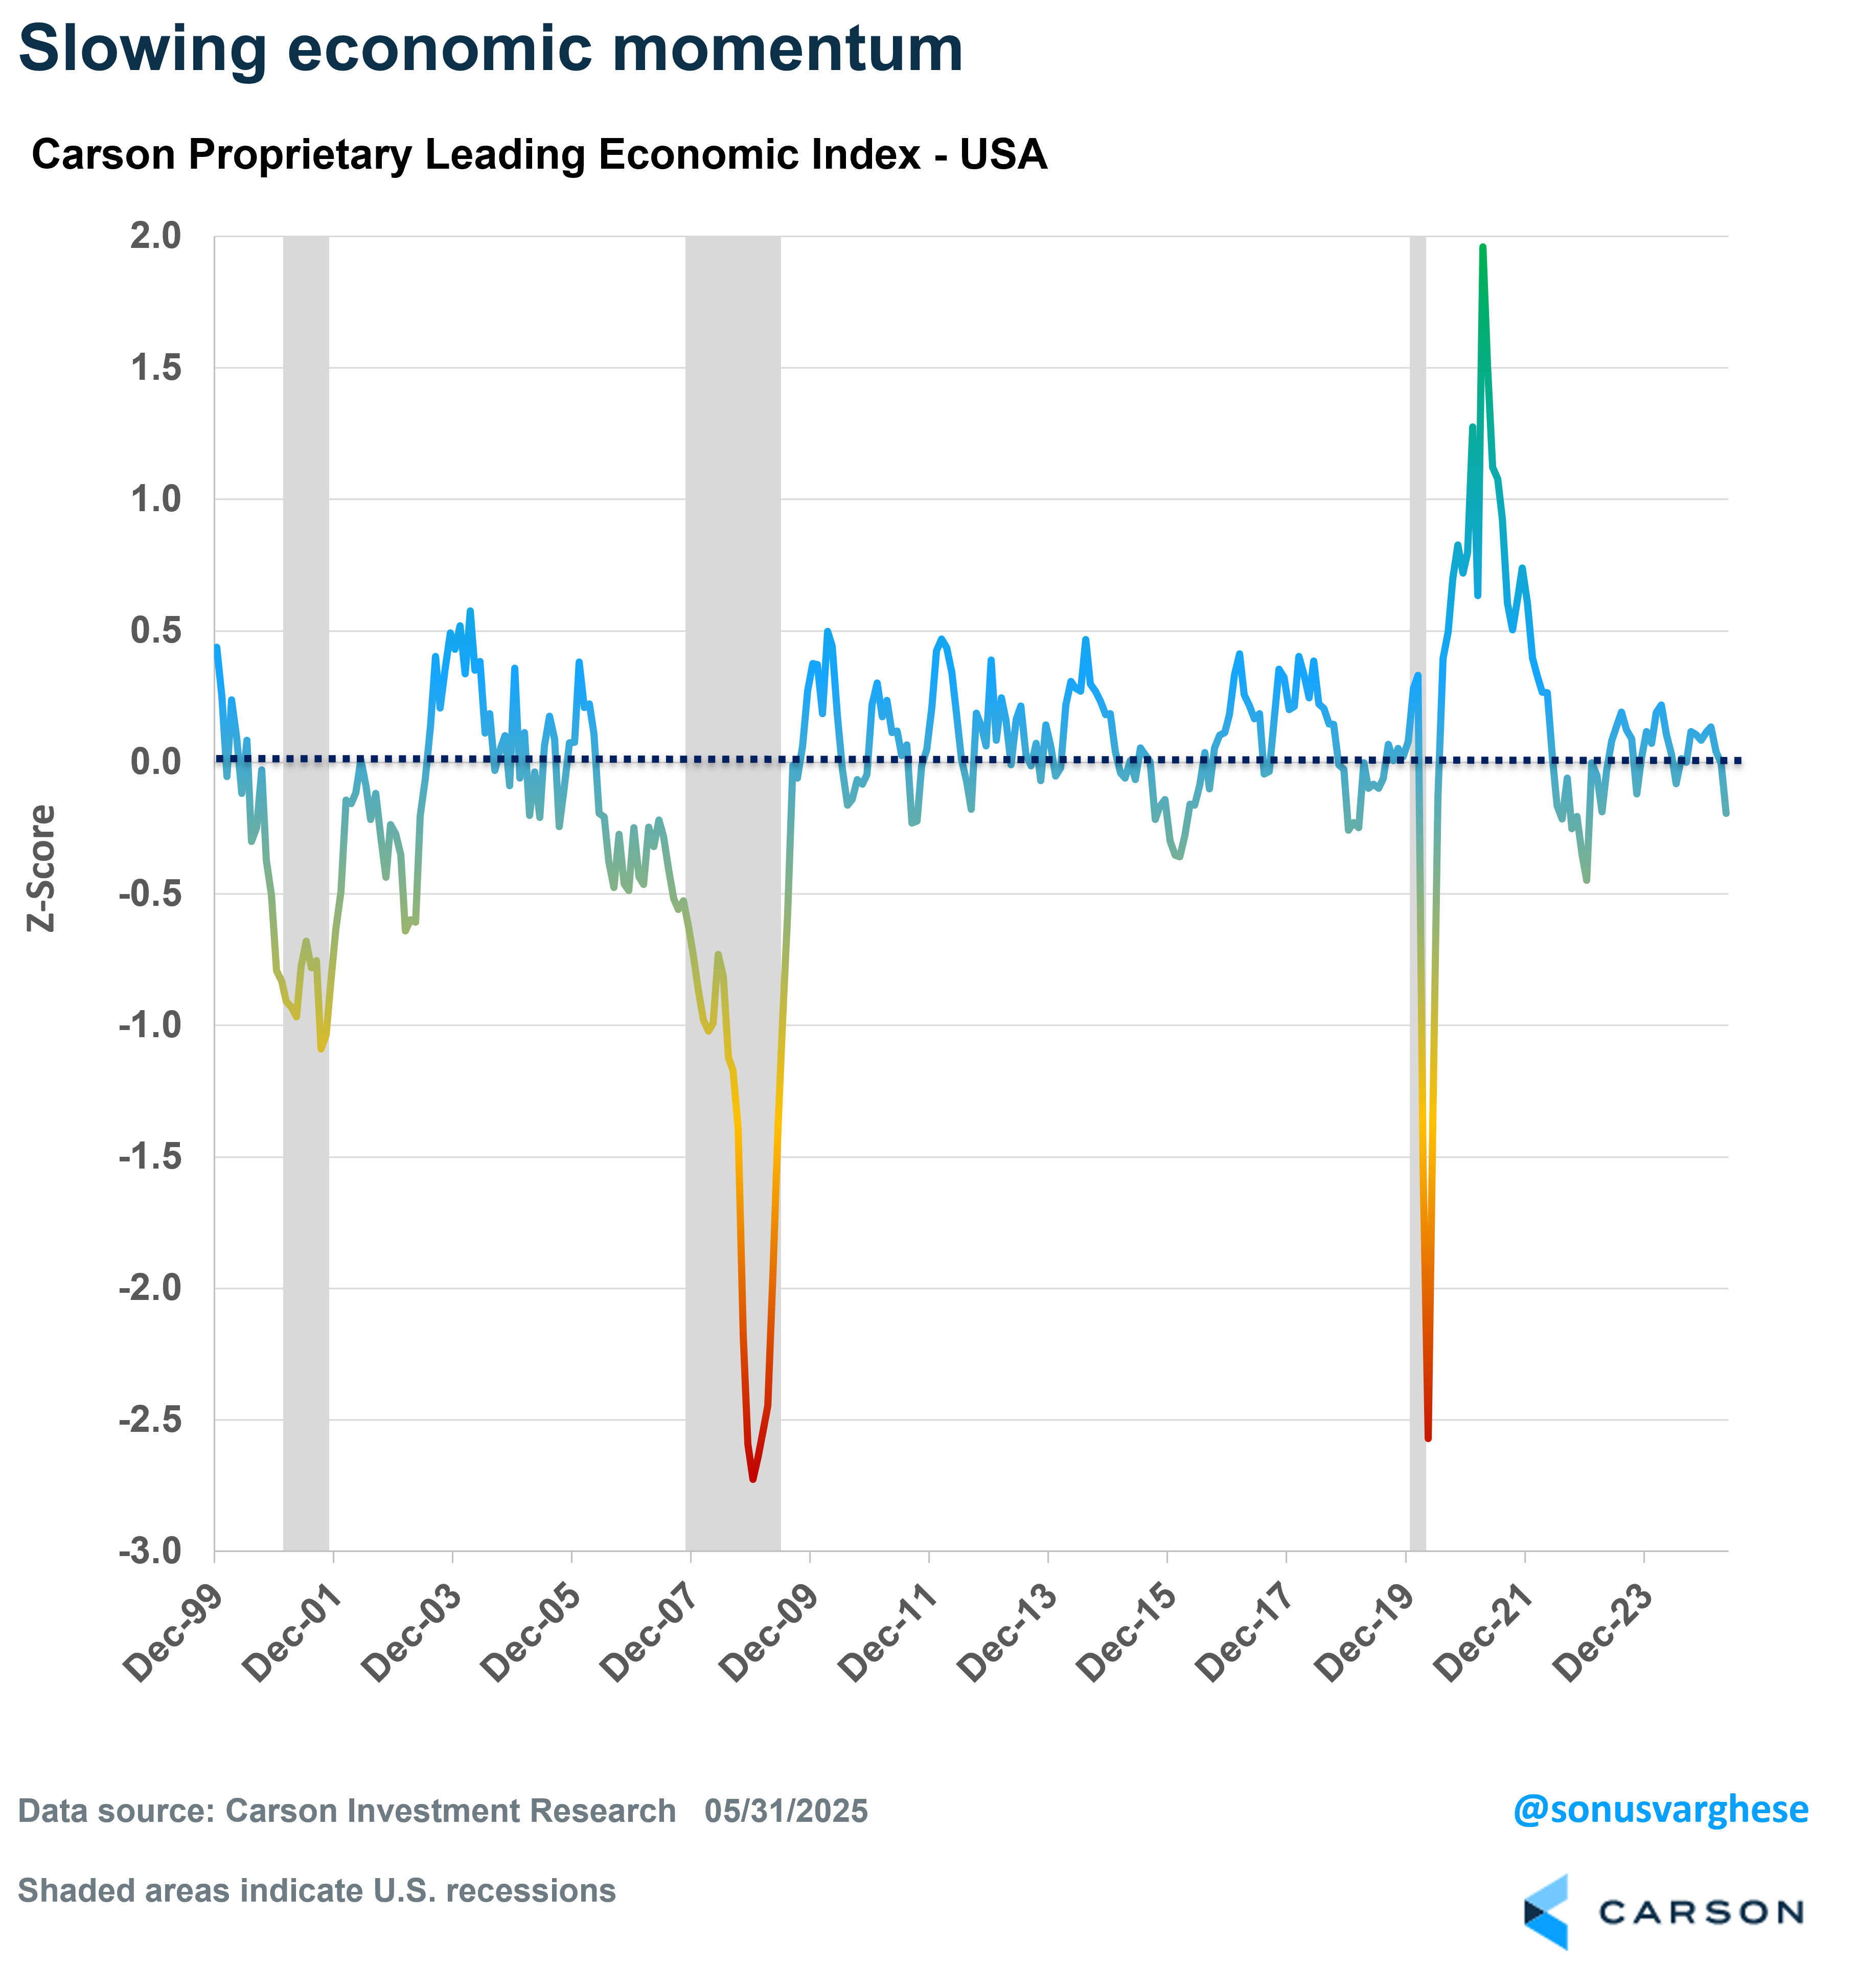
US LEI deteriorates
Right now, our US LEI is telling us that economic momentum is slowing and the economy is growing below trend. At the same time, the current level of the LEI is still above levels we would normally associate with a recession, or even just prior to it — you can see in the chart below that the LEI had deteriorated much further even prior to the 2001 and 2008 recessions.
Current levels are similar to what we saw in mid-2022, when recession risks were elevated but the economy never plunged into an actual recession. This was a big reason why we didn’t call for a recession anytime between 2022 and 2024. This was in sharp contrast to all the recession calls you saw in 2022 and 2023, including signals from other popular leading economic indicators. You can also see that the LEI deteriorated in a sharp manner back in 2018, amid the trade war and Fed tightening. But the economy avoided a recession back then too.
Stay on Top of Market Trends
The Carson Investment Research newsletter offers up-to-date market news, analysis and insights. Subscribe today!
"*" indicates required fields
Another advantage of creating our own LEI is that we know what goes into it, and what’s driving it. As it turns out, the recent deterioration in the index has come on the back of poor consumer and business sentiment, rather than “hard data.” The hard data is mostly hanging in just fine, for now. In some ways, this is akin to what we saw in 2022, when we feel most of the plunge was driven by poor survey data.

Note that the overall level is actually not far below trend (when the value is zero). It could very well level off here, or even reverse, especially if the tariff situation doesn’t get worse from here. Still, the recent deterioration tells us that risks are higher than they were at the end of last year, and that’s something to be aware of.
This is a big reason why we’re cautiously overweight equities in our models, rather than pedal to the metal (as we were over the last two years). Since the beginning of the year we’ve also shifted from a mid and small-cap overweight to a large cap overweight instead.
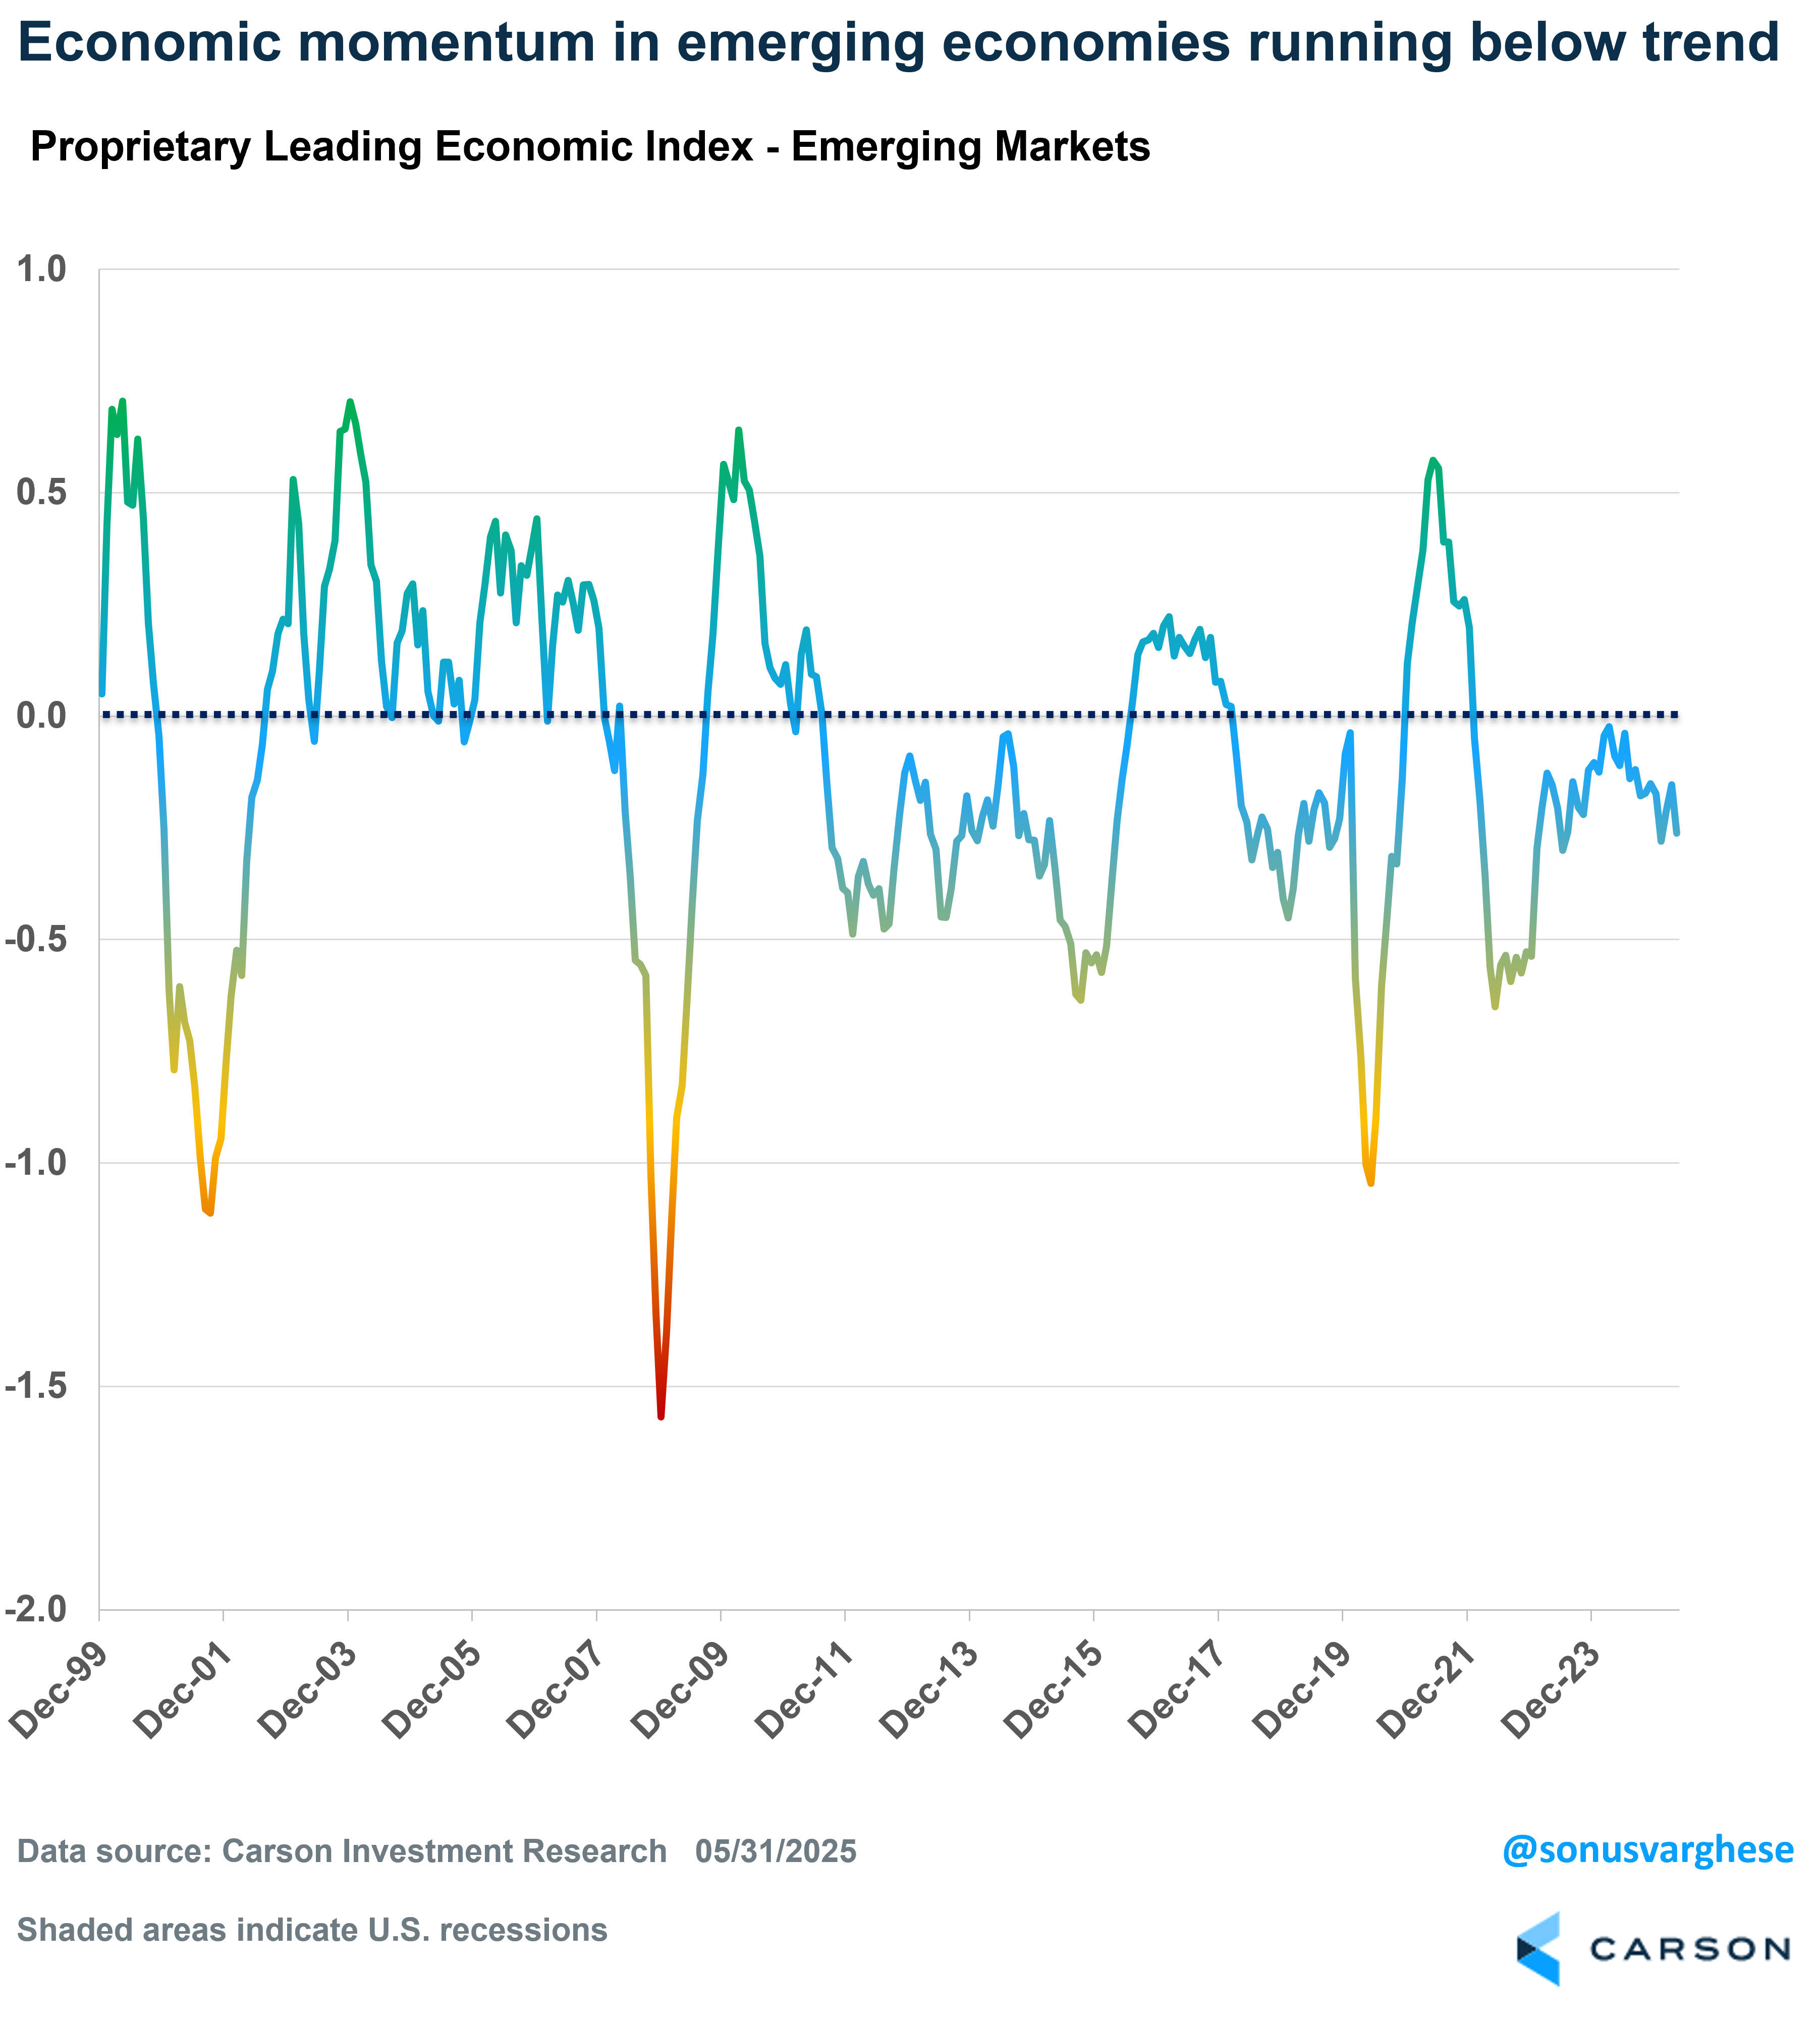
A Mixed Picture Abroad
Interestingly, developed markets (ex US) are growing slightly closer to trend than the US. And it’s not being driven by any one country — countries across Europe and even Japan and Australia are seeing economic activity running near trend. Of course, keep in mind that trend growth in these countries is lower than what it has been in the US over the last 25 years.

In contrast, economic momentum in emerging markets is running a fair bit below trend. No prizes for guessing the country that’s driving this — yes, it’s China. Economic growth in China is running well below the trend we saw over the last decade, let alone the last two decades. Of course, a Chinese economy that is not firing on all cylinders is not helpful for its neighbors, and activity in nearby Asian countries, including South Korea, Taiwan, Singapore, Malaysia, and Indonesia are also running below trend. India is bit of an exception, with economic momentum picking up recently. Mexico is another country where activity is running near trend — the tariff reprieve it got from President Trump was huge.
As I noted above, we remain overweight equities but continue to expect to see the benefits from a diversified portfolio, with areas like developed international stocks (with an emphasis on Europe) seeing some benefits from changes in the global economy. We have raised our international allocation to a benchmark weight after being underweight the last several years. Most US investors might not know this, but global stock markets are having banner years, many up well over double digits. I discussed this in my prior blog. In fact, the tariff situation has also pushed the rest of the world to get its act together, with countries like Germany removing its fiscal handcuffs (I wrote about this back in March). We are overweight developed markets (especially Europe) and remain underweight emerging markets.
Our LEI is an important piece of the puzzle as we form our Carson House Views since it encapsulates a lot of significant macroeconomic information. But it is not a “silver bullet” indicator (no indicator should be, or can be). Our proprietary LEI is only one input into our asset allocation, portfolio, and risk management decisions. Our process also has other pillars such as looking at monetary and fiscal policy, technical factors, and valuations.
Ryan and I talked about the policy and technical factors in our most recent episode of Facts vs Feelings. Take a listen.
8042937.1.-06.05.25A
For more content by Sonu Varghese, VP, Global Macro Strategist click here