
We’ve been writing since the end of last year about how we believe the economy can avoid a recession in 2023, including in our 2023 outlook. This has run contrary to most other economists’ predictions. Interestingly, the tide has been shifting recently, as we’ve gotten a string of relatively stronger economic data. More so after the latest payrolls data, which surprised again.
One challenge with economic data is that we get so many of them, and a lot of times they can send conflicting signals. It can be hard to parse through all of it and come up with an updated view of the economy after every data release.
One approach is to combine these into a single indicator, i.e. a “leading economic index” (LEI). It’s “leading” because the idea is to give you an early warning signal about economic turning points.
Simply put, it tells you what the economy is doing today and what it is likely to do in the near future.
Stay on Top of Market Trends
The Carson Investment Research newsletter offers up-to-date market news, analysis and insights. Subscribe today!
"*" indicates required fields
The most popular LEI points to recession
One of the most widely used LEI’s is released by the Conference Board, and it currently points to recession. As you can see in the chart below, the Conference Board’s LEI is highly correlated with GDP growth – the chart shows year-over-year change in both.
You can see how the index started to fall ahead of the 2001 and 2008 recession (shaded areas). The 2020 pandemic recession was an anomaly since it hit so suddenly. In any case, using an LEI means we didn’t have to wait for GDP data (which are released well after a quarter ends) to tell us whether the economy was close to, or in a recession.
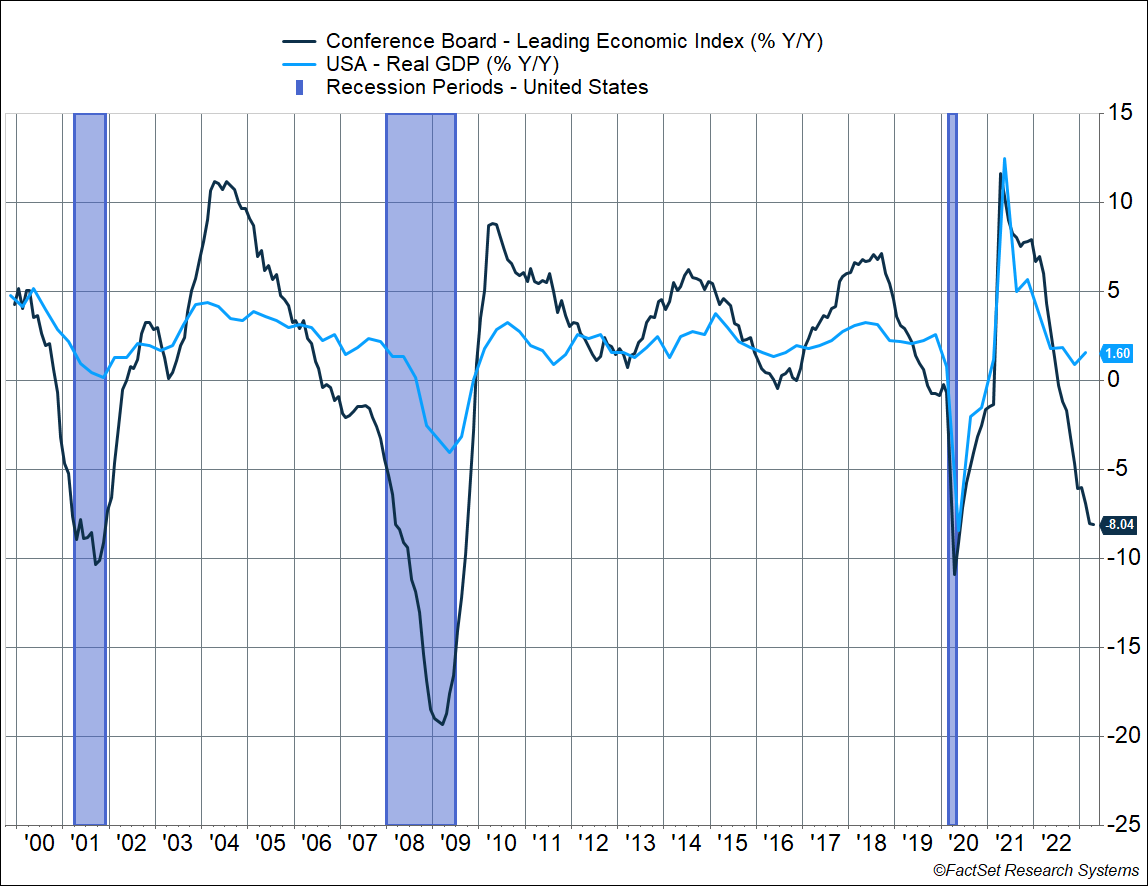
As you probably noticed above, the LEI is down 8% year-over-year, signaling a recession over the next 12 months. It’s been pointing to a recession since last fall, with the index declining for 13 straight months through April.
Quoting the Conference Board:
“The Conference Board forecasts a contraction of economic activity starting in Q2 leading to a mild recession by mid-2023.”
Safe to say, we’re close to mid-2023 and there’s no sign of a recession yet.
What’s inside the LEI
The Conference Board’s LEI has 10 components of which,
- 3 are financial market indicators, including the S&P 500, and make up 22% of the index
- 4 measure business and manufacturing activity (44%)
- 1 measures housing activity (3%)
- 2 are related to the consumer, including the labor market (31%)
You can see how these indicators have pulled the index down by 4.4% over the past 6 months, and by -0.6% in April alone.
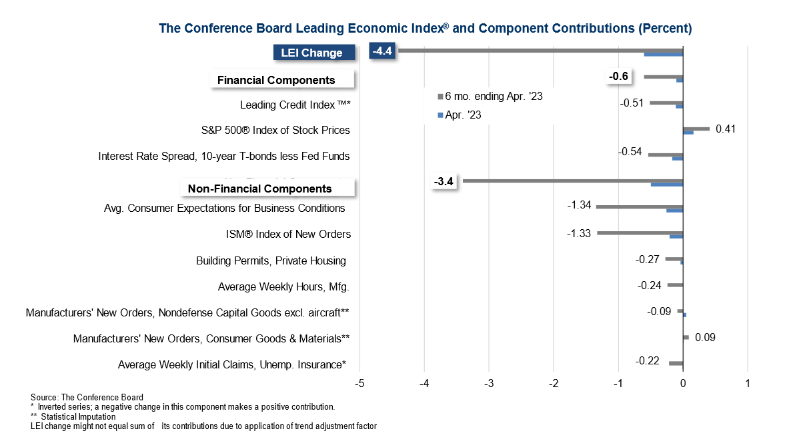
Here’s the thing. This popular LEI is premised on the fact that the manufacturing sector, and business activity/sentiment, is a leading indicator of the economy. This worked well in the past but is probably not indicative of what’s happening in the economy right now. For one thing, the manufacturing sector makes up just about 11% of GDP.
Consumption makes up 68% of the economy, and we believe it’s important to capture that.
In fact, consumption was strong in Q1 and even at the start of Q2, thanks to rising real incomes. Housing is also making a turnaround and should no longer be a drag on the economy going forward (as it has been over the past 8 quarters). The Federal Reserve (Fed) is also close to being done with rate hikes. Plus, as my colleague, Ryan Detrick pointed out, the stock market’s turned around and is close to entering a new bull market.
Obviously, there are a lot of data points that we look at and one way we parse through all of it is by constructing our own leading economic index.
An LEI that better reflects the US economy
We believe our proprietary LEI better captures the dynamics of the US economy. It was developed a decade ago and is a key input into our asset allocation decisions.
In contrast to the Conference Board’s measure, it includes 20+ components, including,
- Consumer-related indicators (make up 50% of the index)
- Housing activity (18%)
- Business and manufacturing activity (23%)
- Financial markets (9%)
Just as an example, the consumer-related data includes unemployment benefit claims, weekly hours worked, and vehicle sales. Housing includes indicators like building permits and new home sales.
The chart below shows how our LEI has moved through time – capturing whether the economy is growing below trend, on-trend (a value close to zero), or above trend. Like the Conference Board’s measure, it is able to capture major turning points in the business cycle. It declined ahead of the actual start of the 2001 and 2008 recessions.
As of April, our index is indicating that the economy is growing right along trend.
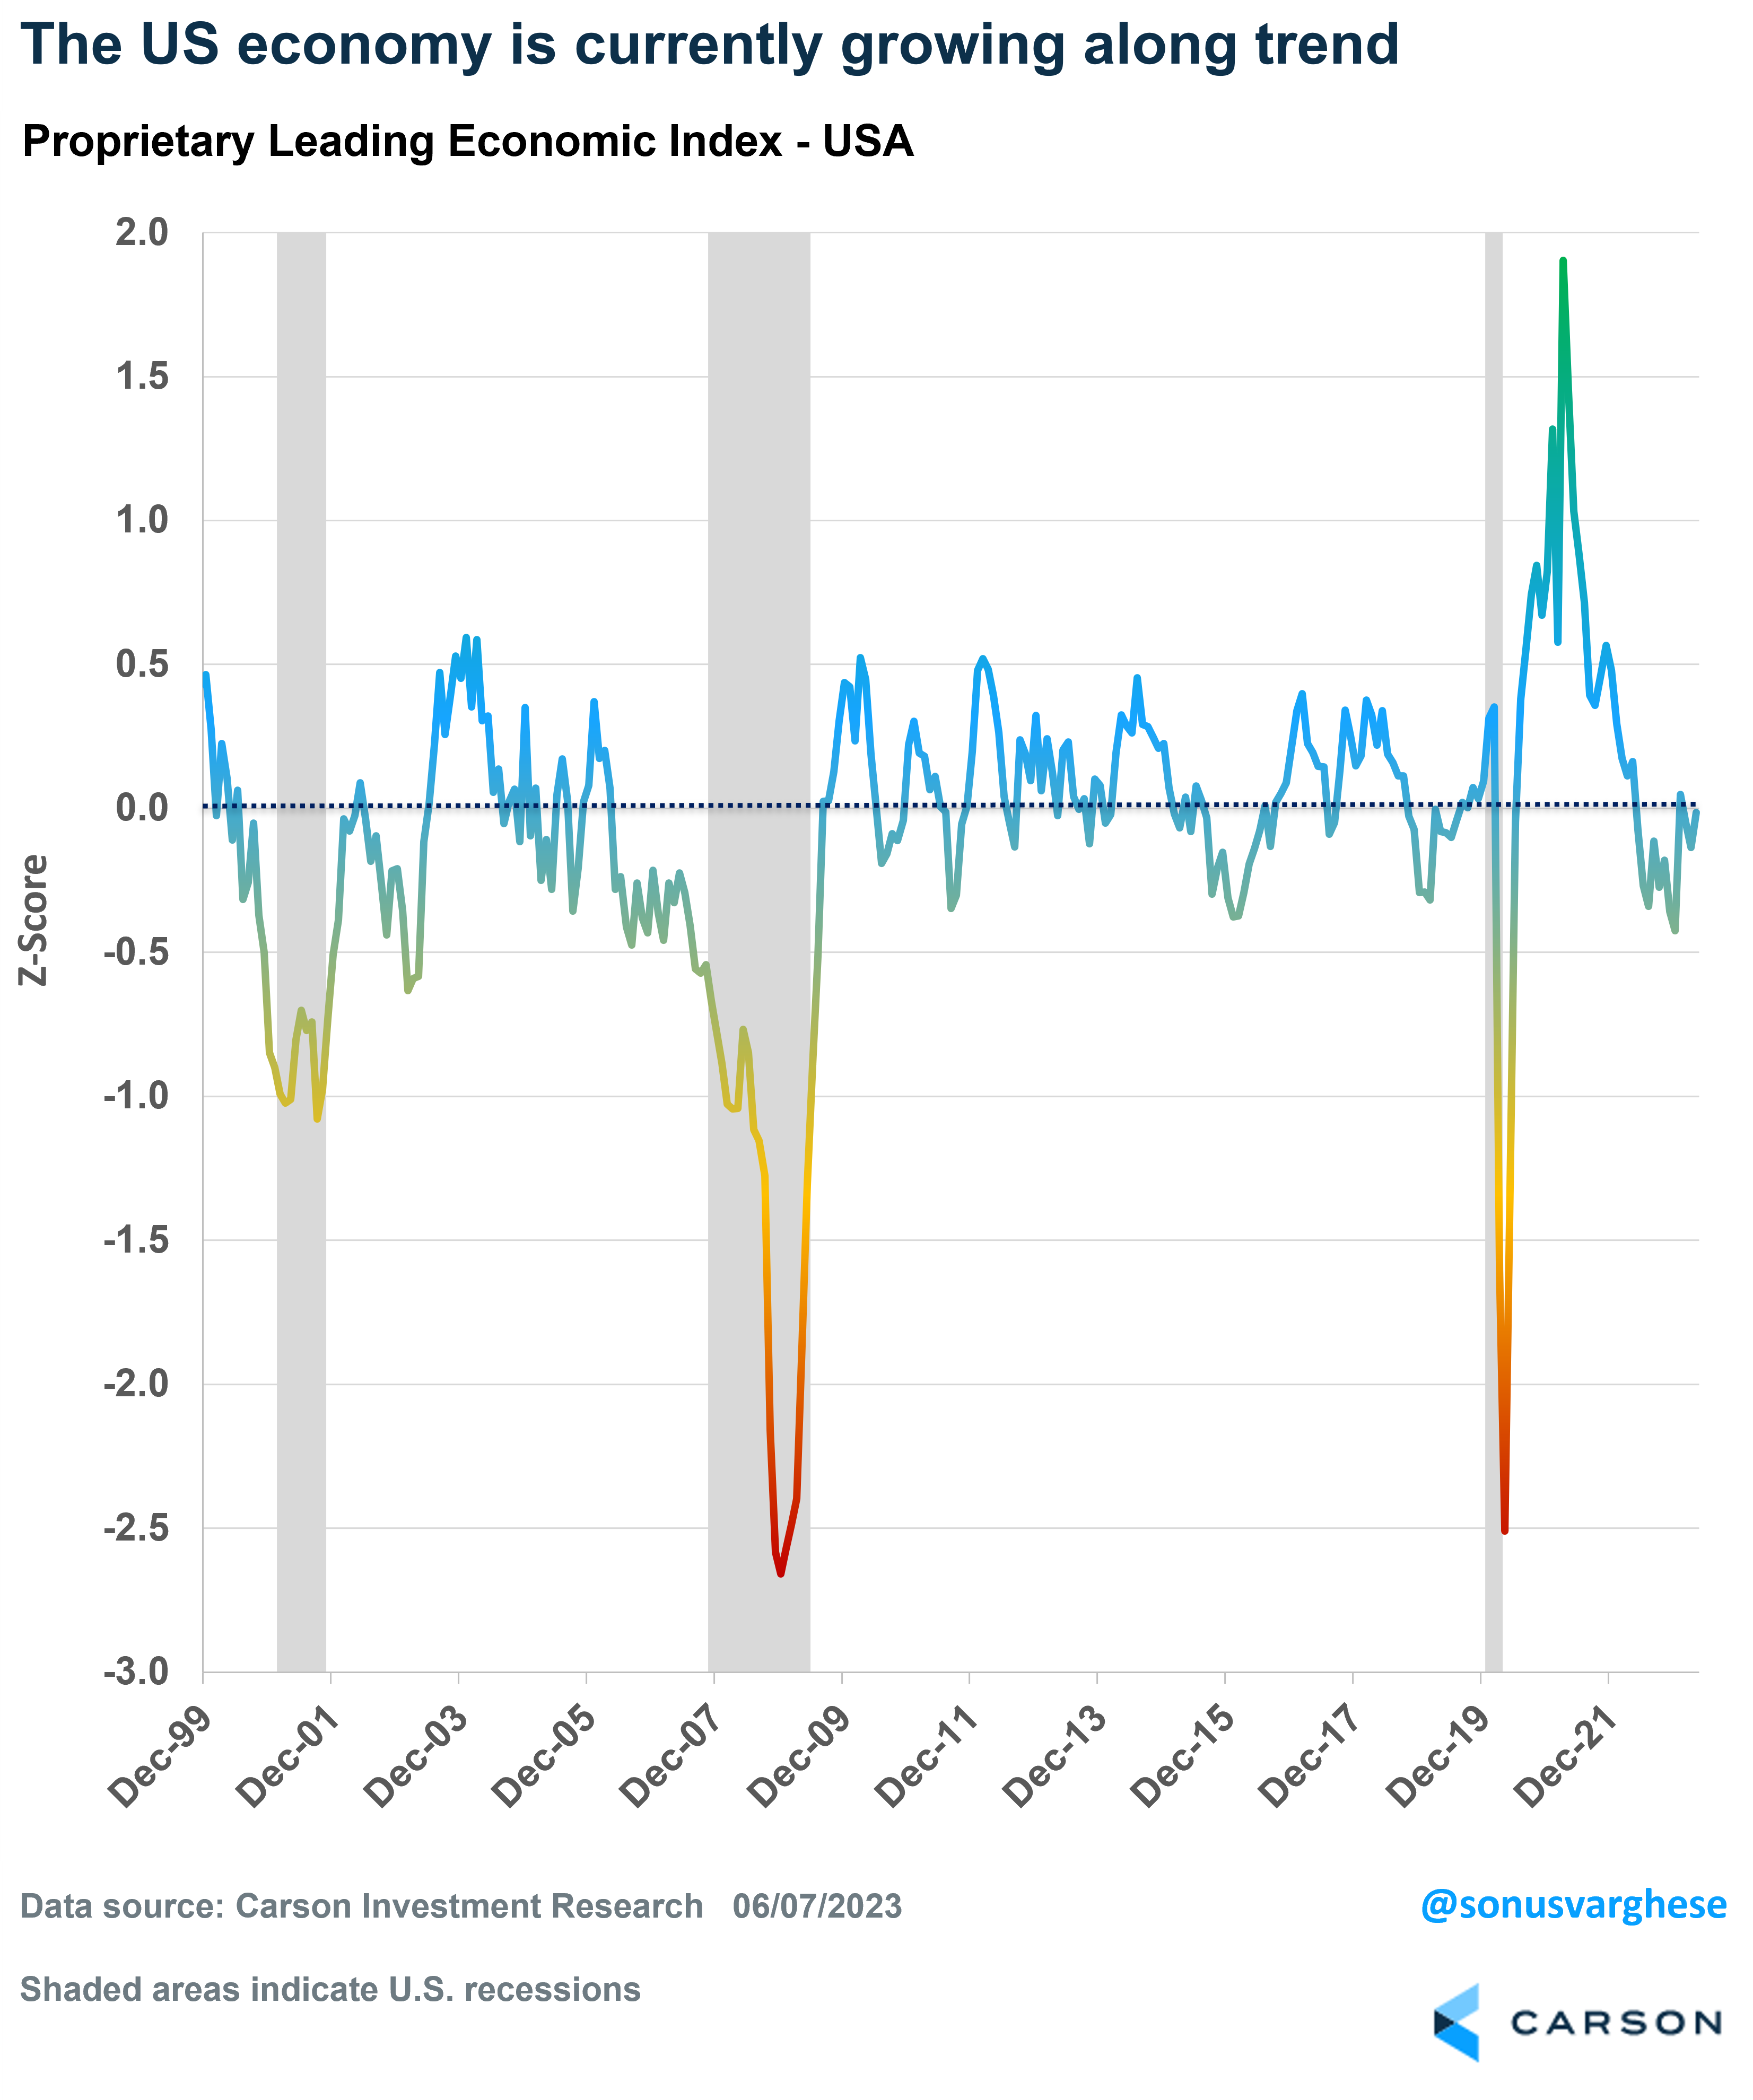
Last year, the index signaled that the economy was growing below trend, and that the risk of a recession was high.
Note that it didn’t point to an actual recession. Just that “risk” of one was higher than normal. In fact, our LEI held close to the lows we saw over the last decade, especially in 2011 and 2016 (after which the economy, and even the stock market, recovered).
The following chart captures a close-up view of the last 3 and half years, which includes the Covid pullback and subsequent recovery. The contribution from the 4 major categories is also shown. You can see how the consumer has remained strong over the past year – in fact, consumer indicators have been stronger this year than in late 2022.
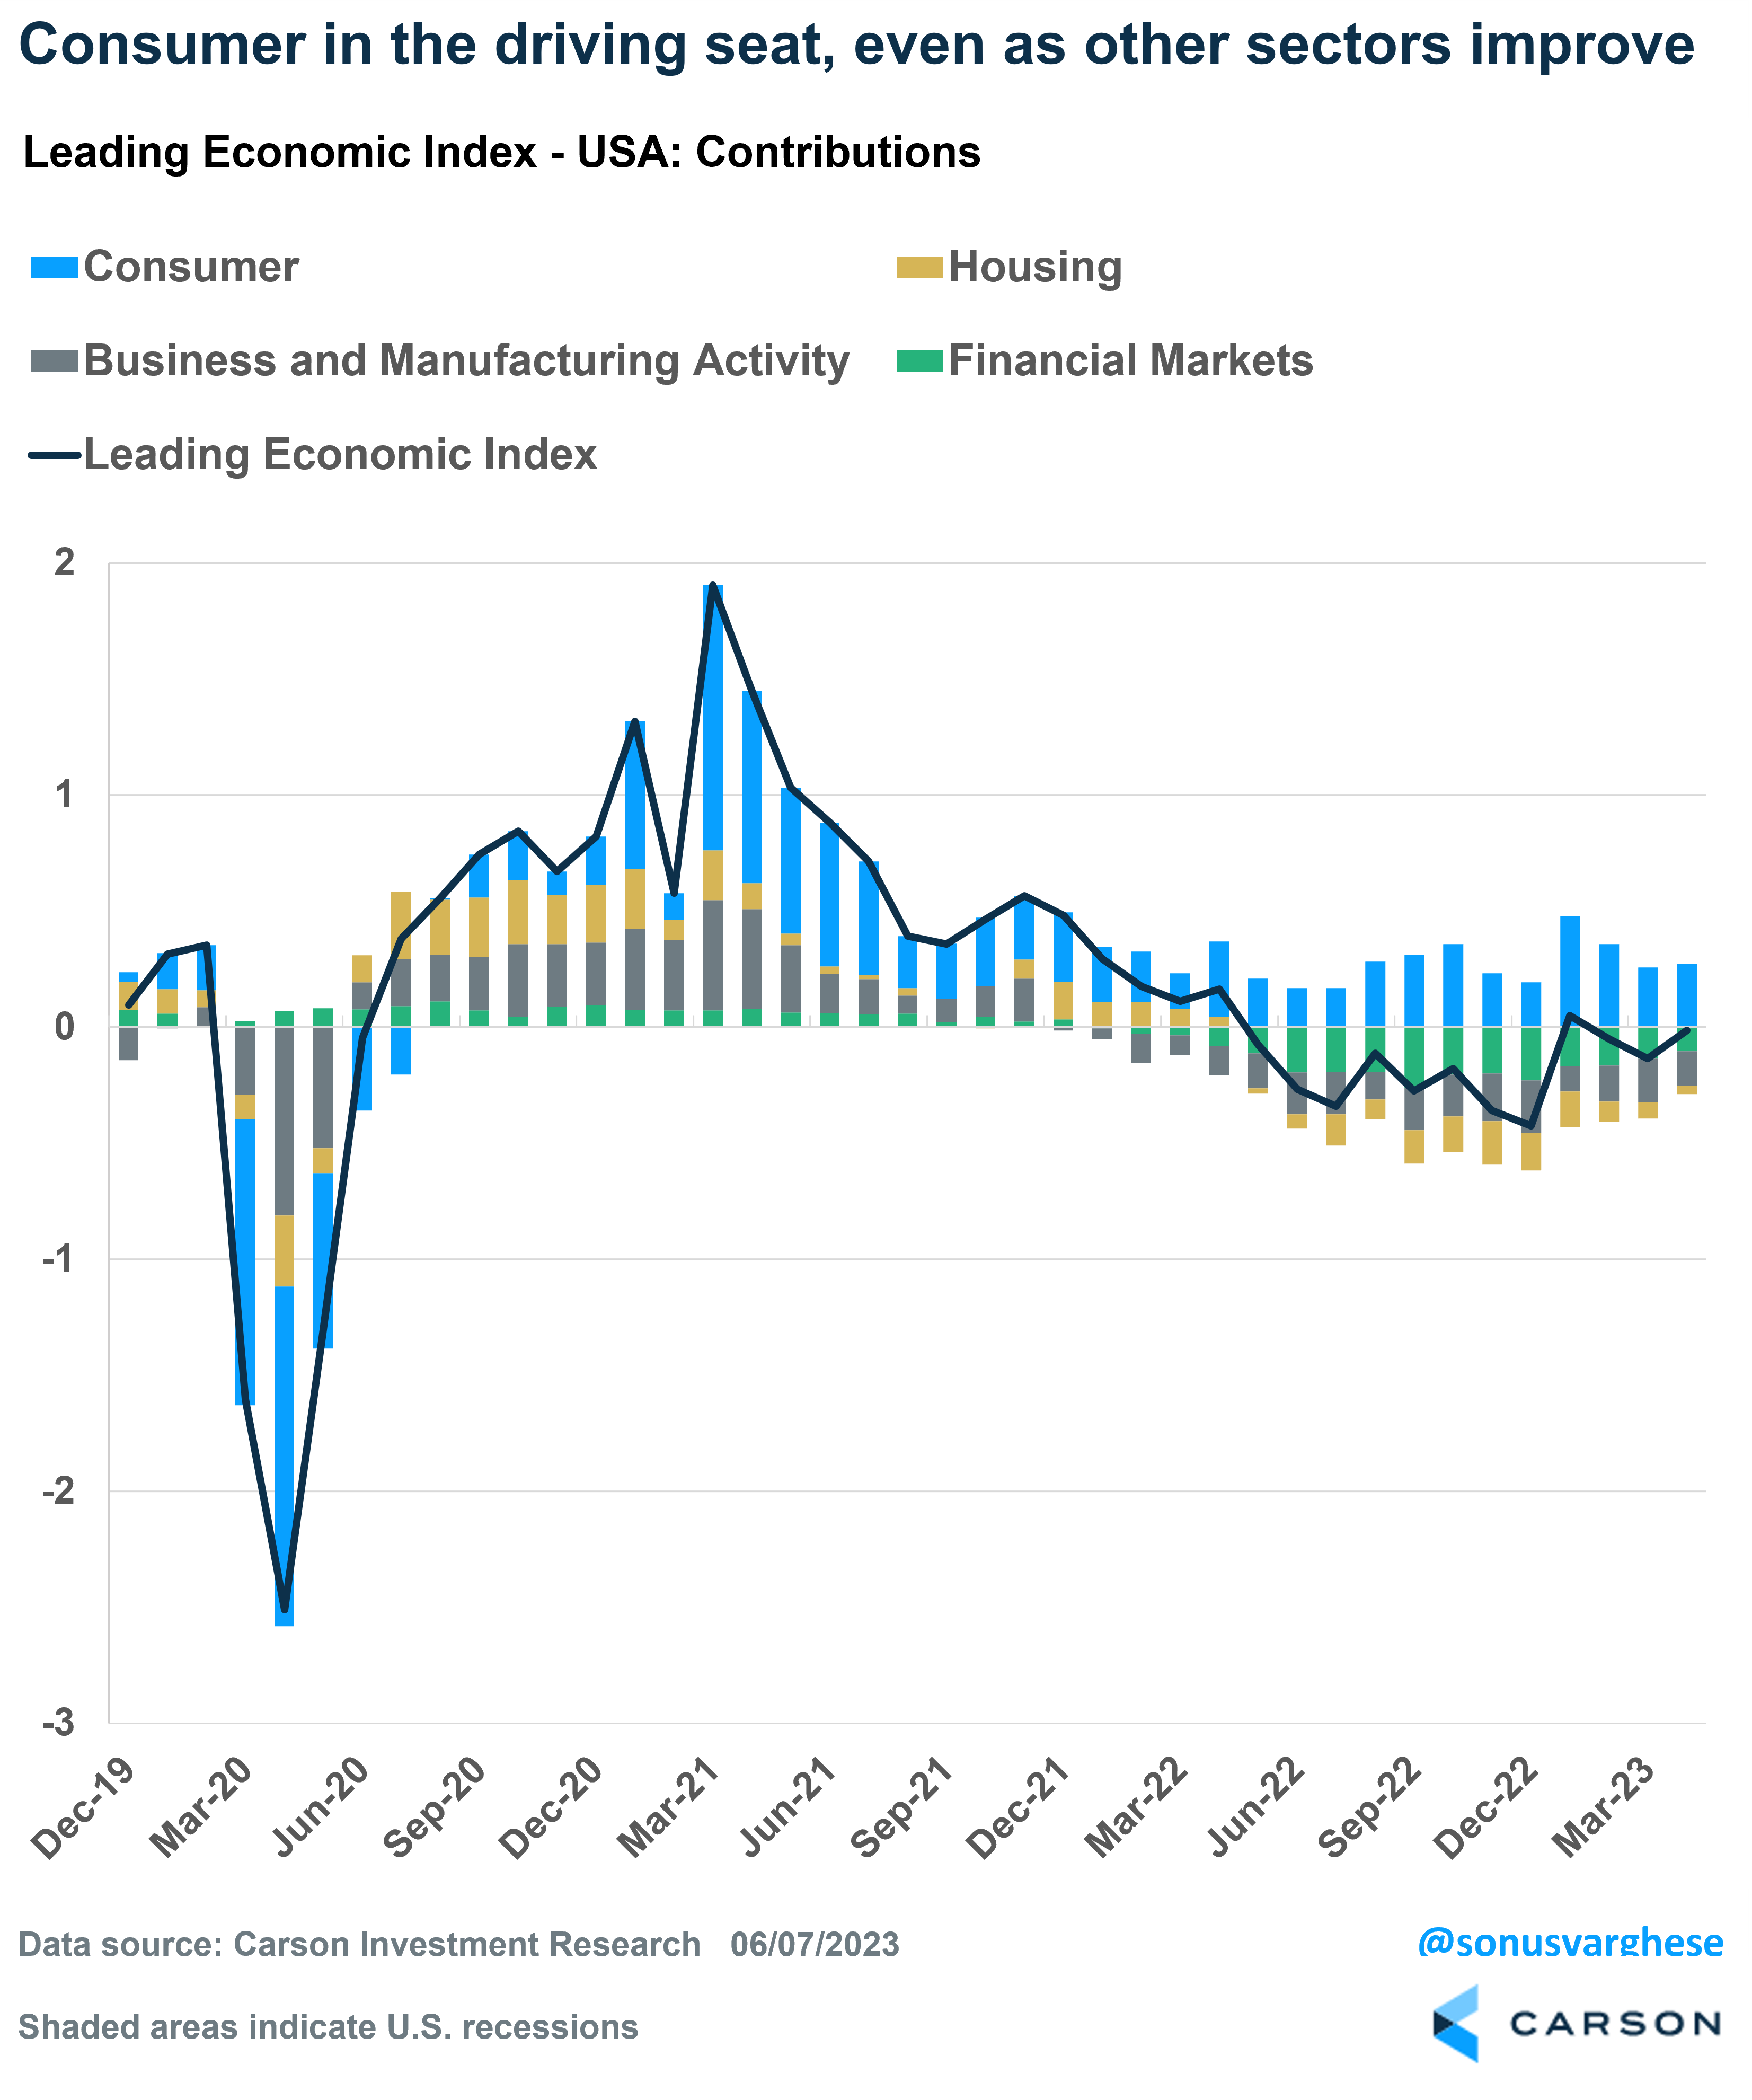
The main risk of a recession last year was due to the Fed raising rates as fast as they did, which adversely impacted housing, financial markets, and business activity.
The good news is that these sectors are improving even as consumer strength continues. The improvement in housing is notable. Additionally, the drag from financial conditions is beginning to ease as we think that the Federal Reserve gets closer to the end of rate hikes, and markets rally.
Putting the Puzzle Together
Another novel part of our approach is that we have an LEI like the one for the US for more than 25 other countries. Each one is custom built to capture the dynamics of those economies. The individual country LEIs are also subsequently rolled up to a global index to give us a picture of the global economy, as shown below.
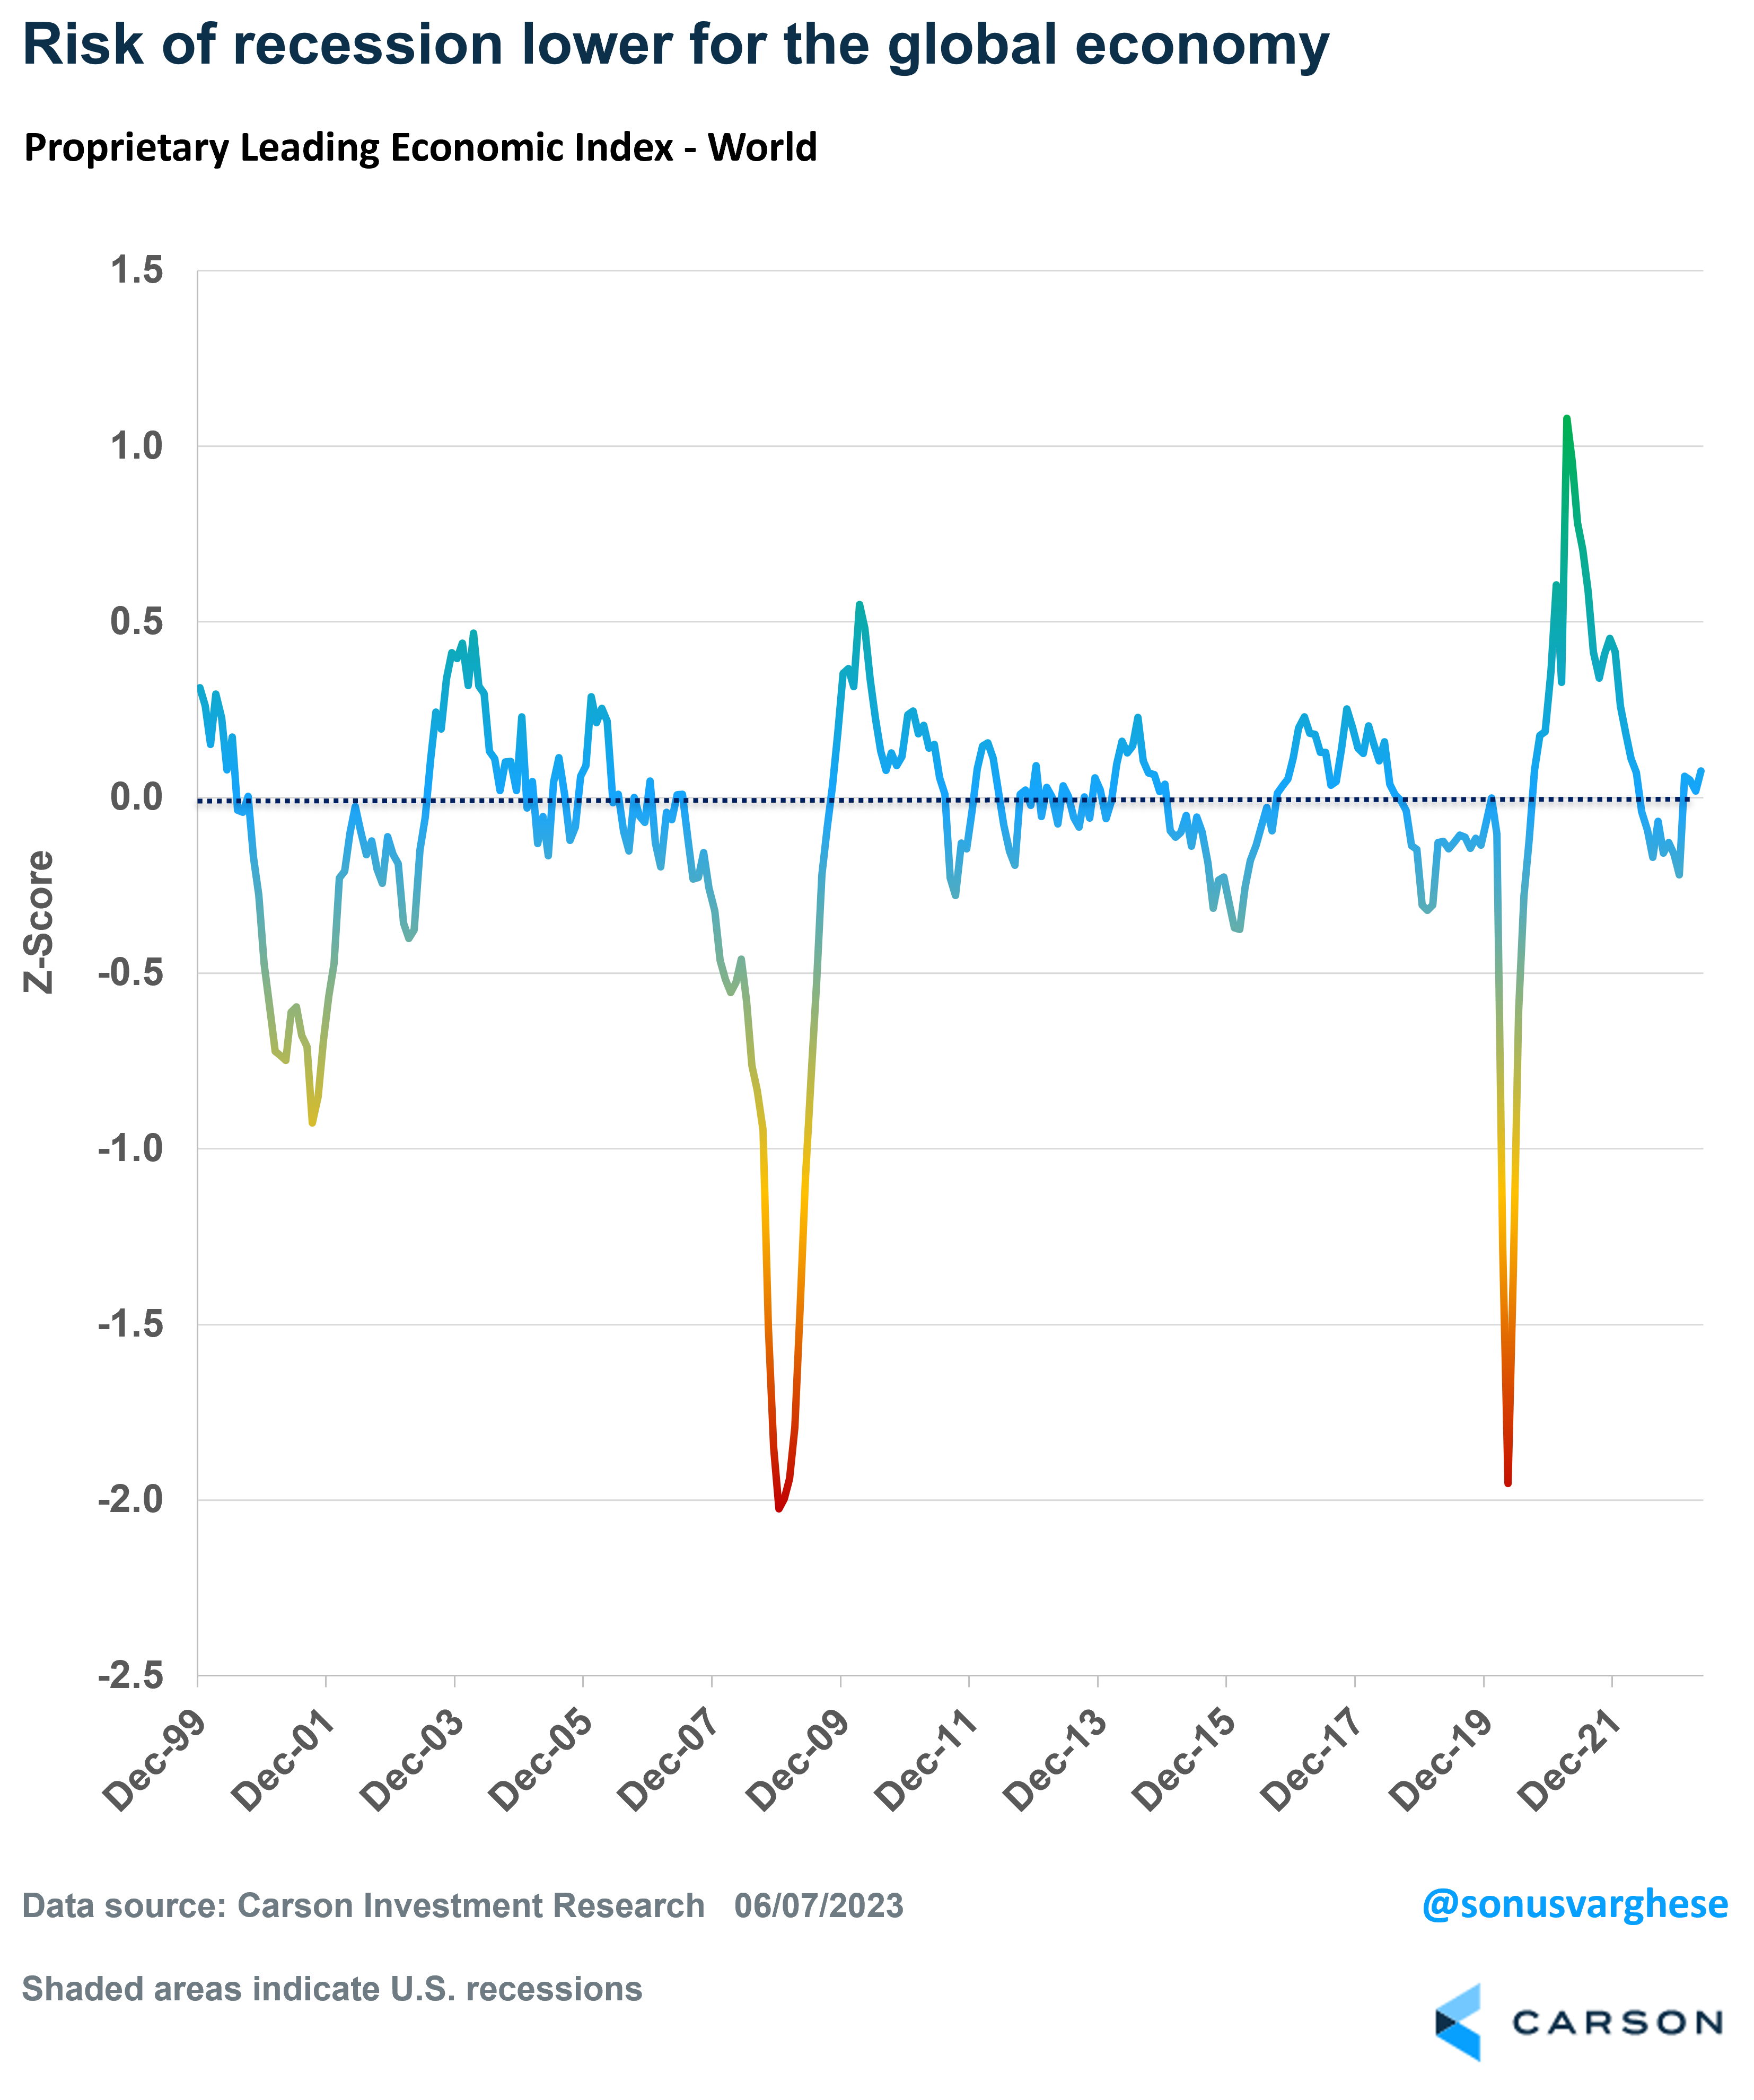
I want to emphasize that we do not rely solely on this as the one and only input into our asset allocation, portfolio and risk management decisions. While it is an important component that encapsulates a lot of significant information, it is just one piece of the puzzle. Our process also has other pillars such as policy (both monetary and fiscal), technical factors, and valuations.
We believe it’s important to put all these pieces together, kind of like putting together a puzzle, to understand what’s happening in the economy and markets, and position portfolios accordingly.
Putting together a puzzle is both a mechanistic and artistic process. The mechanistic aspect involves sorting the pieces, finding edges, and matching colors, etc. It requires a logical and methodical approach, and in our process the LEI is key to that.
However, there is an artistic element as well. As we assemble the pieces together, a larger picture gradually emerges. You can make creative decisions about how each piece fits within the overall picture. Within the context of portfolio management, that takes a diverse range of experience. Which is the core strength of our Investment Research Team.