- High short-term yields and leftover anxiety from 2022 led to underinvestment in bonds in 2025.
- 2022 bond losses were unusual, but some bond volatility is not.
- 2025 returns were partially driven by yields being pulled down by rate cuts.
- We believe that process may have run its course for longer-term yields.
- Uncertainty still makes bonds a reasonable hedge, but the effects of rate cutting on longer-term yields may be offset by persistent inflation.
“I gotta have more cowbell!” Christopher Walkin, Saturday Night Live, April 8, 2000
Ah, cowbell. It marks time with a slightly resonant metallic pulse, grounding the beat when everything else is surging forward. Useful, staid but not empty, mostly unremarkable, it took a comic genius like Will Ferrell to draw out the full joy of the cowbell as if to say, “Take that tambourine, you poser.”
I sometimes wish I could do the same for bonds. Few things spoil a portfolio like cowbell-like fixed income aspiring to play lead. But there is an unheralded vitality to the simple pleasure of a steady coupon, the comforting assurance of the return of principal at maturity no matter the price fluctuations while getting there, and the ability to hold everything together when chaos threatens. I am not a bond guy, but if I were I would want to speak for bonds with the same affection that Will Farrell’s Gene Frankel embodied the cowbell.
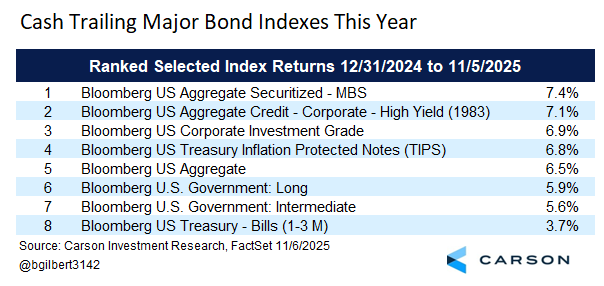
And I’ve tried. Almost exactly a year ago (on November 19, 2024), I wrote a blog that included three reasons the 10-year Treasury yield may be around 4% in a year. It wasn’t a popular call at the time, with many investors still preferring short-term bonds, but as of close on Tuesday, the 10-year Treasury yield was at 4.09%. That decline in yields has helped push the return for the Bloomberg US Aggregate Bond Index (“Agg”), a broad index of investment-grade bonds, up to 6.5% year to date. That’s not something stock investors would get particularly excited about (the S&P 500 is up 16.8% this year), but as it stands it would be the sixth best year for the Agg in the last 20 years.
But short-term yields have also been high, although not as high as they had been now that the Fed is cutting rates. The Bloomberg 1-3 Month Treasury Bill Index is returning 3.6% year to date, not too bad for “cash,” and the performance advantage of the Agg over cash this year of 3.2%-points would only be the ninth best of the last twenty years, so middle of the road.
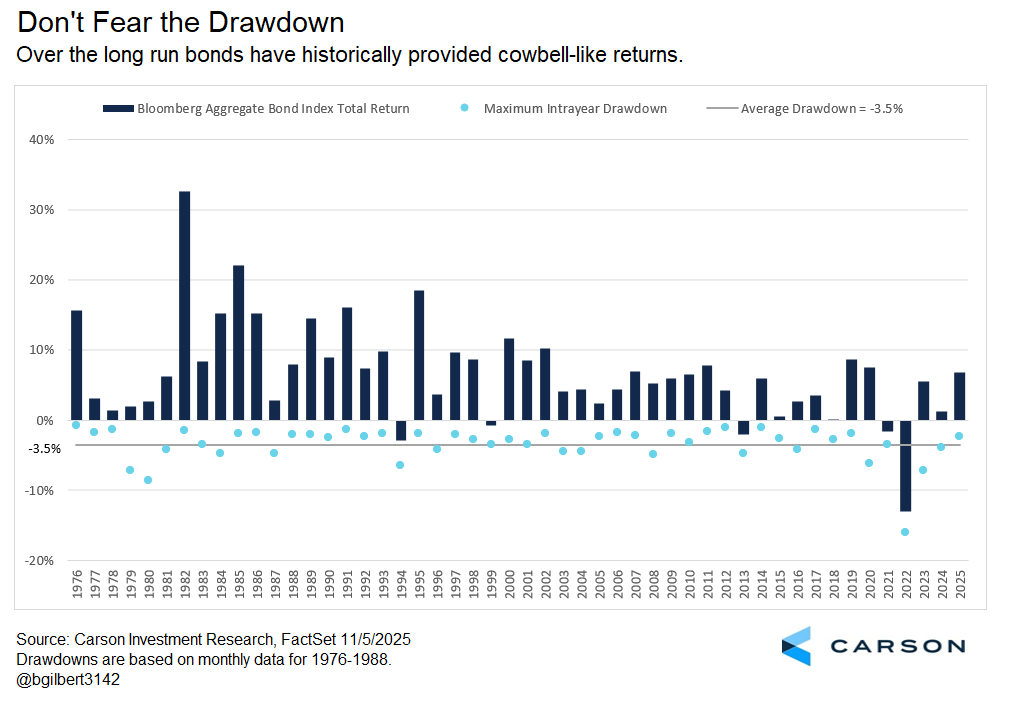
So why the preference for cash over bonds during a period when bonds have done fairly well? One answer is likely that leftover fear from 2022’s “Bondmageddon” still looms large in investors’ imaginations. There are good reasons to seek out some additional sources of diversification outside bonds, but 2022 shouldn’t be one of them. That would be like letting the S&P 500’s -37% return in 2008 control our perception of stocks. You just need to look at where the S&P 500 is now to know that approach has badly missed the mark. I can’t say 2022 won’t happen again, but it’s easy to see it’s an anomaly, driven by ultralow yields, a historically aggressive rate hiking campaign, and complacency among bond investors. We often say volatility is the toll we pay to invest. That doesn’t apply in quite the same way in the lower-return bond world, but there’s still a lesson to be taken from it.
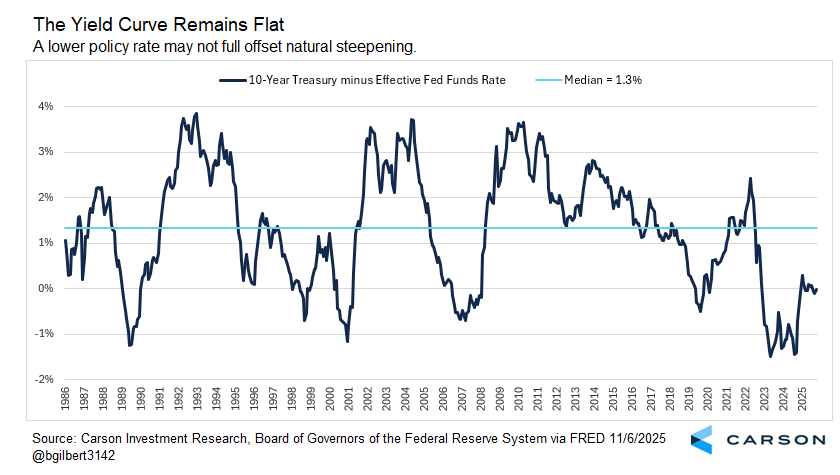
But there’s another reason that’s more logical—strong short-term yields. Between October of 2022 and December of 2023, Treasury bills actually offered a higher yield than the 10-year Treasury and even though that’s reversed, the advantage of 10-year Treasuries has remained under 0.5%. But as the Fed cuts rates that yield advantage for bonds will grow, even if we’re not there yet. The chart below shows the historical spread of the 10-year Treasury yield over the effective fed funds rate. We’re still flat, for now. That means the direction of 10-year Treasury yields is still very important because if yields remained flat (not what we expect), the return of longer-term bonds and shorter-term bills would be similar. But 10-year Treasuries are sensitive to yield movements (prices fall when yields rise). If the Fed cuts in line with current expectations, taking the Fed funds target range to 3.0–3.25% at the end of 2026, the return from Treasury bills would be about 3.5%, depending on timing. That means the 10-year yield can only rise little (0.05% to 0.10%) and still match the return from Treasury bills and lose ground if it rises more. But if the 10-year yield stays steady or falls, it could continue to have the better return.
Stay on Top of Market Trends
The Carson Investment Research newsletter offers up-to-date market news, analysis and insights. Subscribe today!
"*" indicates required fields
WHY THE 10-YEAR YIELD MIGHT BE NEAR 4.25% AT THE END OF 2026
There is some folly to a point estimate of yields, since the potential range is so wide, but it’s still a useful exercise. There are really basic two forces in play in yields right now. There’s the tendency of longer-term yields to decline when the Fed cuts. I’ve looked at this in the past by tracking the relationship between 3-month yields and 10-year yields over major cutting cycles. The 10-year yield has always fallen with the 3-month yield, but at a slower rate, which is what leads to yield curve steepening. On average, the 10-year yield moves about half as much as three-month yield over an entire cutting cycle (measured by the three-month yield peak to trough, which might slightly anticipate cuts).
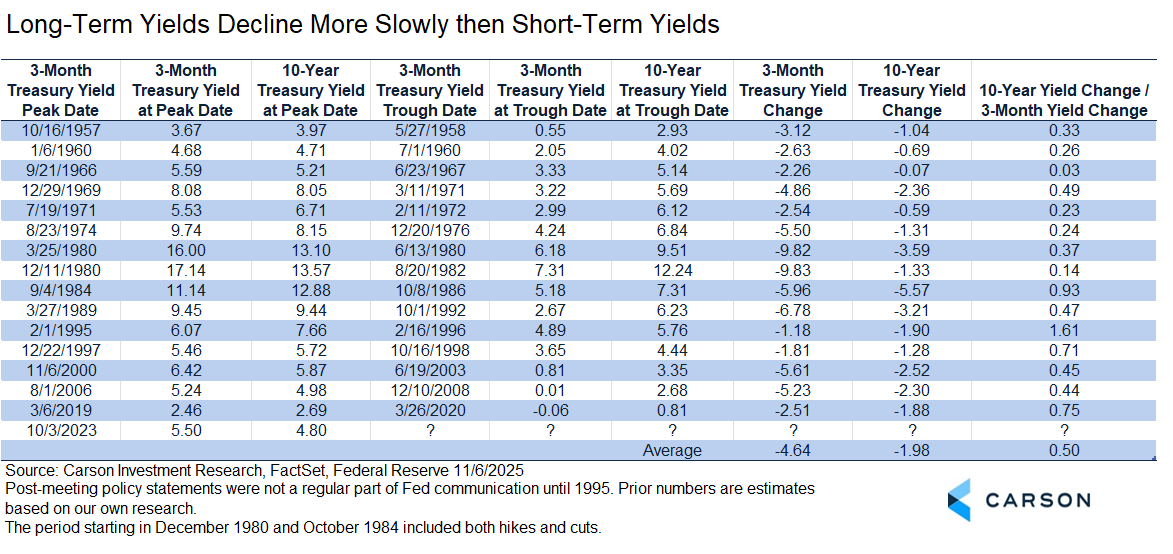
But we are already well into this cutting cycle. Even if the 10-year Treasury stayed constant at this point but the three-month Treasury follows a declining fed funds rate all the way to 3.0%, the ratio of declines for this cycle would be 0.28, higher than five of the fifteen previous cycles. In other words, based on history more declines in 10-year Treasury yields would be expected but the absence of a decline would be entirely feasible. If the relationship was at the historical average, a three-month Treasury yield at 3% would imply a 10-year yield at 3.55%.
But this isn’t a normal cutting cycle. Our expectation is that it will be a large mid-cycle adjustment (large in part because rates were raised so aggressively). With tailwinds from Fed cutting despite inflationary pressure, massive deficit-financed fiscal stimulus, and the continued AI infrastructure buildout, we think the most likely scenario is a junior version of stagflation—below-trend growth (but not recessionary) with modest continued job gains amid somewhat elevated inflation. (By the way, that wouldn’t be a bad environment for stocks.) If that’s true, the pull of rate cuts on the 10-year yield would be below average compared to history, which would allow more yield curve normalization.
As shown in the yield curve chart provided above, the median steepness of the 10-year Treasury yield versus the Fed funds rate going back to 1986 is 1.3%, although it varies quite a lot. We’re still near 0 now. Since a 3% fed funds rate is what the Fed currently views as neutral based on the dot plot, normalization may lead to something like typical historical yield curve steepness. If the fed funds rate fell to the 3.0–3.25% range, working from the middle of the range, that would imply a 10-year yield at 4.4%. I think that’s closer to what we’ll get, but with the pace of normalization too fast. Let’s call the expectation 4.25%.
What does that mean for bond investors? You don’t choose your allocation based on point estimates and bonds still have an important role to play in a diversified portfolio. But the analysis does suggest not abandoning shorter maturity holdings altogether and seeking out additional forms of diversification. Sorry Will and Christopher, we don’t need more cowbell this time. But cowbell’s role? Still essential.
For more content by Barry Gilbert, VP, Asset Allocation Strategist click here
8584886.1.-06NOV2025A