“However beautiful the strategy, you should occasionally look at the results.”- Winston Churchill
After more than a 30% total return on the S&P 500 the past 12 calendar months, a five month win streak, and a 27% rally in the first 100 trading days off the late October lows, we could finally be looking at a well deserved break. We want to stress, this isn’t something to fear, as it is all part of the process.
In fact, now could be a good time to remind investors that volatility is the toll we pay to invest. Meaning, we all want the gains, but sometimes you have some pain along the way. Or to quote Ben Franklin, “There are no gains without some pains.” Remember last year? Stocks gained more than 20%, yet there was a 10% correction into late October and many investors were quite worried at what was a fairly normal stock market development.
Stay on Top of Market Trends
The Carson Investment Research newsletter offers up-to-date market news, analysis and insights. Subscribe today!
"*" indicates required fields
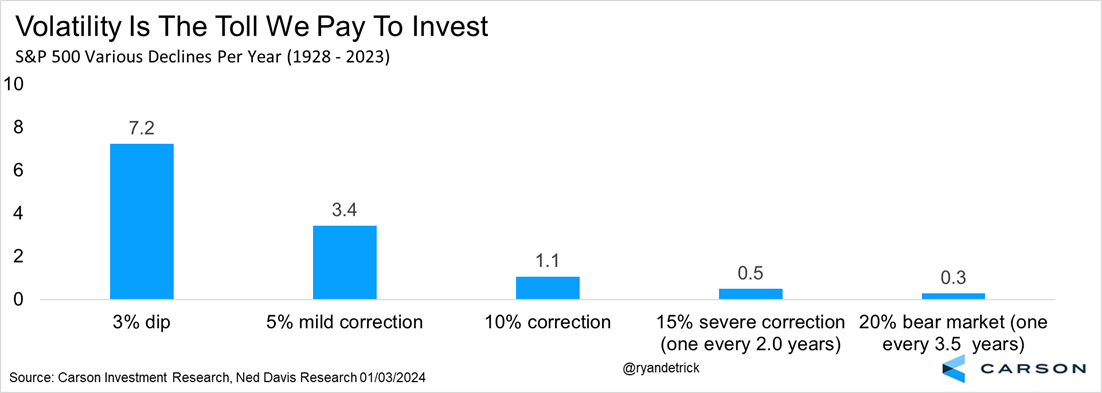
Here’s a great table that we’ve shared before on volatility in most years. Thanks to help from our friends at Ned Davis Research, the average year has more than seven 3% dips a year, more than three 5% mild corrections a year, and a 10% correction a year on average. After yesterday we’ve officially had our first 3% dip. That’s it, one 3% dip and your average year tends to see more than seven. That should put in perspective just how calm things have been lately.
Here’s one more way to look at things. The average year for the S&P 500 since 1980 saw a peak-to-trough correction of 14.2%, with the smallest ever at only 2.5% in 1995. More than three months into 2024 and stocks have only pulled back 3.7%, which would make it one of the smallest ever.
Even last year, when stocks gained more than 25% there was a 10% correction into late October. Once again, we think we are in a bull market and stocks will be higher from where they are now until the end of the year, but to think it’ll be an easy ride getting there isn’t very likely.
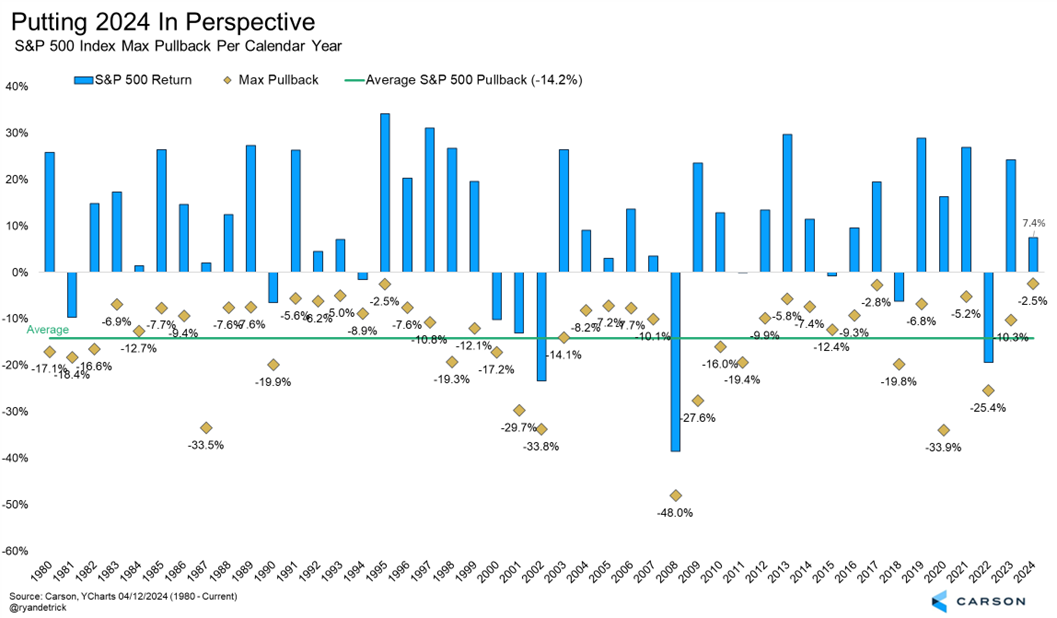
Looking at the past 44 years, 23 times stocks fell at least 10% peak-to-trough at some point during the year and 13 of those times (so more than half the time) stocks managed to finish green. The average gain those 13 years? 17.5% on average, suggesting that a correction can indeed happen quite often, but that doesn’t mean stocks have to have a bad year.
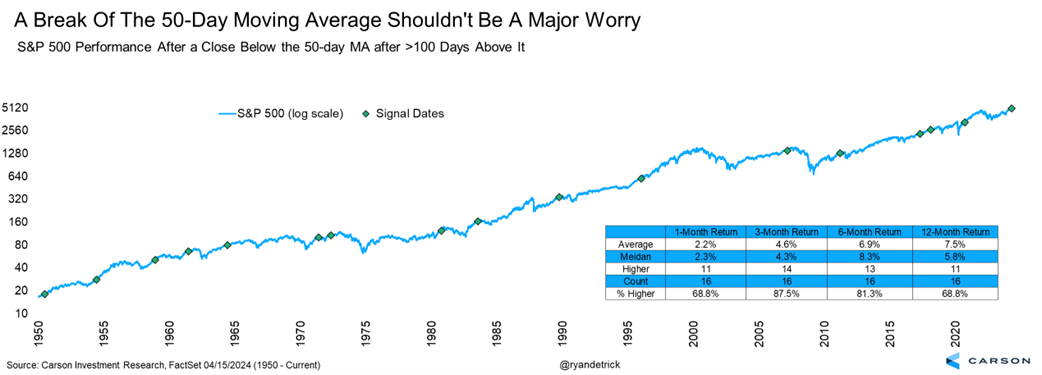
Lastly, the S&P 500 closed beneath it’s 50-day moving average for the first time in more than five months yesterday (or 110 trading days to be precise). This was the longest such streak since 2011!
I looked at other long streaks that lasted at least 100 days and what happened after an eventual close beneath this important trendline. Sure enough, three months later stocks were higher more than 87% of the time and six months later higher more than 81% of the time. Could there be a little more weakness, yes, that wouldn’t be out of the ordinary, but big picture we expect any weakness to be well contained and this bull market is still alive and well.
02201954-0424-A