We’ve gotten a flurry of economic data over the past week, covering the labor market (JOLTS, the Employment Cost Index, ISM employment sub-indexes), personal income, and the broader pulse of the economy via the ISM Manufacturing and Services surveys. Layered on top of that, the big tech hyperscalers all reported earnings.
While a lot, the picture that emerges is actually fairly coherent and aligns with what we’ve been writing for the past couple of months. The labor market is holding up better than the headlines suggest. Inflation is the real problem. And the AI capex wave continues to be the offsetting force that keeps the equity story alive.
The Labor Market Is Stabilizing
I’ve highlighted before that the labor market really cooled last summer, but the bleeding has stopped. The latest data confirms that, and if anything, things have ticked up a bit.
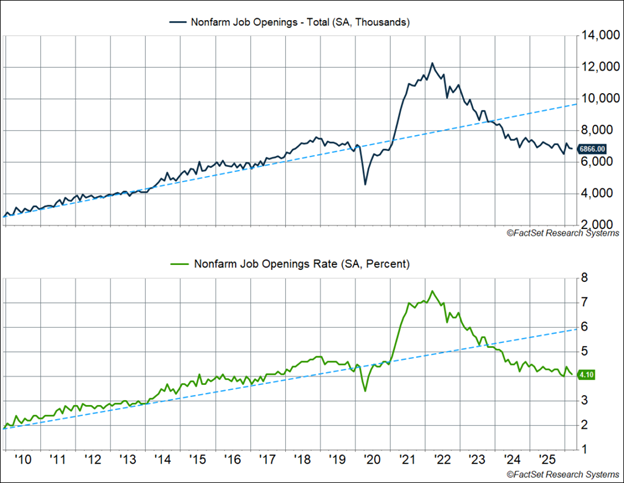
The March JOLTS report (which lags the payroll data by a couple of weeks) was mostly positive. Job openings were essentially flat at 6.87 million, with the vacancy rate easing to 4.1%. That’s well off the early-2022 peak of 7.4%, but it’s been roughly flat-lined for a year and a half now. The job openings-to-unemployed workers ratio has stabilized just under 1.0, after troughing at 0.87 in December. For perspective, that ratio sat at 0.5–0.7 throughout the mid-2000s, so being just under 1.0 isn’t, by itself, a red flag.
Hiring picked up meaningfully. Gross hires rose 655,000 to 5.55 million, and the hiring rate jumped from 3.1% to 3.5%, the highest reading in nearly two years. That’s still below the pre-pandemic pace of around 3.9%, but the direction matters. Hiring has been the worst part of the labor market data since 2023, so getting some good news here is welcome.
Quits held steady at 3.17 million (a 2.0% rate). This is an underrated indicator because workers quit at higher rates only when they’re confident they can find another job. The quit rate would plunge if the labor market were really cracking, and it’s not.
Layoffs picked up slightly to 1.87 million in March, but that’s still in line with pre-pandemic norms when you account for the larger labor force. And weekly initial jobless claims, which are far more timely, just dropped to 189,000, which is the lowest in over five decades.
The Q1 Employment Cost Index is the gold standard of wage growth measures because it’s composition-adjusted and rose at a 2.9% annualized pace. That’s the weakest reading since Q3 2020, but it’s right in line with the 2017–2019 average of 2.9%. ECI ex-incentive paid occupations are running at 3.4% year-over-year, still well above the 2.7% pre-pandemic pace.
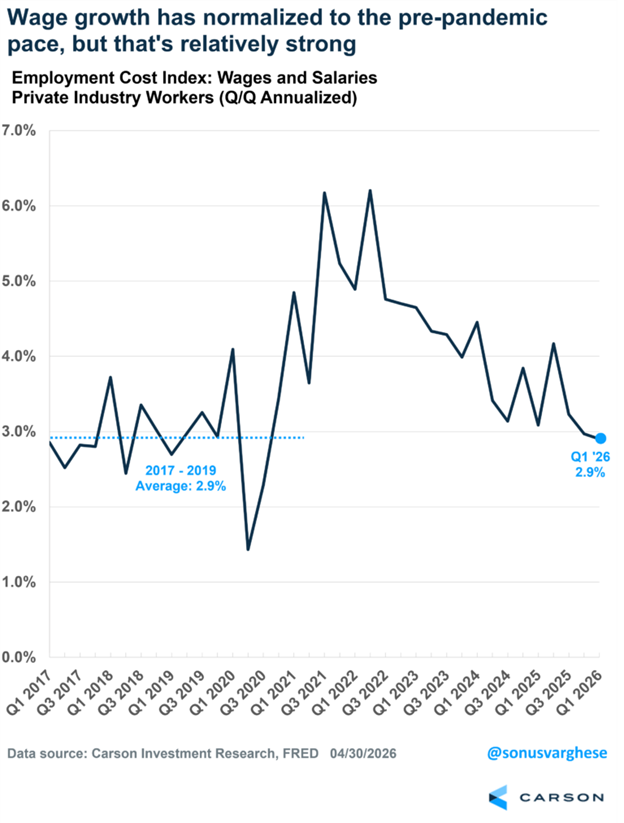
In other words, wage growth has normalized, but it hasn’t broken down. That tells you the labor market still has its footing.
Stay on Top of Market Trends
The Carson Investment Research newsletter offers up-to-date market news, analysis and insights. Subscribe today!
"*" indicates required fields
But Real Incomes Are Getting Squeezed
Personal income rose 0.6% month-over-month in March, and disposable income is up 4.0% over the last 12 months. Employee compensation grew 4.1% over the same period. Nominal numbers like that would be perfectly fine in a normal environment.
The problem is we’re not in a normal environment. Headline PCE rose 0.66% in March alone (an 8.3% annualized pace), driven by higher energy prices. Over the last three months, PCE has run at a 5.6% annualized clip. Inflation in 2023–2024 averaged 2.7%. So the gap between income growth and inflation, which powered consumption for the past three years, has now flipped.
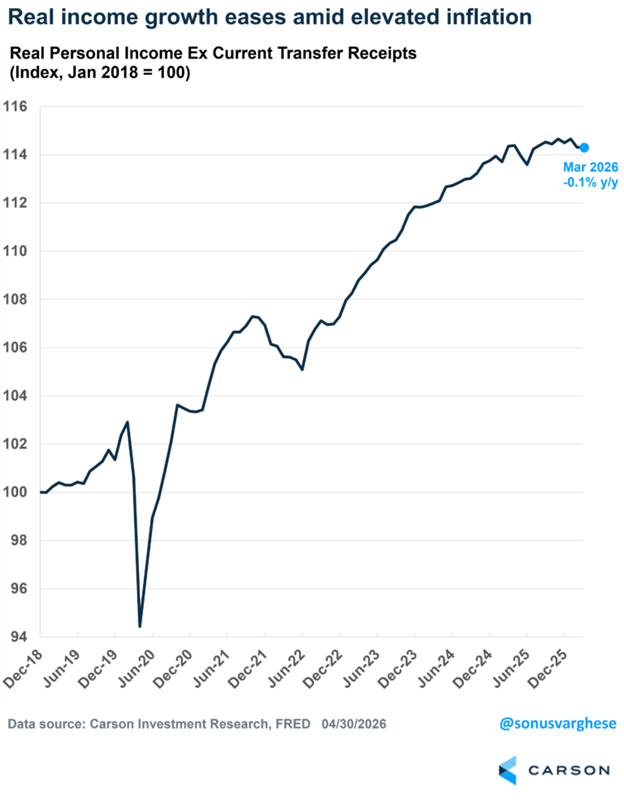
If you look at real personal income excluding government transfers, it actually fell 0.7% on an annualized basis over the last three months and is down 0.1% year-over-year. Compare that to a 3% annual pace in 2023–2024.
So how is consumption still growing? The savings rate. It’s fallen from a recent peak of 5.5% in April 2025 to 3.6% in March. A falling savings rate isn’t, by itself, alarming. We saw the same thing in 1998–1999, and households tend to spend more freely when stock prices are rising and they feel wealthy. But it does mean the cushion is getting thinner.
The bigger concern isn’t the savings rate. It’s that real wage growth has slowed to a crawl, and inflation is reaccelerating.
And Inflation Is the Real Problem
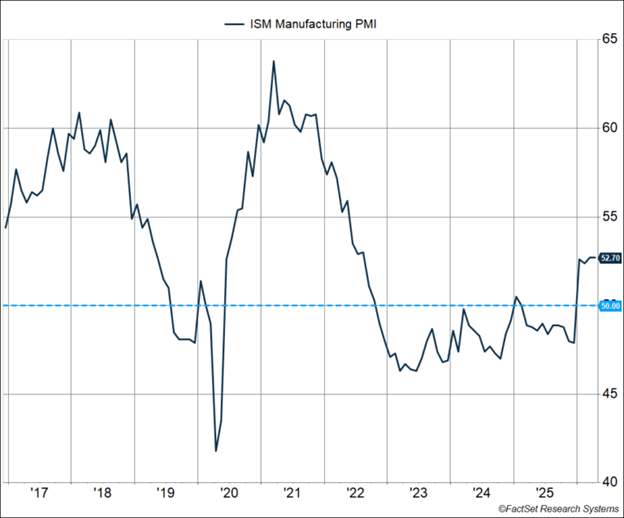
The April ISM Manufacturing PMI came in at 52.7, which is the fourth straight month of expansion, with new orders and production both holding up. That’s the good news. But the prices index jumped 6.3 points to 84.6, the highest reading since April 2022 and the 19th straight month of increase. 70.3% of respondents reported higher prices in April, up from 59.4% in March. All six of the largest manufacturing industries reported price increases.
The drivers are exactly what you’d expect: tariff pass-through, steel and aluminum price increases working through the value chain, and the petroleum-related cost pressure from the Middle East conflict. 47% of the comments in the ISM report mentioned the war, and 18% mentioned tariffs. The overall sentiment ratio in the comments was 1 positive to 2.2 negative.
Worth flagging the historical precedent: the ISM prices paid index peaked in June 2021. Headline consumer inflation didn’t peak until June 2022 — a full year later. So even if April turns out to be the peak in the prices index, the worst of the consumer inflation pass-through likely lies ahead.
The ISM Services PMI tells a similar story. Headline at 53.6, still in expansion territory, but the prices sub-index sat at 70.7, which marks the 16th straight month above 60, with all 18 industries reporting higher prices. That’s well above what we saw during the 2018–2019 trade war. And ECI for private wages is highly correlated with services inflation, which makes the 3.4% services inflation reading less surprising, but no less of a problem.
AI Capex Is the Offsetting Force
The one major positive in all this is the AI capex story, which we’ve written about extensively. The big five hyperscalars (Microsoft, Alphabet, Amazon, Meta, Oracle) reported earnings last week, and capex estimates kept rising. The 2026 estimate is now $725B, about 2.3% of GDP, roughly 4x the 2023 capex level and 7x the 2019 level. The 2027 estimate sits at $848B.
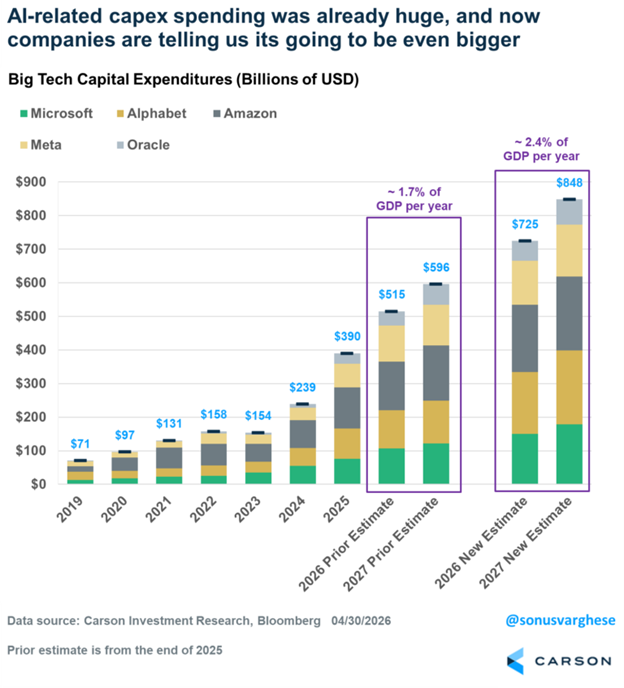
That spending is one company’s revenue and another company’s profits. Year-to-date, the SOXX (large-cap semis) is up 54.8%, XSD (diversified semis) is up 55.1%, and XTL (mid/small telecom) is up 49.6%, versus the S&P 500 at 6.0%. The capex wave is showing up exactly where you’d expect it to.
Overall
Put it all together, and you get an economy that looks something like this: labor is holding, growth is fine, corporate profits are getting a meaningful tailwind from AI capex, but inflation is reaccelerating, real incomes are flat, and the squeeze on the consumer is real.
Historically, this combination (solid nominal growth alongside elevated inflation) has been better for stocks than for bonds. Equity earnings can grow nominally, whereas fixed-rate bonds lack such a mechanism. That’s the environment we appear to be heading into. It’s not the soft-landing disinflation we had in 2023–2024. But it’s also not the recession some people were calling for at the start of the year.
For more content by Sonu Varghese, Chief Macro Strategist, click here.
8915683.1. – 6MAY26A
