
The Ryder Cup tees off this week. It’s sure to be a battle on the course. It’s also shown itself to be a battle for market returns. Since 2000, the winning team’s market has outperformed the loser’s market by an average of 1.6% into the end of the year! There may be both pride and market performance on the line this weekend.
US vs Europe. It’s an age-old battle, both on the course and in markets. Europe has cleaned up the Ryder Cup this century (winning 8 of 11 Cups). However, the US stock market has reigned king. The S&P 500 index has returned roughly 352% vs the Euro STOXX 50 index returning only 11.3% (FactSet data, from 12/31/1999 to 9/18/2025).
But can the Ryder Cup act as more than just entertainment and inform market returns?
History shows that the outcome of the Ryder Cup has been indicative of relative returns into the end of the year. The victor’s market has outperformed on average, as shown in the table below.
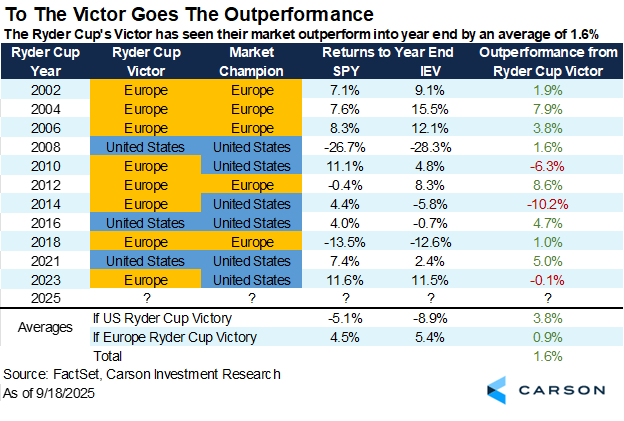
A US victory seems very bullish for relative US performance. When the US won the Cup since 2000, SPY (the SPDR S&P 500 ETF) outperformed IEV (the iShares Europe ETF) 3 of 3 times and by an average of 3.8% into year end! Talk about the market cheering an underdog victory.
Stay on Top of Market Trends
The Carson Investment Research newsletter offers up-to-date market news, analysis and insights. Subscribe today!
"*" indicates required fields
When Europe won the Cup since 2000, IEV outperformed SPY into the end of the year 5 of 8 times, and by an average of 0.9%. It is not quite as bullish for Europe when they win the Cup, but still is nothing to scoff at.
Since 2000, the winner of the Ryder Cup has seen their stock market outperform the loser’s market into the end of the year following 8 of 11 Ryder Cups and by an average of 1.6%. Maybe there is a close connection between markets and golf after all.
What is eye-opening to me is these periods of outperformance following a Cup victory on either side stand firm when adjusting for performance over the entire timeframe since the end of 1999. Said differently, a Cup victory has led to better than average relative performance for either market.
The Euro STOXX 50 has underperformed the S&P 500 by about 5.6% per year this century (return CAGRs of about 0.4% and 6.0%, respectively), or about 1.4% per quarter (FactSet data, from 12/31/1999 to 9/18/2025). So 0.9% outperformance in IEV compared to SPY into year-end following a European victory delivers 2.3% better relative performance than the average quarter! That is quite an upside surprise following a European victory.
And it is similar following a US victory. Average outperformance for SPY vs IEV of 3.8% in the quarter following a Cup victory when adjusted for 1.4% average quarterly outperformance since 1999 still yields 2.4% better relative performance than expected. It seems a victory catalyzes a celebration from investors on either side of the Atlantic!
Lastly, there’s one important clue investors may want to take into account: The US’ three Cup Victories this century have come on US soil. This week’s event at Bethpage Black, just outside of New York City, may bode well for both golf pride and Wall Street.
Fore!
8426457.1.-25SEPT2025