April’s CPI inflation data came in at expectations. Headline inflation rose 0.4% and is now up 4.9% over the past year. That is well below the peak rate of 9.1% last June. The big picture is inflation has already pulled back in a big way. That is primarily because of lower energy prices, and a welcome decrease in food prices. Used car prices rose in April but have been on a downtrend since last summer, contributing to the pull back in inflation. New car price inflation appears to be easing now, too, with prices falling for the first time in two years.
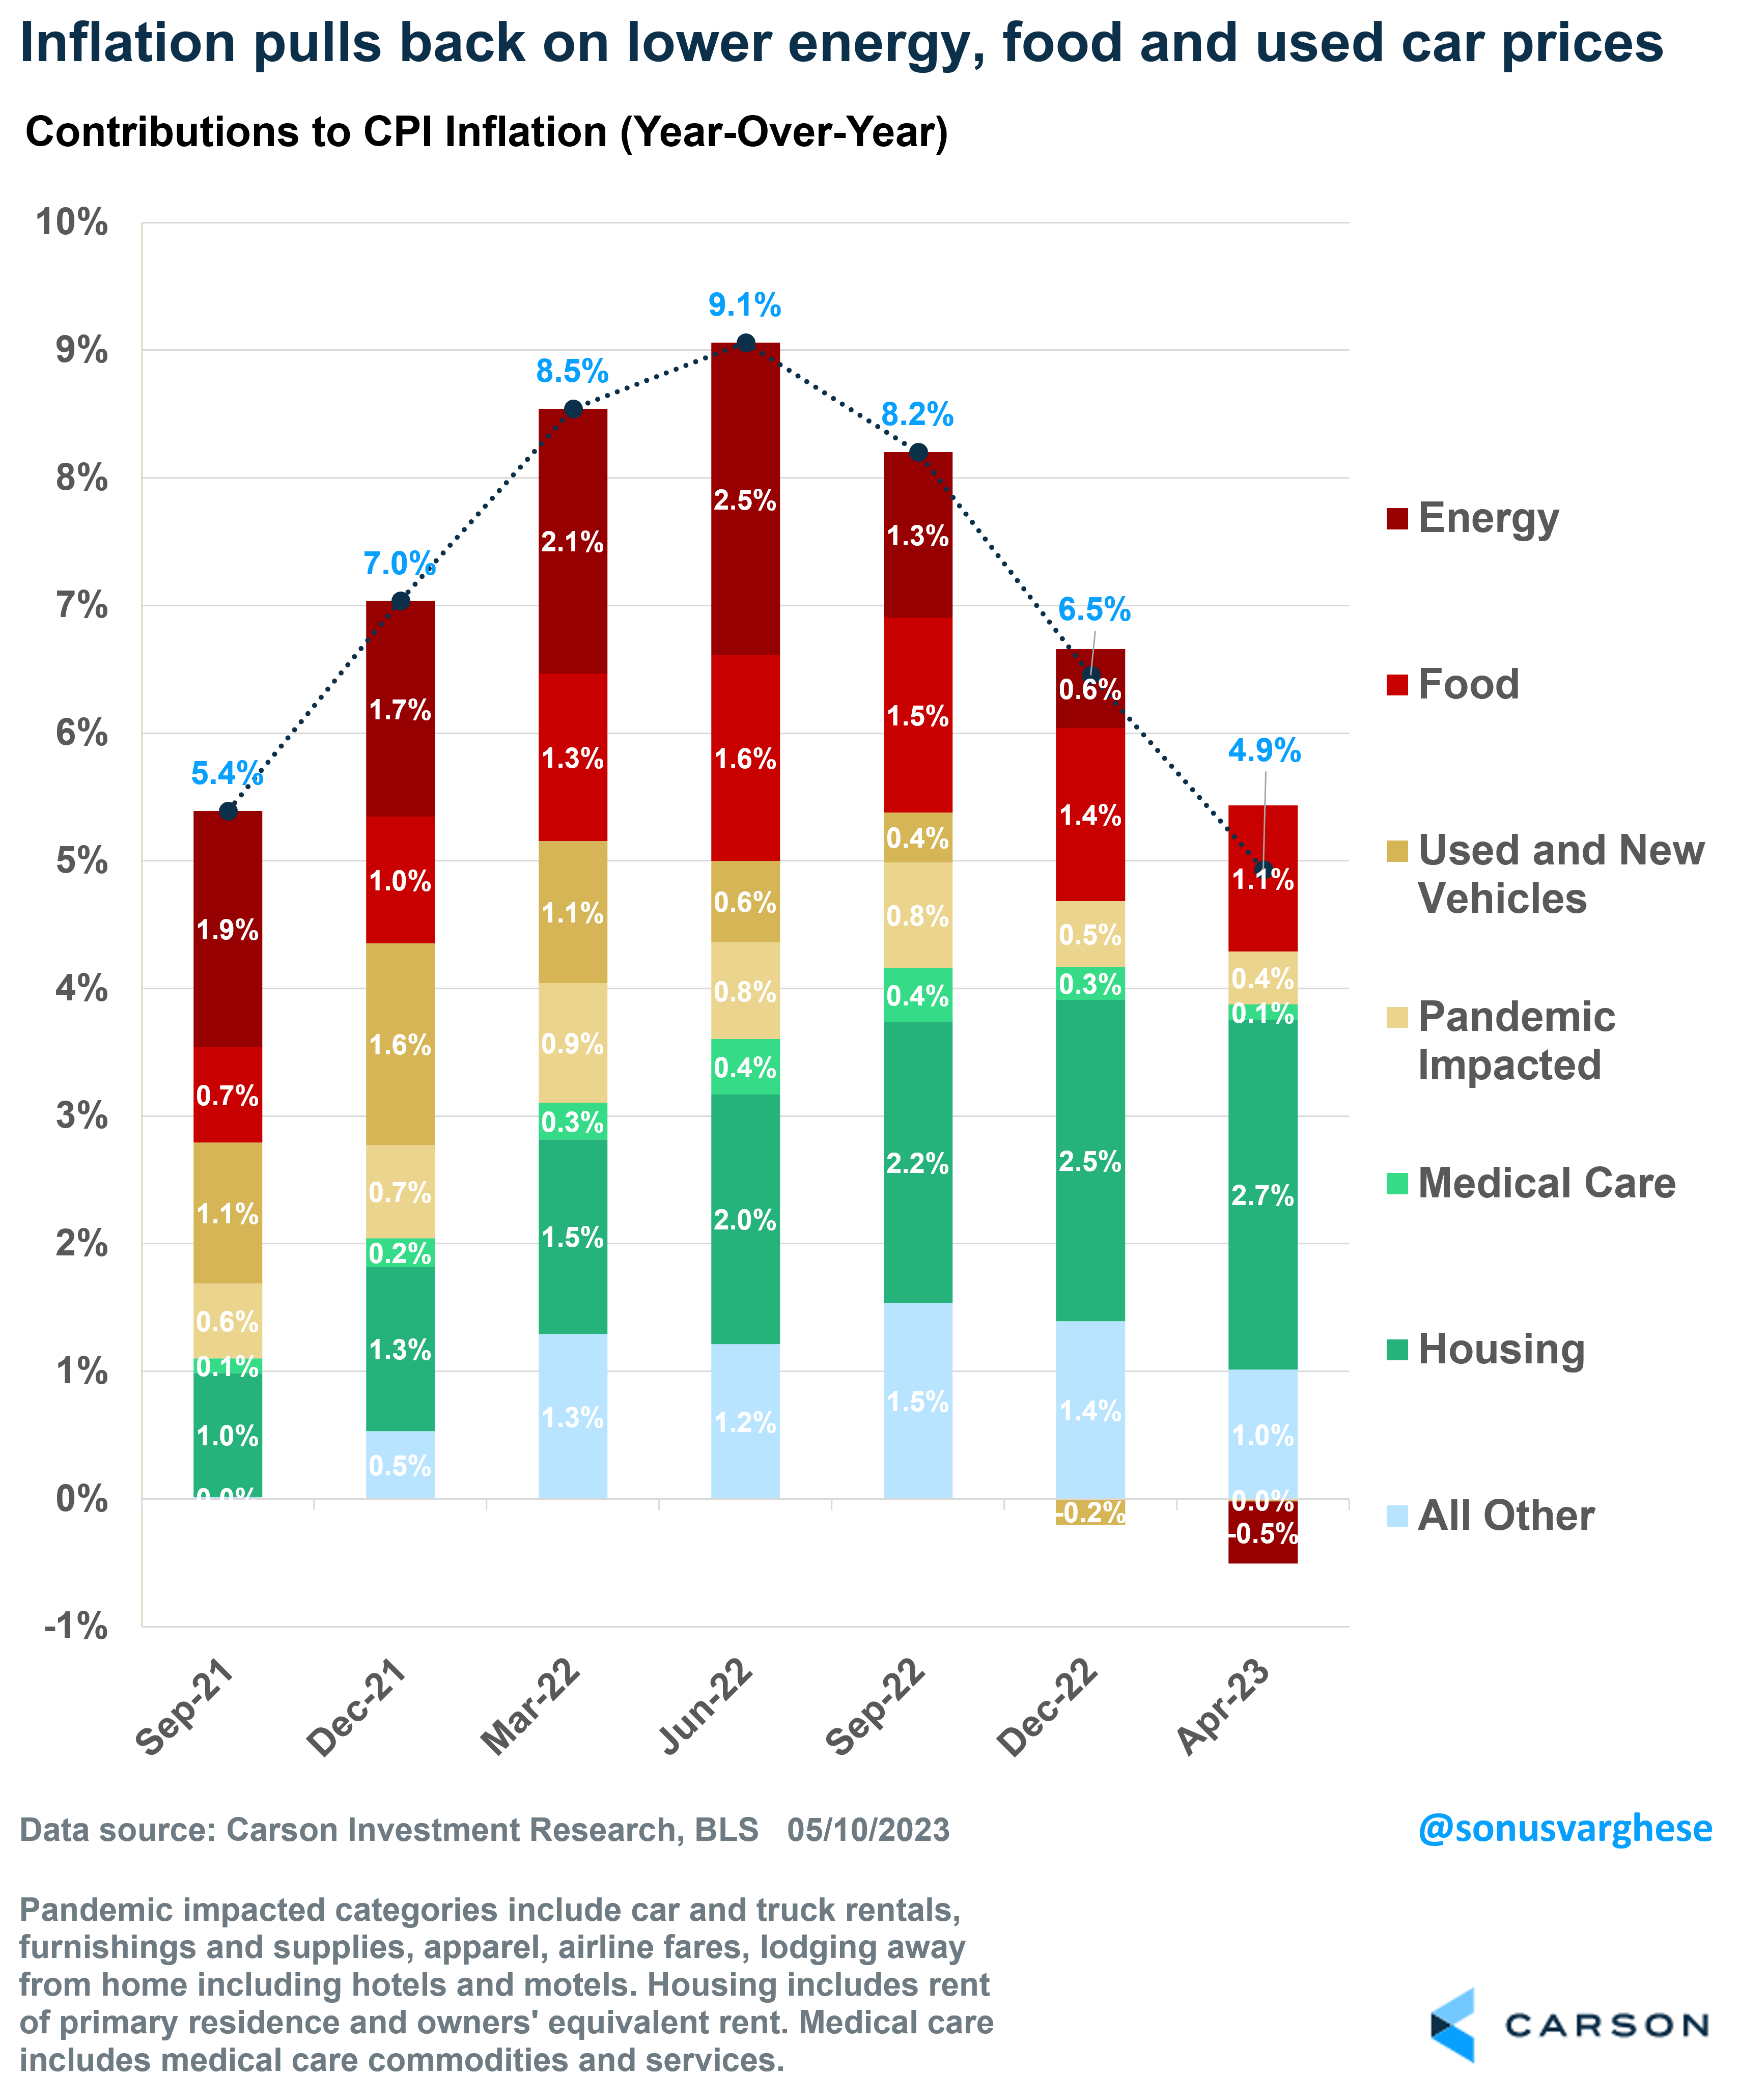
Excluding food and energy, “core inflation” is now running higher than headline inflation, at 5.5% over the past year. That’s not far below last summer’s peak of 6.6%, and so the pullback in headline inflation hasn’t quite translated to the core measure. Core inflation is also what the Federal Reserve (Fed) typically focuses on, and from that perspective, inflation remains well above the Fed’s target 2% rate.
Housing inflation is turning around
The main reason behind elevated core CPI inflation is housing inflation, which makes up 41% of the basket. Housing inflation, which is basically derived from rents (as opposed to home prices), has been running hot, around 8-9% over the past year.
Stay on Top of Market Trends
The Carson Investment Research newsletter offers up-to-date market news, analysis and insights. Subscribe today!
"*" indicates required fields
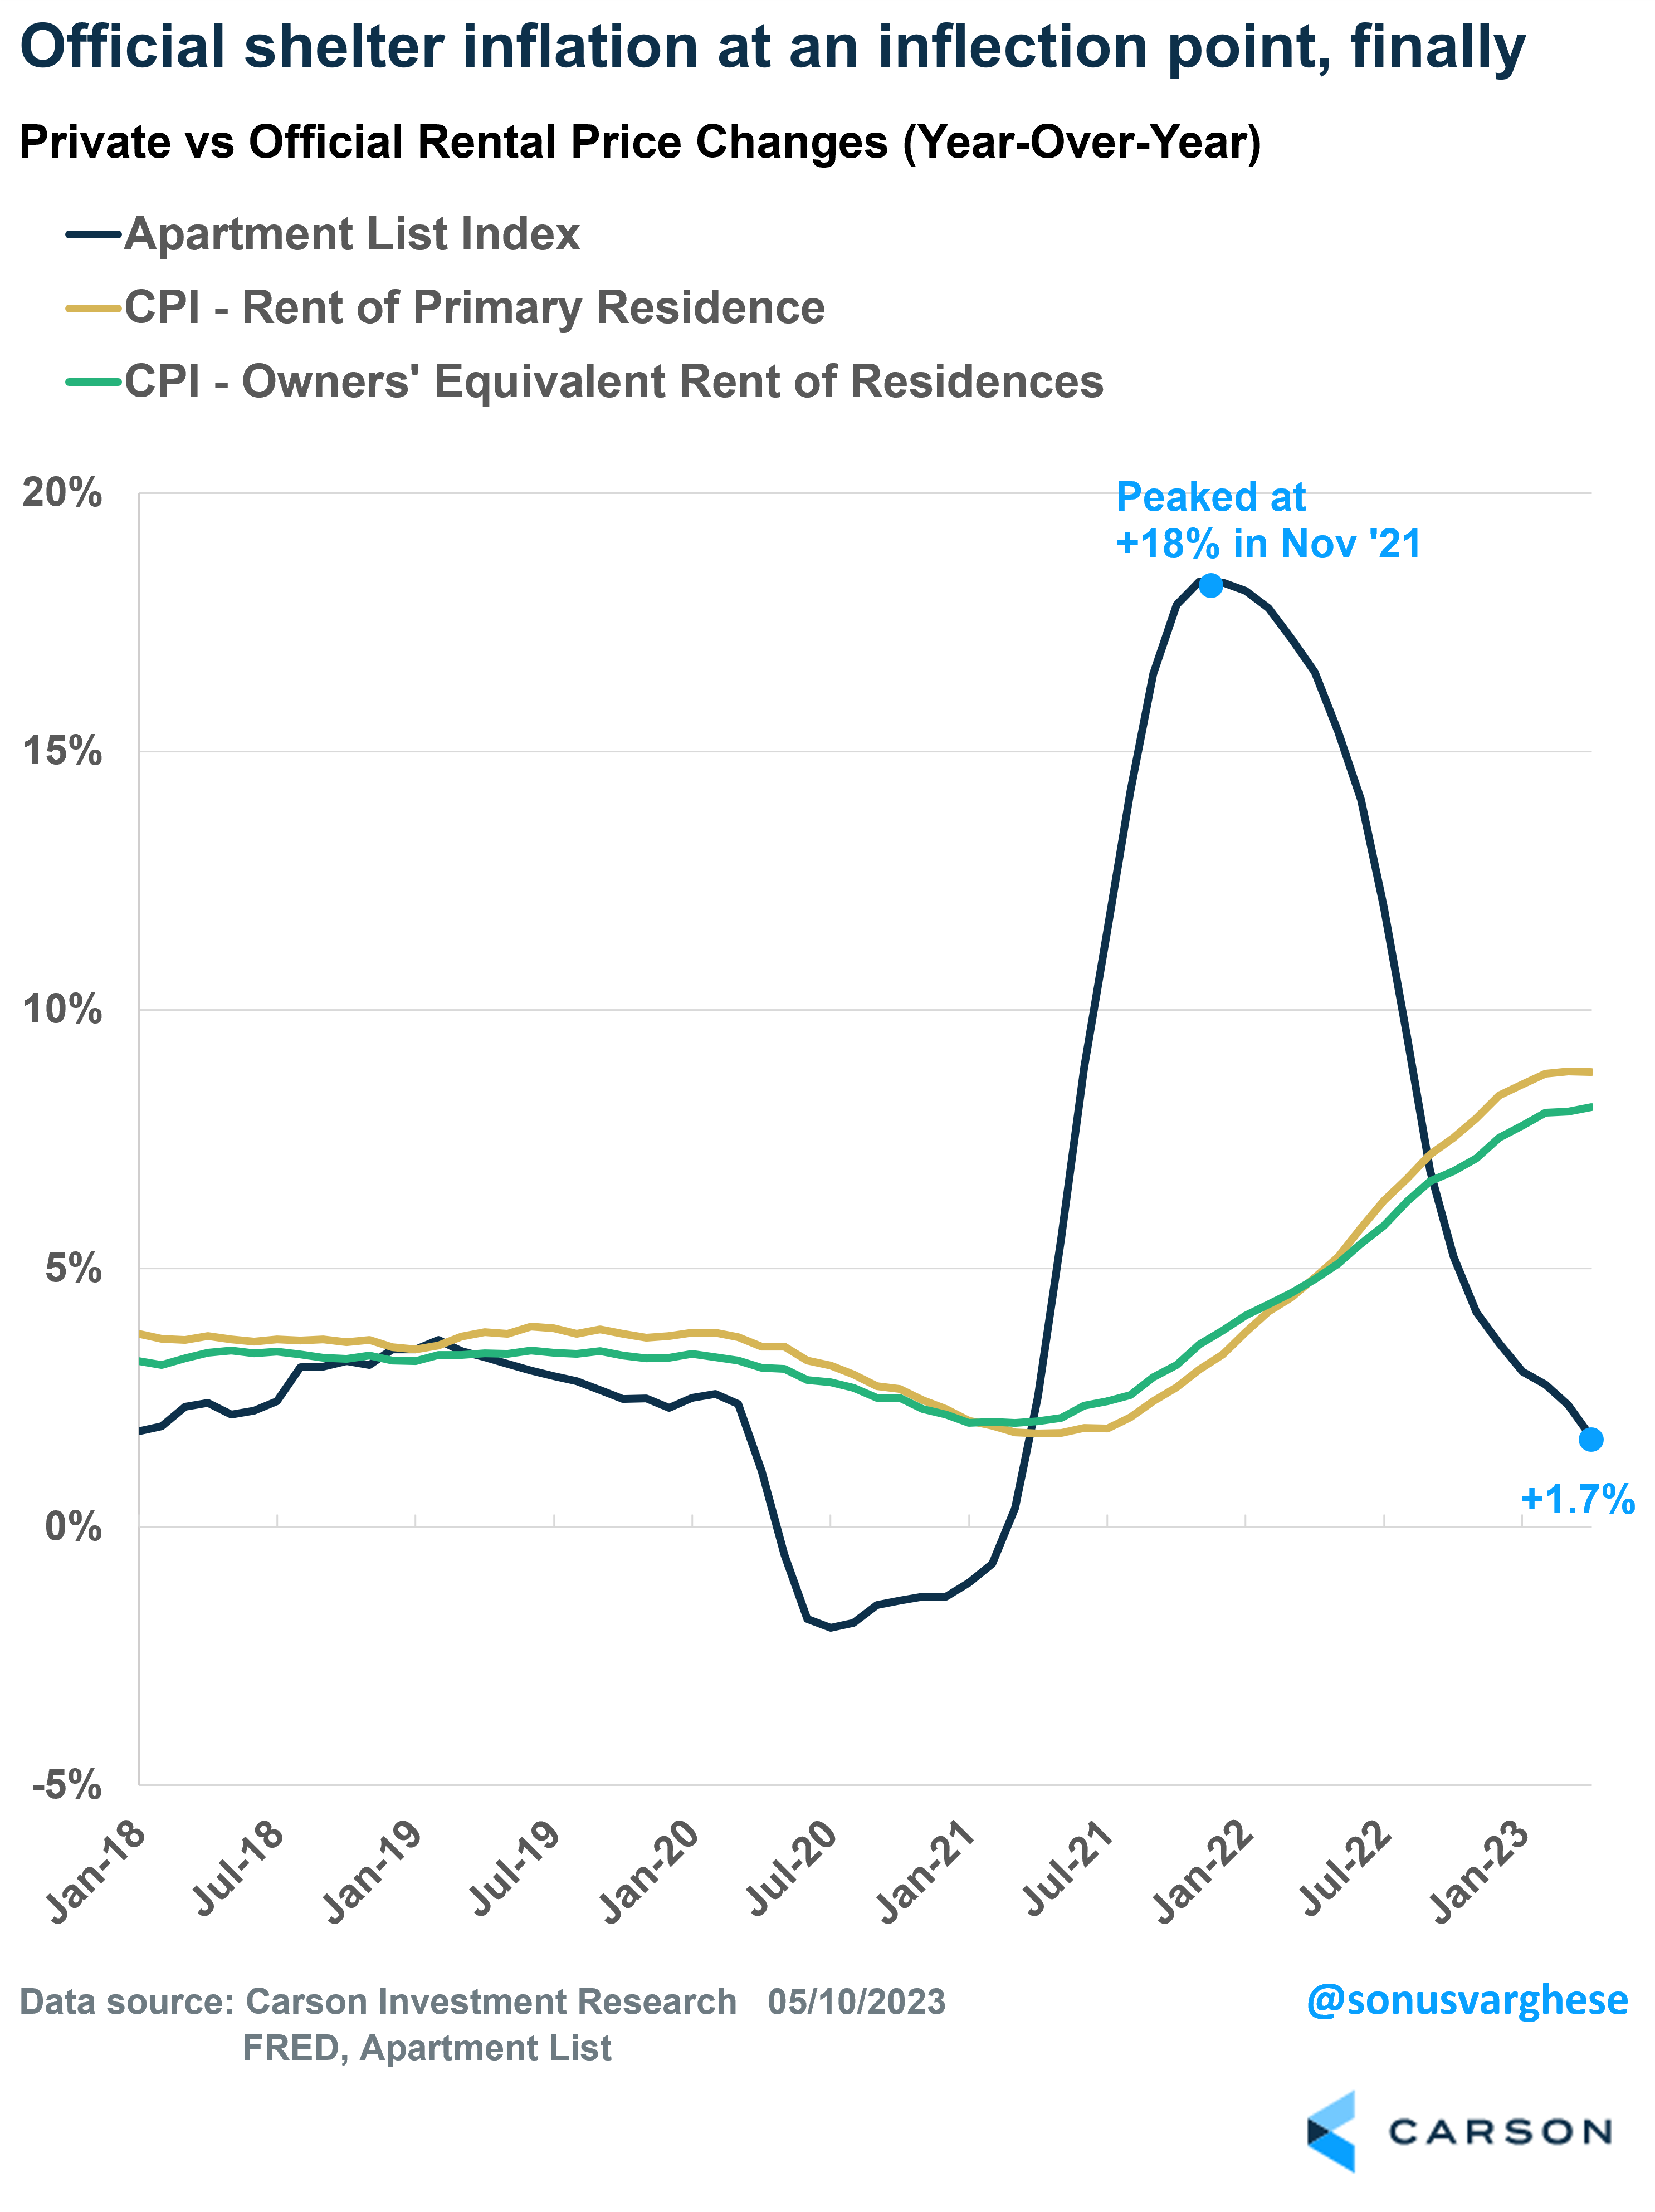
This is in sharp contrast to market-based rental price measures, which have shown a sharp deceleration in rents over the past year. Apartment List’s national rental index peaked at 18% about 18 months ago, but that has decelerated to a 1.7% pace as of April. The official shelter index clearly has a significant lag to this market-based index. But here’s the good news: The official data looks to be at a turning point.
On a month-over-month basis, rents had been increasing at an average rate of more than 0.7% between June 2022 and February 2023. But that has decelerated to an average rate of about 0.5% over the last two months, which is a very positive sign. However, as the chart below shows, that’s still higher than 2018-2019 when monthly increases averaged about 0.3%.
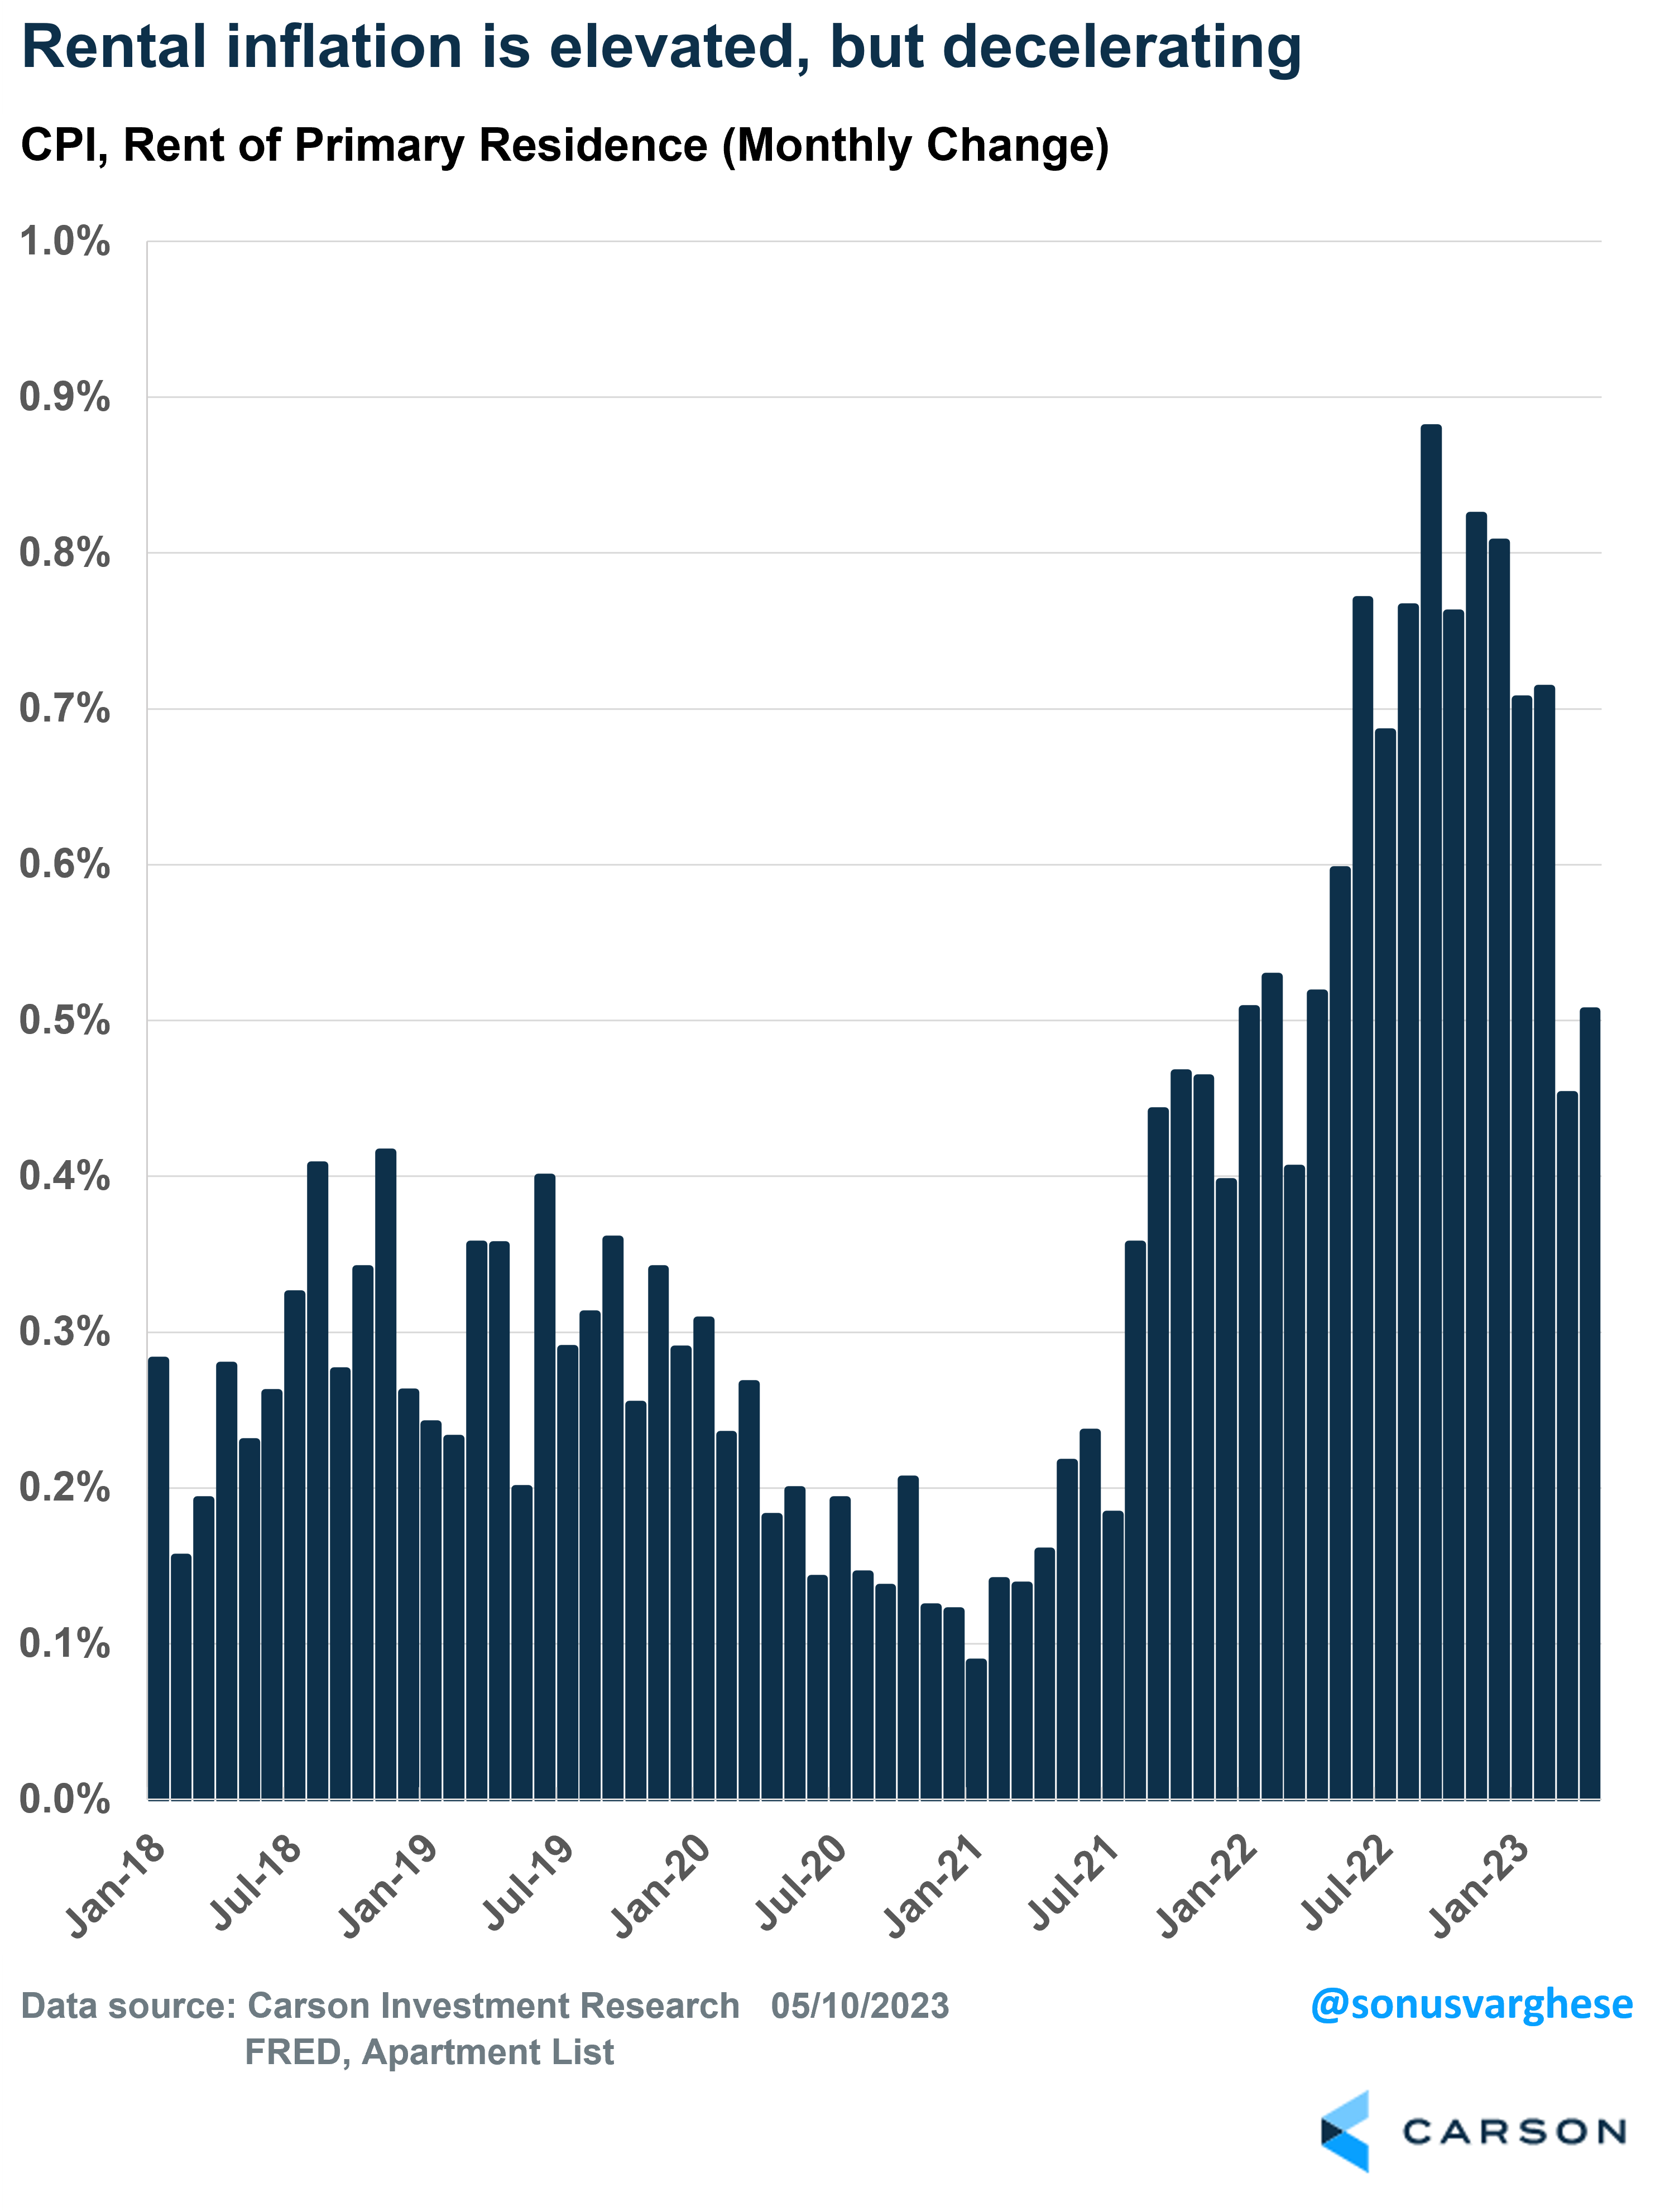
In short, the official housing inflation data is decelerating, but there’s still some ways to go. We’re likely to get closer to the pre-pandemic pace as we move into the second half of 2023, and that will also pull core inflation lower.
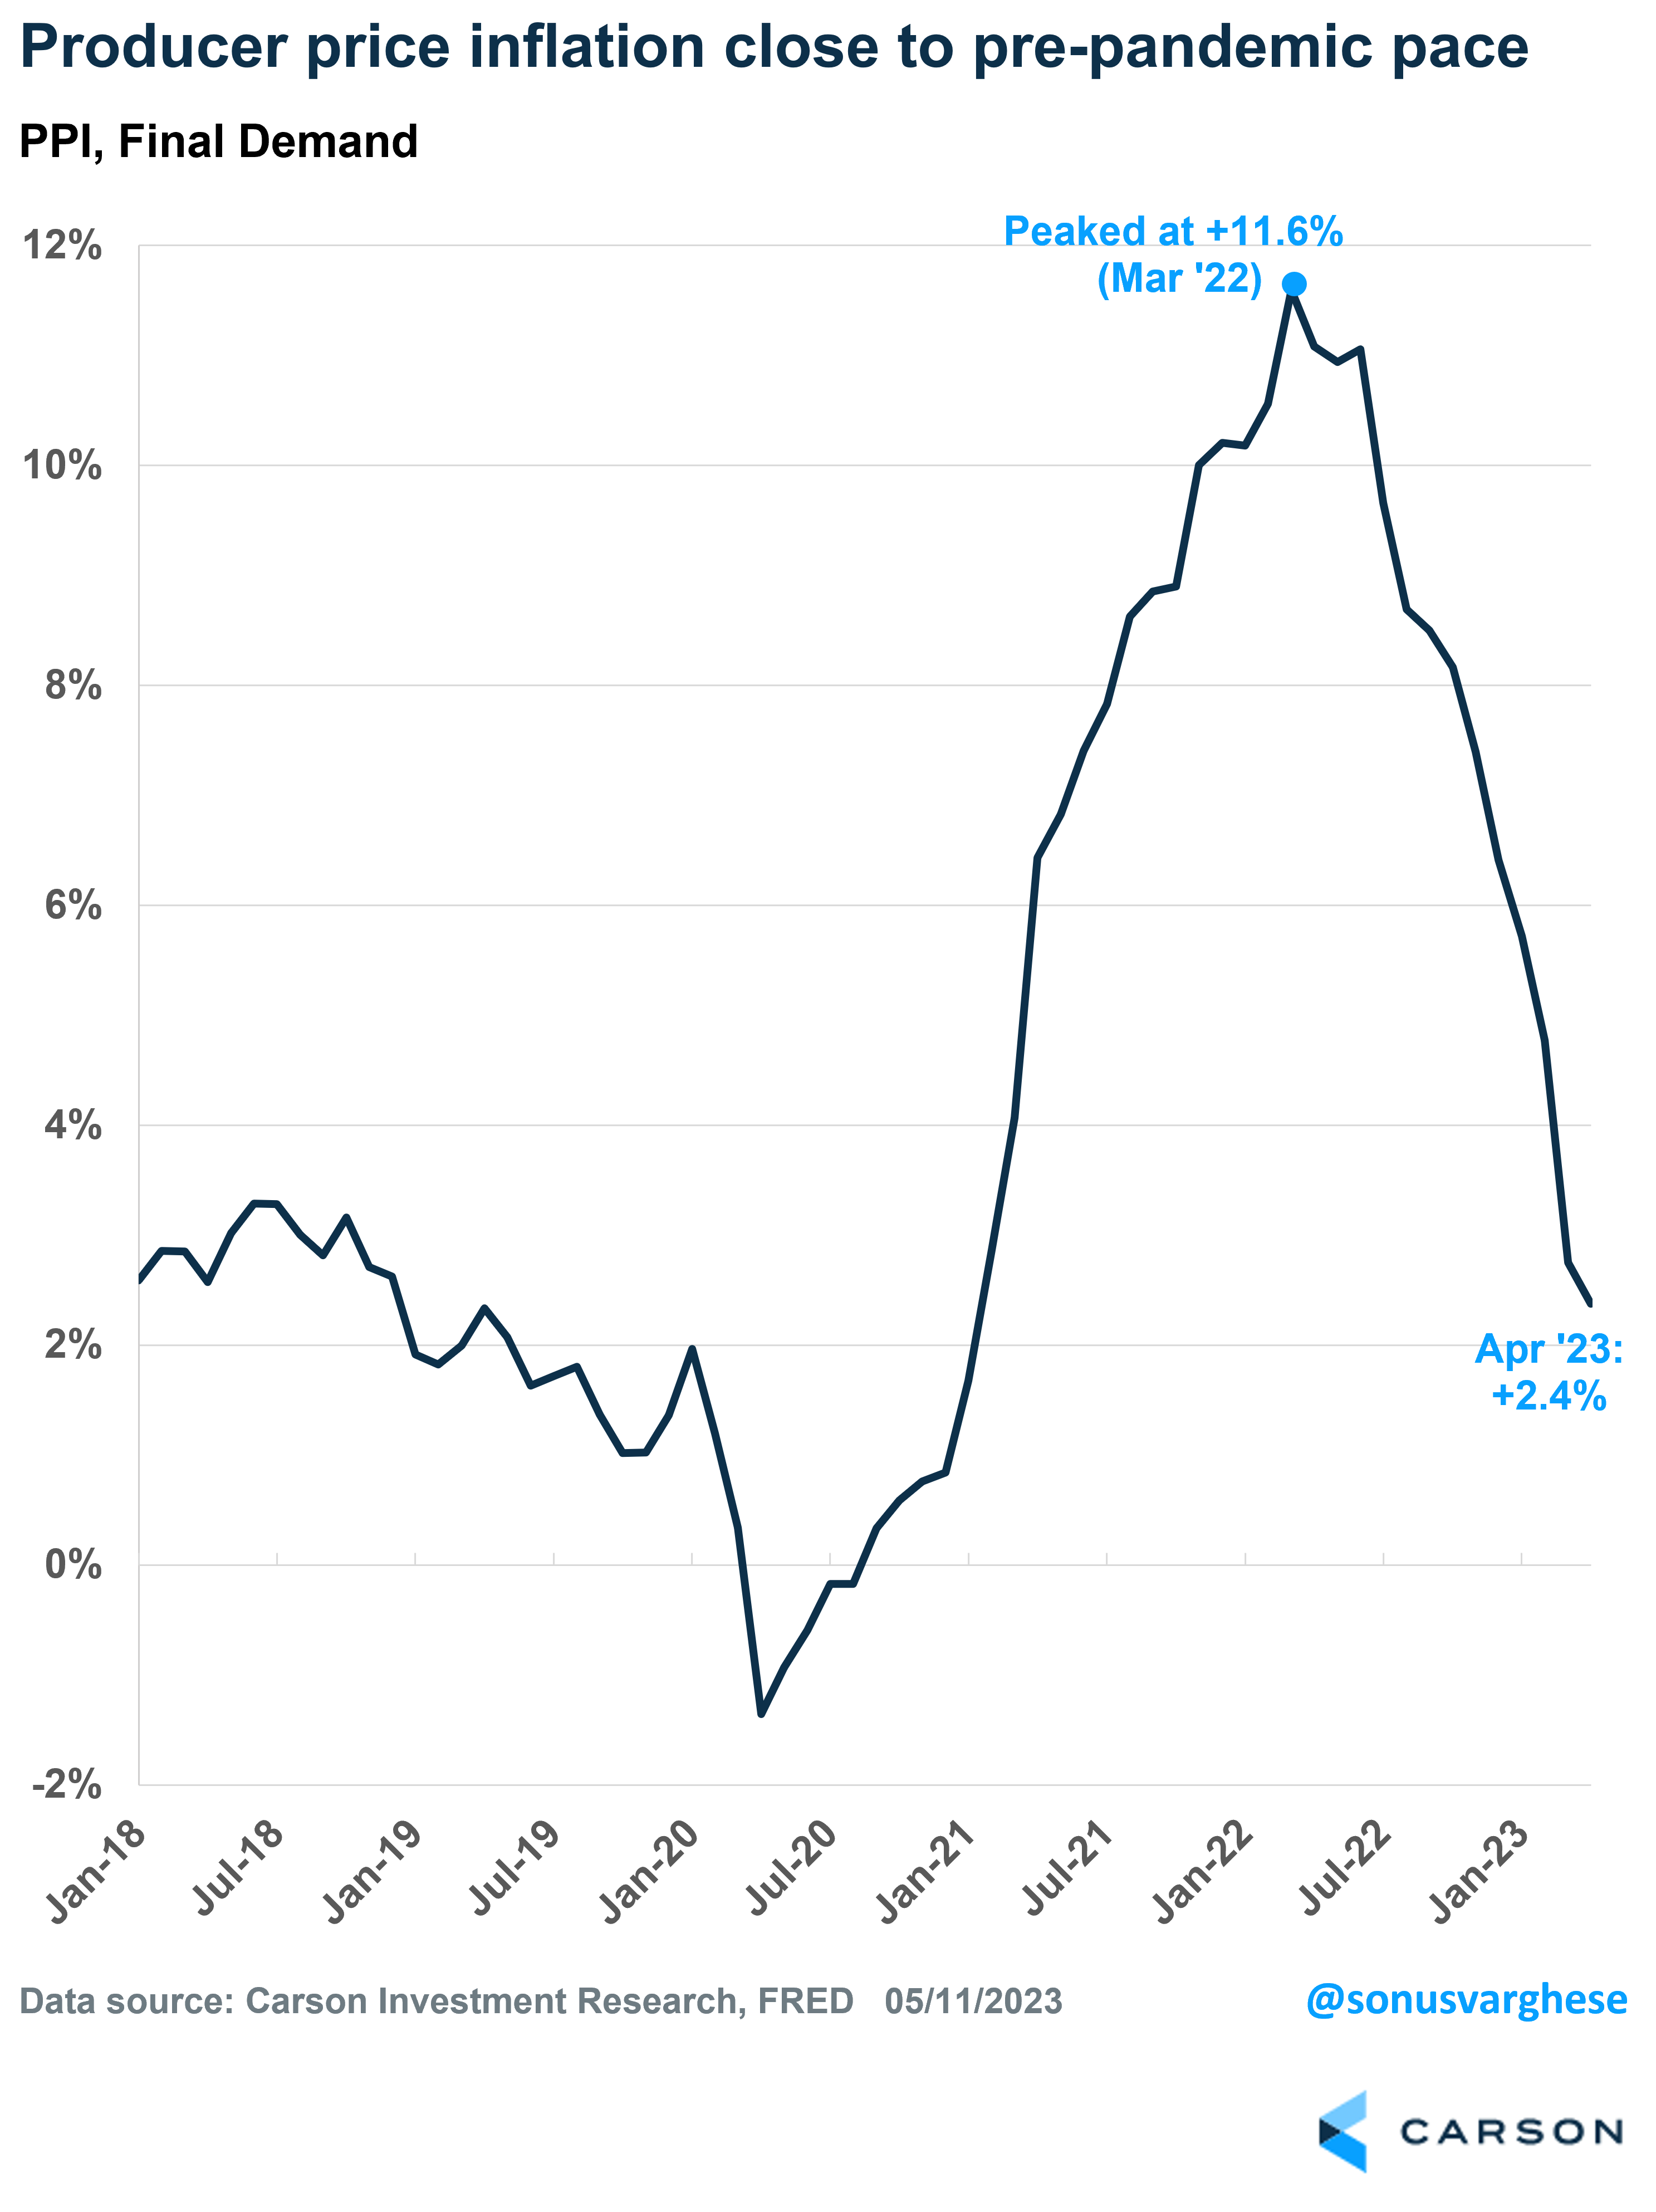
Producer Prices – There and Back Again
The producer price index (PPI) measures the prices that domestic goods and service producers receive. The index surged at a 12% annual pace back in March 2022, indicating wholesalers faced significant cost increases for the goods they bought from domestic producers. Which as we know, was passed down to consumers.
The good news is that we’ve come a long way over the last year. PPI rose just 2.4% over the 12 months through April, a pace that is similar to what we saw before the pandemic.
PPI is kind of a forward-looking indicator for consumer prices and perhaps more importantly, some its underlying components directly feed into the Fed’s preferred index for inflation, the personal consumption expenditure index. Based on the latest CPI and PPI data, forecasters at Goldman Sachs now expect PCE inflation to increase 0.3% in April, or 4.2% from a year earlier. Excluding food and energy, “core PCE” is expected to rise just 0.3% in April, corresponding to a year-over-year rate of 4.6%.
This would be a very positive development, as it would alleviate the Fed’s concerns about inflation picking up speed and bring an end to the aggressive cycle of interest rate increases that began just 14 months ago, with rates rising by 5 percentage points.
