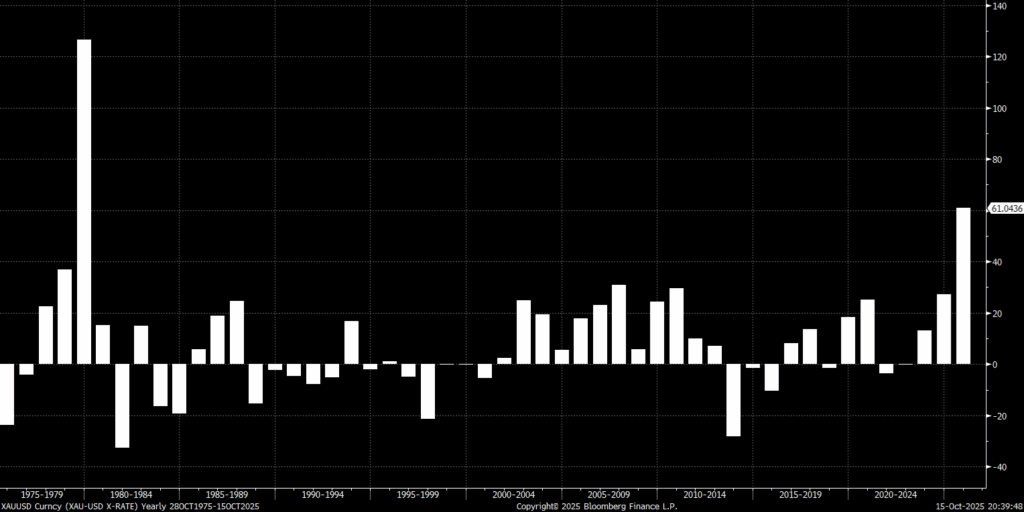
Gold has now rallied a whopping 61% year-to-date (as of October 15th, 2025) and has rallied 25.7% since August 25th.
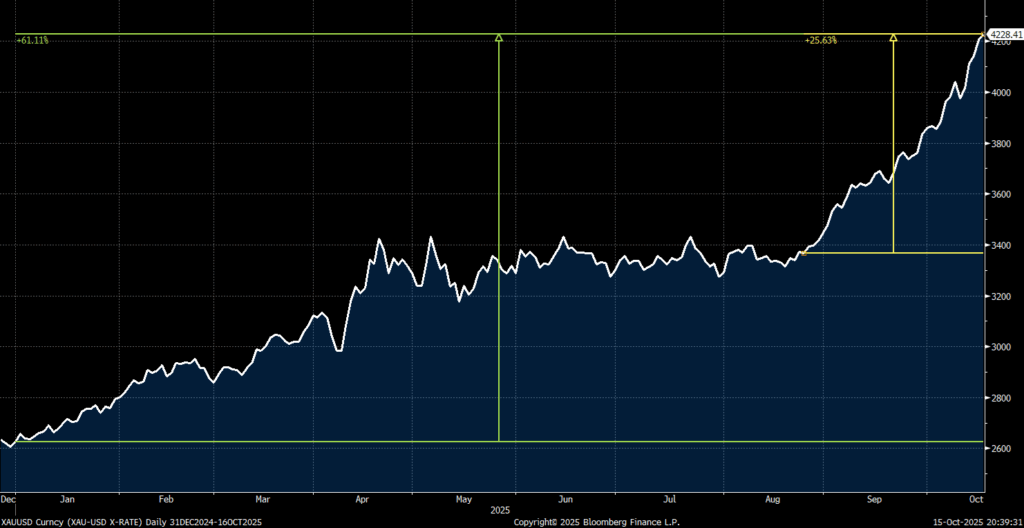
That makes 2025 the metal’s second-best year since 1975—surpassed only by 1979’s 127% surge—and it follows strong gains in 2023 (+13%) and 2024 (+27%). We first added gold to our portfolios in March 2023 as a hedge that didn’t behave like long-term Treasuries. With inflation stubborn and the Fed still tightening, it provided potential upside from falling real rates if growth rolled over. Gold was flat through most of 2023 before rallying sharply in Q4 2023, consolidating mid-2025, and then going parabolic in late summer.
Momentum Meets Central Bank Buying?
The simplest explanation is momentum—strength feeding on itself. Another major factor is central-bank demand. The ECB noted this June that official purchases accounted for over 20% of global gold demand in 2024, double the 2010s average. Much of it came after Russia’s 2022 invasion of Ukraine, when the U.S. froze Russian reserves. Many emerging-market central banks diversified into gold to reduce exposure to the dollar-centric system.
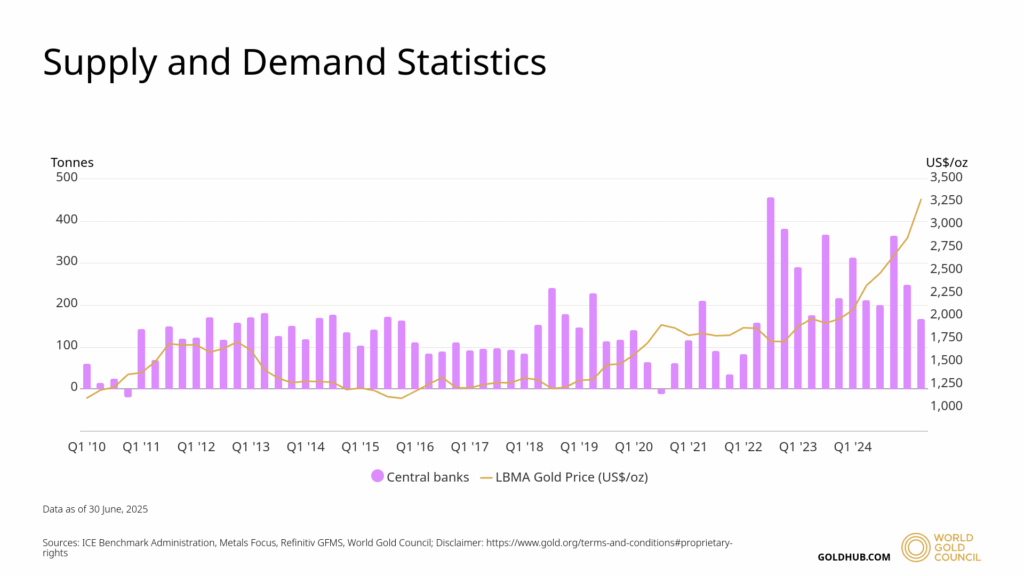
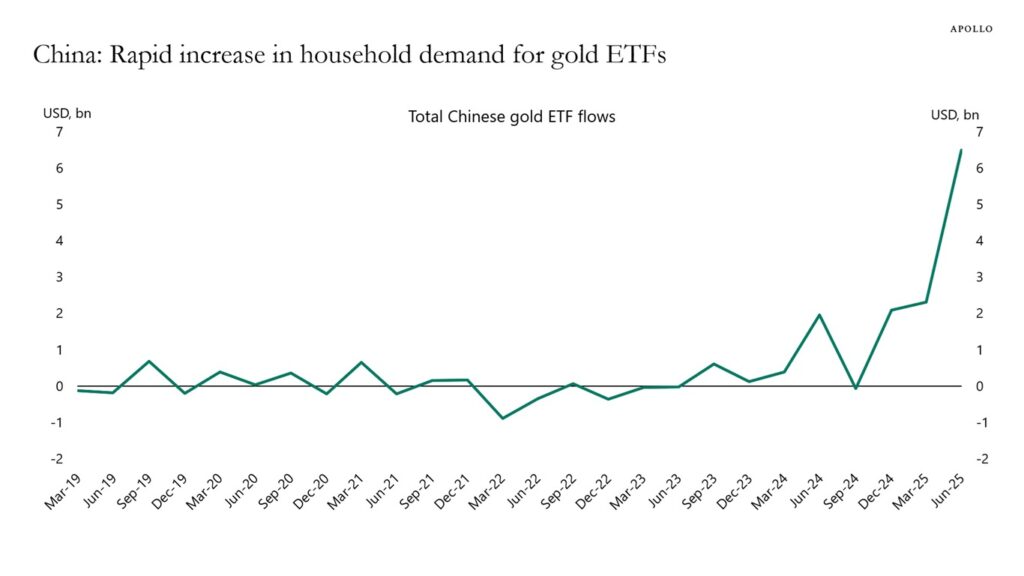
Still, central-bank buying alone doesn’t explain this year’s surge. Buying began in 2022, when gold fell, and slowed in early 2025 even as prices climbed. A better clue lies in Asian household demand, especially in China. With property markets collapsing, Chinese investors have shifted savings into physical gold and ETFs, while India’s seasonal wedding demand remains steady (though India’s affinity for gold is not uncommon knowledge).
The “Debasement” Trade
Our friend, Warren Pies, Founder and Strategist at 3Fourteen Research, describes gold benefiting from the “debasement” trade. This term has caught on around Wall Street recently, though as far I remember, Warren was the first to coin it. His thesis is essentially that investors are now more worried about protecting purchasing power rather than debt deflation and principle protection/downside protection. We believe this is an environment that should favor alternative “real assets” like gold, real estate, bitcoin, and even stocks. It’s important to note here that stocks are a real asset – I’ve written quite extensively about how long-term equity investments protect against inflation (though they may not work as an “inflation hedge” over short time periods – like 2022, for example).
Warren is getting some push back, which generally runs in the form of
- Real estate prices aren’t rising, especially home prices
- Bonds have done well this year, with short and long-term yields falling – not what you’d expect under “debasement”
The critique that “real assets aren’t rising” overlooks that U.S. home prices remain 26% higher than in mid-2021 and over 50% above pre-COVID levels.

Bonds, meanwhile, have rallied as yields fell this year:
- 1-year = 3.61% (-53 bps, 1 bps = 0.01%)
- 2-year = 3.49% (-75 bps)
- 5-year = 3.61% (-78 bps)
- 10-year = 4.02% (-55 bps)
Source: FactSet, 10.16.25
Lower yields reflect soft labor markets and recession fears, not necessarily confidence in fiat stability. Our House View portfolios remain overweight equities but use gold and bonds as complementary diversifiers—gold for crises, bonds for recession risk. Though we use capital efficiency to get exposure to the diversifiers, including gold, managed futures, and bonds, and so we’re not exactly “sacrificing” any particular diversifier (we have all of them) – I wrote about this couple of months ago, just before gold started its most recent leg higher.
Stay on Top of Market Trends
The Carson Investment Research newsletter offers up-to-date market news, analysis and insights. Subscribe today!
"*" indicates required fields
Falling Policy Rate Expectations Are Driving Yields Lower
To a first approximation, treasury rates are what the market expects short-term policy rates to be in the future. Markets have dramatically repriced the Fed’s path. Expected policy rates for 2025-26 have dropped more than 100 bps since January, with investors now predicting:
- 2 more cuts in 2025 (to 3.6%)
- 3 cuts in 2026 (taking policy rates below 3.0%)
- Gradual hikes only from 2028
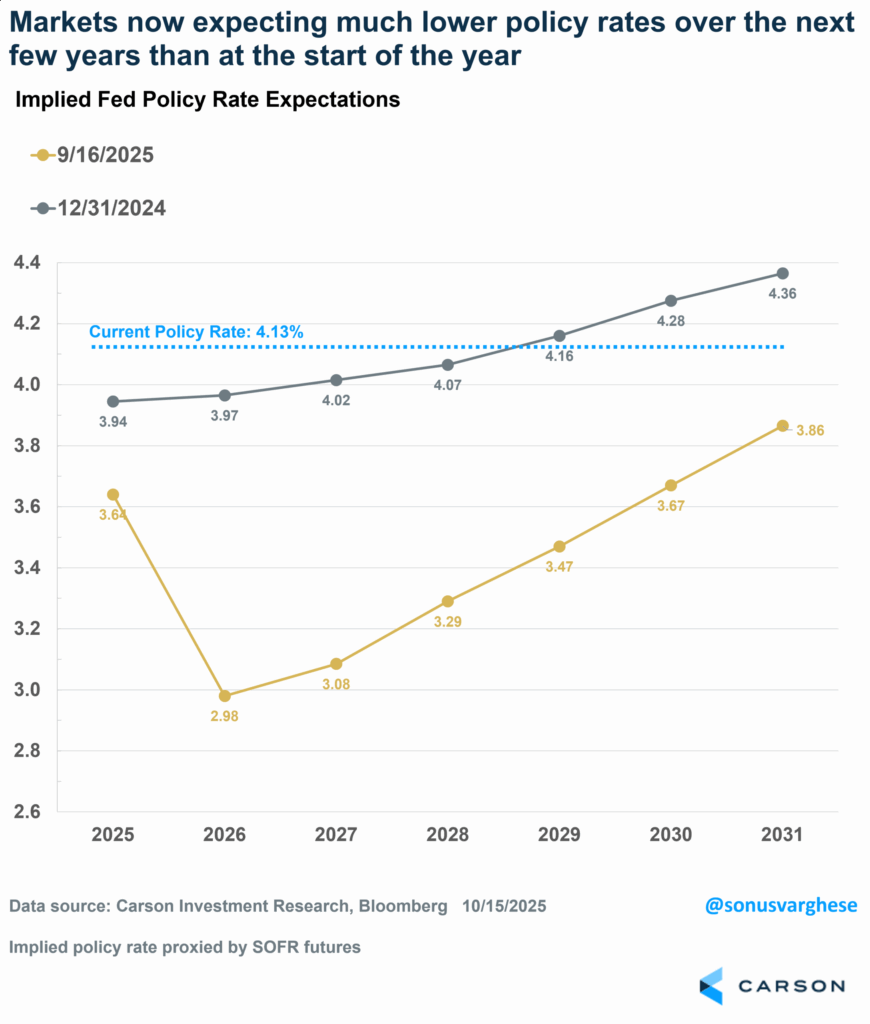
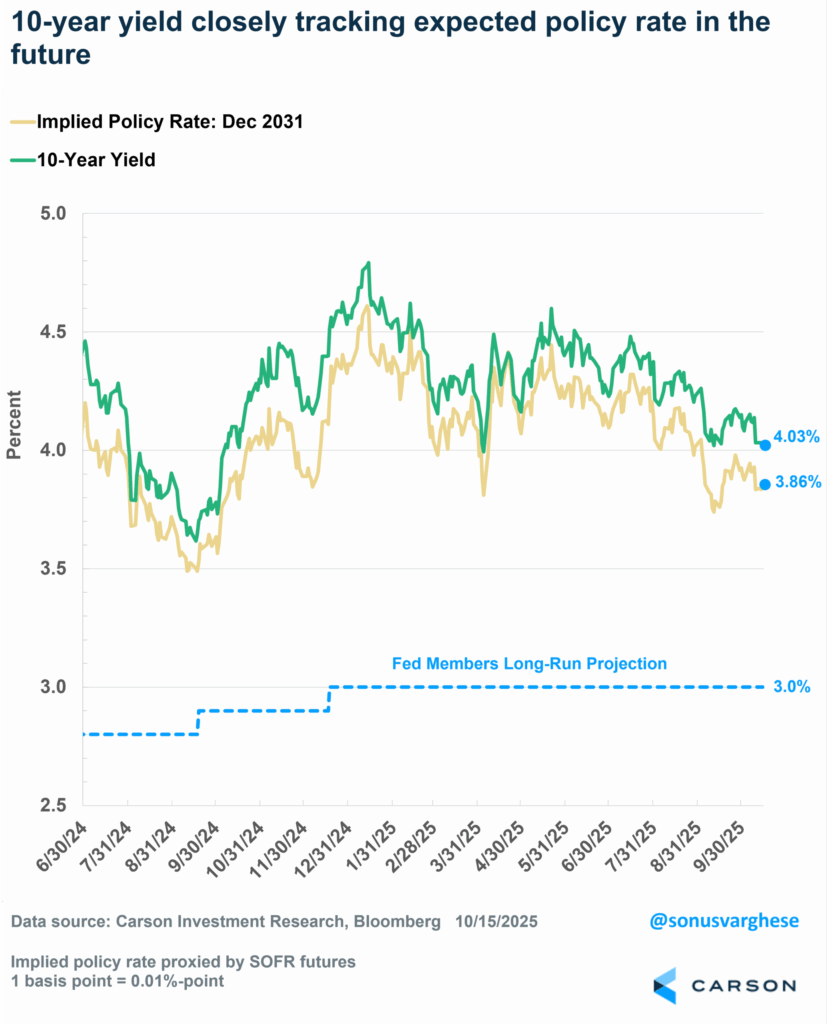
Even far-dated 2031 expectations have fallen 50 bps, keeping long yields anchored. The 10-year has tracked that decline, signaling markets expect an extended period of low real rates (a tailwind for gold). Interestingly, Fed members expect the long-term “neutral” rate to be 3% but markets are pricing rates well above that.
Here’s another way to look at what’s happening with yields. As I noted above, long rates are essentially future expectations of short-term rates. But if you take the 10-year or 30-year yield, it’s actually the average expected yield over the next 10 or 30-years. So knowing that it went up is not very useful, as it doesn’t tell you whether long-term rates went up because near-term rate expectations rose, or long-term expectations rose, or both.
We can decompose yields into short-term yields and future expectations of short-term yields. There is a “term premium” but this is a reasonable approximation. The 30-year yield can be decomposed into
- The 2-year yield, reflecting near-term expectations for Fed policy
- The 8-year yield expected after the first 2 years, i.e. 2-year/8-year, reflecting growth expectations over the next decade
- The 20-year yield expected 10 years from now, i.e. 10-year/20-year
As you can see in the chart below:
- The 2-year yield has plunged over 70 bps as investors price in cuts
- Medium-term yields (2-year/8-year) remain elevated, but they’ve softened recently – reflecting a Fed that may keep rates on the lower side even beyond 2026-2027
- The long-end (10-year/20-year) remains stubbornly high near 5%, implying that inflation concerns persist even as growth slows.

Inflation Expectations Remain Tame, Despite Uncertainty
Market-based expectations appear tame. One-year inflation swaps hover around 3.1%, inflated by tariff effects, while the nine-year-ahead average sits near 2.4% (1-year/9-year) —roughly in line with the Fed’s target when adjusted for the CPI-PCE gap (usually about 30 – 40 bps).
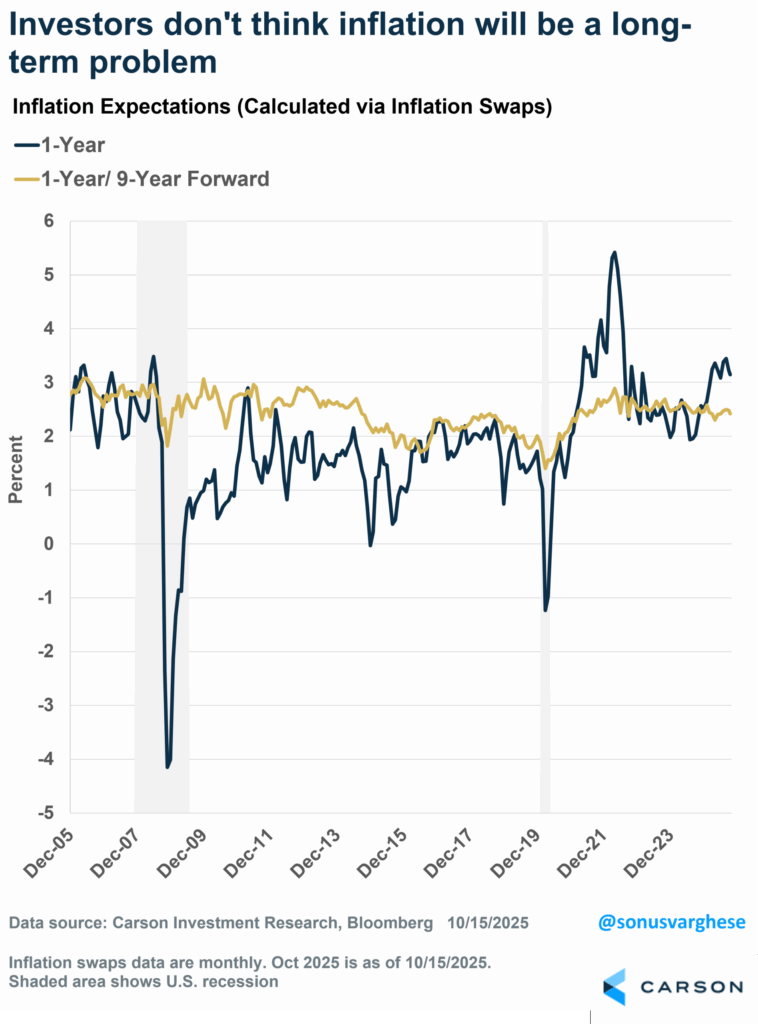
Survey data are less settled. The University of Michigan survey shows widening partisan splits, with independents still expecting 3.7% inflation over five years—higher than in mid-2022 when inflation peaked. The New York Fed survey is milder, with one-year expectations at 3.4% and three-year at 3.1% – not too far above what we saw in 2015-2018.
Taken together, inflation expectations are stable. But there’s still a lot of uncertainty, and I don’t think these expectations reflect tail risks. Inflation remains above target, but there are opposing forces on inflation: shelter costs are easing while food and electricity stay high. Rate cuts could spark a mild re-inflationary boom, especially if tariffs and reshoring persist. Deglobalization and geopolitical frictions—U.S.-China tensions, tariff wars—add chronic cost pressure, and goods inflation may not be “transitory”. I’m not saying inflation is going to surge, rather it’s a very messy outlook.
What’s The “Message of the Market” From Gold?
If official inflation gauges look contained, what is gold signaling? Possibly that investors distrust them. Gold may be front-running a period of low real yields—either from easier Fed policy or from fiscal and political constraints that discourage tightening.
One interesting counter-factual here is to think about what could cause gold prices to get crushed and stay down?
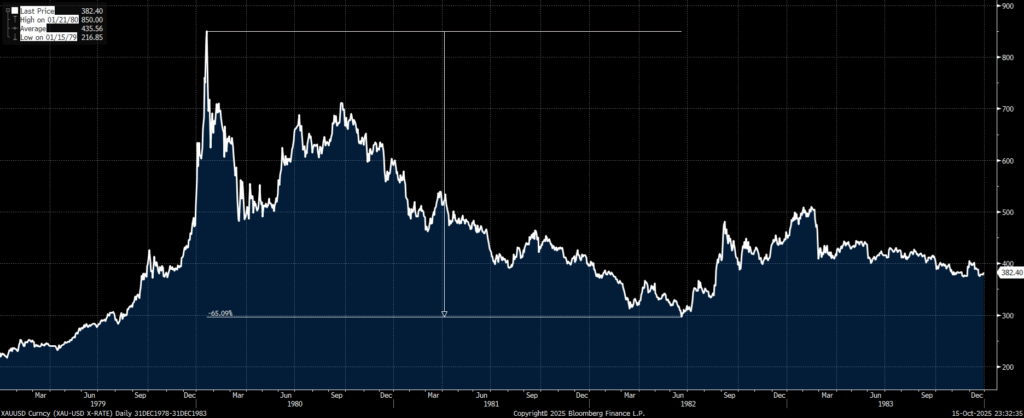
History provides a benchmark: in 1980-81, Paul Volcker crushed inflation with rates near 20% – not only did he push the economy into a recession, but gold prices fell 33% in 1981 and saw a 65% drawdown from peak levels in January 1980 to the bottom in June 1982.
Today’s Fed is doing the opposite. At Jackson Hole on August 22, 2025, Powell emphasized prioritizing jobs over inflation—a dovish tilt reinforced in subsequent meetings. Not coincidentally, gold’s latest leg higher began that week.
As I mentioned above, the inflation outlook is messy. In such an environment, the Fed’s shift toward labor-market protection implies structurally lower real rates, a key tailwind for gold. Momentum, central-bank diversification, Asian household demand, and debasement fears all reinforce the rally, but the unifying thread is that real yields are falling while trust in fiat stability erodes.
What Could End the Rally?
A sharp policy reversal—an explicit Volcker-style tightening—could crush gold. Absent that, the setup remains favorable. With global growth uneven, the Fed dovish, and fiscal deficits entrenched, the opportunity cost of holding gold is minimal.
In other words, gold’s rise is less about imminent inflation than about a loss of confidence in nominal anchors—currencies, central banks, and policy discipline. Unless those anchors are restored, investors may continue to treat gold not just as a crisis hedge but as a currency alternative in a world of perpetual stimulus and strategic uncertainty.
For more content by Sonu Varghese, VP, Global Macro Strategist click here
8507670.1.-16OCT25A
