
“You can learn a lot by looking.” -Hall of Fame catcher Yogi Berra
Stay on Top of Market Trends
The Carson Investment Research newsletter offers up-to-date market news, analysis and insights. Subscribe today!
"*" indicates required fields
Stocks had one of their best starts to a year ever after six months in 2023 and the fun has only continued so far in July. If you’ve followed us since late last year then you know that we expected a good year and said there likely wouldn’t be a recession either.
By early November of last year, we were on record saying the bear was over. This was a widely despised call, as it was wildly out of consensus. Nearly everyone else said stocks would move back to new lows and most economists were talking about a near-certain recession.
But were there clues? We’ve heard many say there were no warning signs that the bull was back. We’d disagree wholeheartedly, as there were many, many clues a big rally was coming. In this blog today I’ll share some of the exact same charts and tables we shared late last year and early this year that suggested a big rally was coming.
One clue was the average bear market without a recession was 23.0%, right in line with the 25.4% bear market we had just experienced. Given we said there was no recession coming, it didn’t make sense to see stocks fall significantly further.
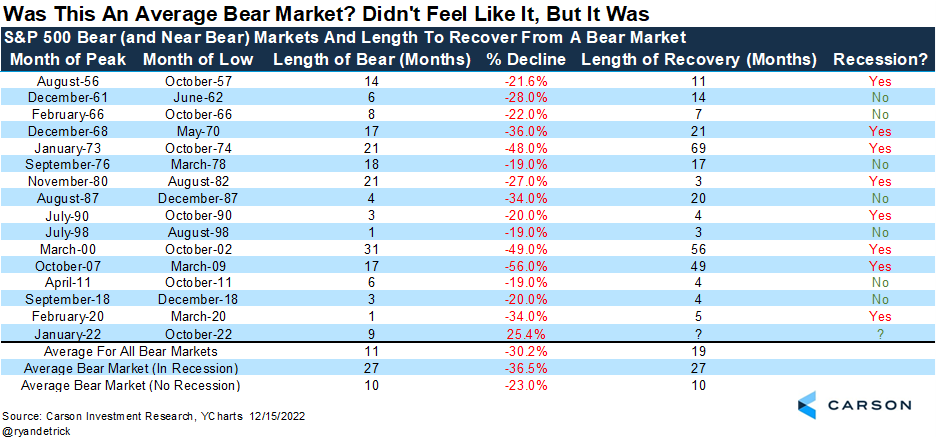
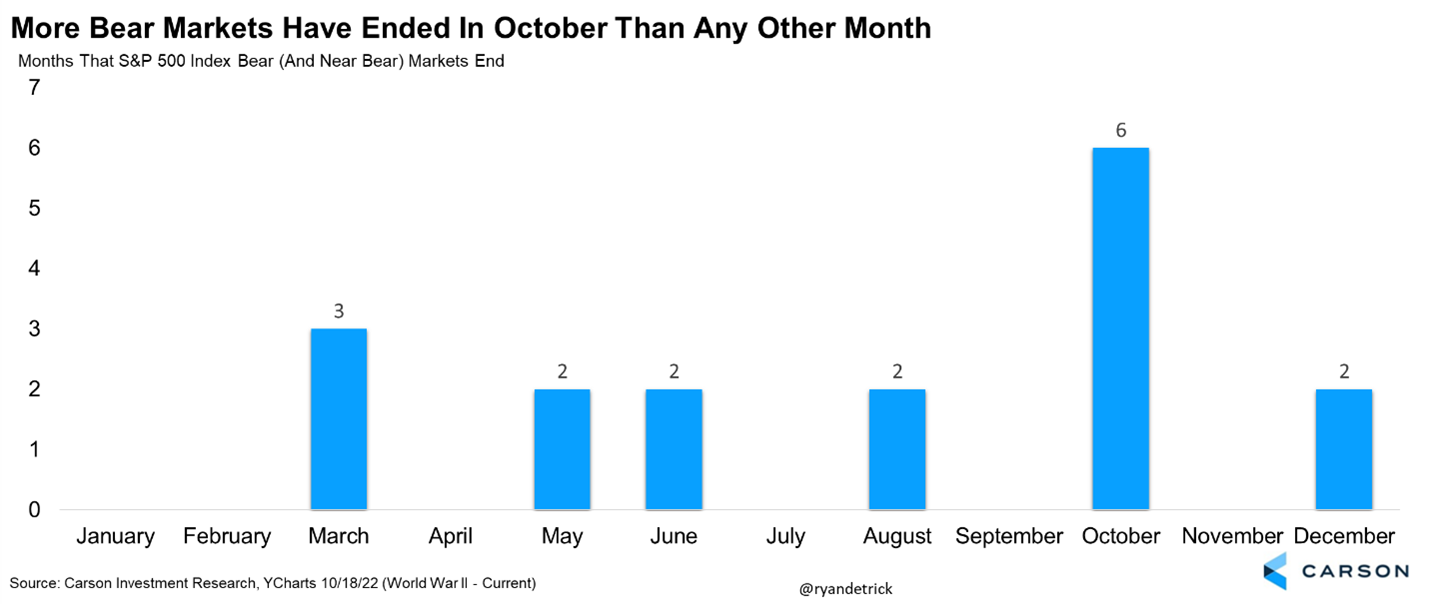
We noted many times that October was a bear market killer, as six of the previous 17 bear markets ended in this month. Make that seven of the past 18.
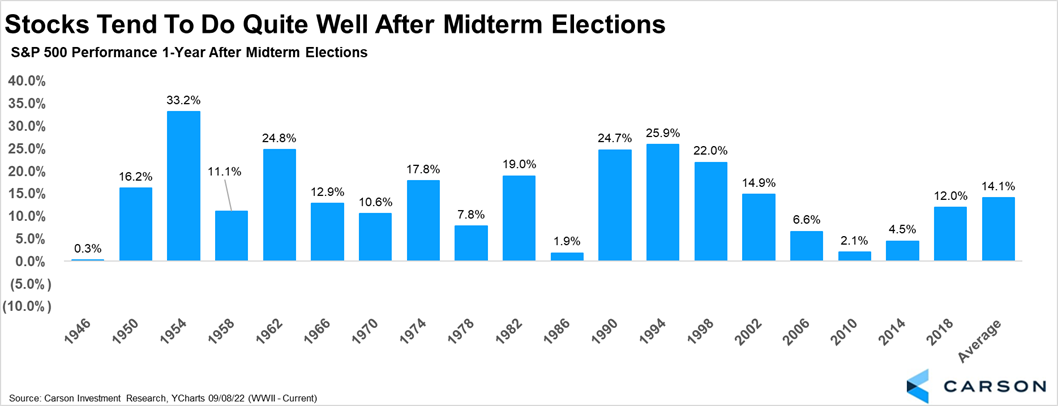
Stocks historically do really well the year after a midterm election, something we weren’t going to go against. In fact, stocks have never been lower going back to World War II.
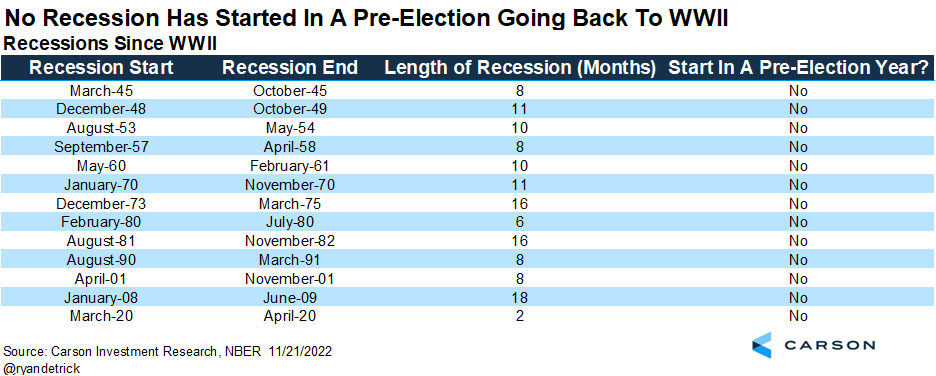
The odds of a recession were slim, given how strong the consumer and employment backdrop was. At the same time, recessions simply don’t start in pre-election years. Or at least we haven’t seen one start in a pre-election year going back to WWII.
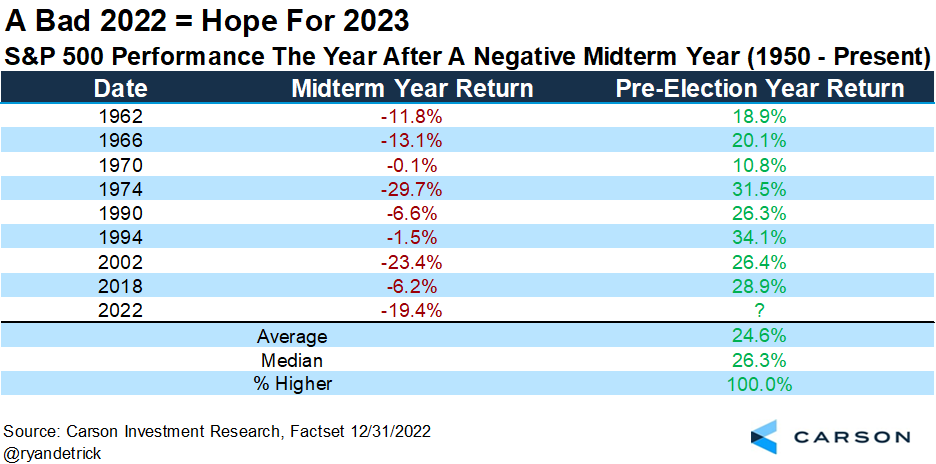
Speaking of pre-election years, stocks tend to do quite well here, up nearly 17% on average. But when the year before was negative (like 2022), the average return jumps to 24.6% and has never been negative.
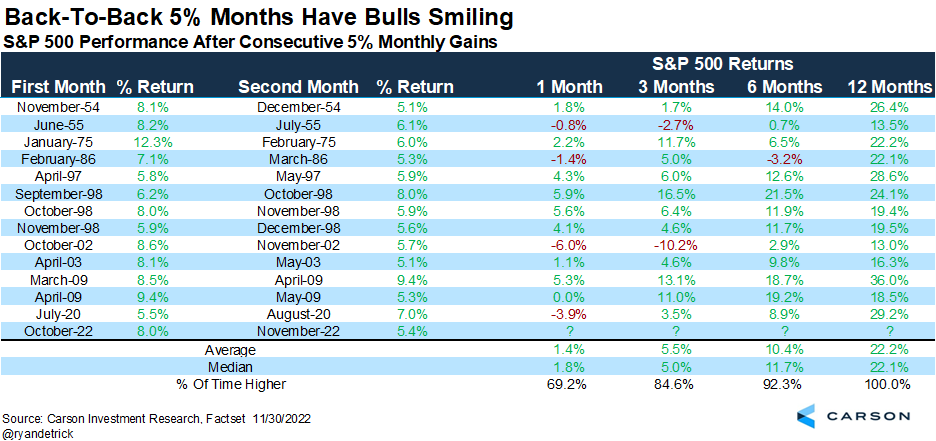
The S&P 500 gained more than 5% in back-to-back months in October and November. This isn’t what you see in the middle of a bear market, but something you tend to see at the start of new bull markets.
Going back to midterm years and pre-election years. When a midterm year is lower, then expect some fireworks that following year.
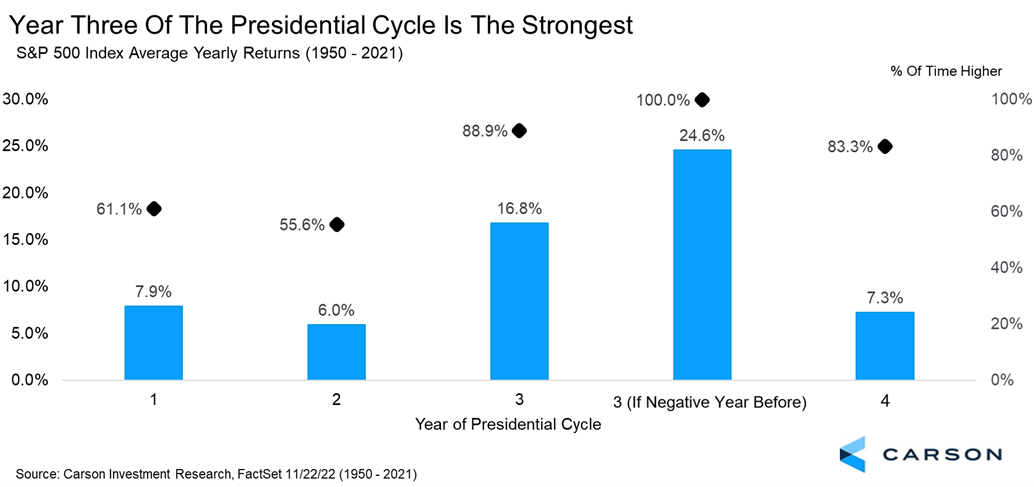
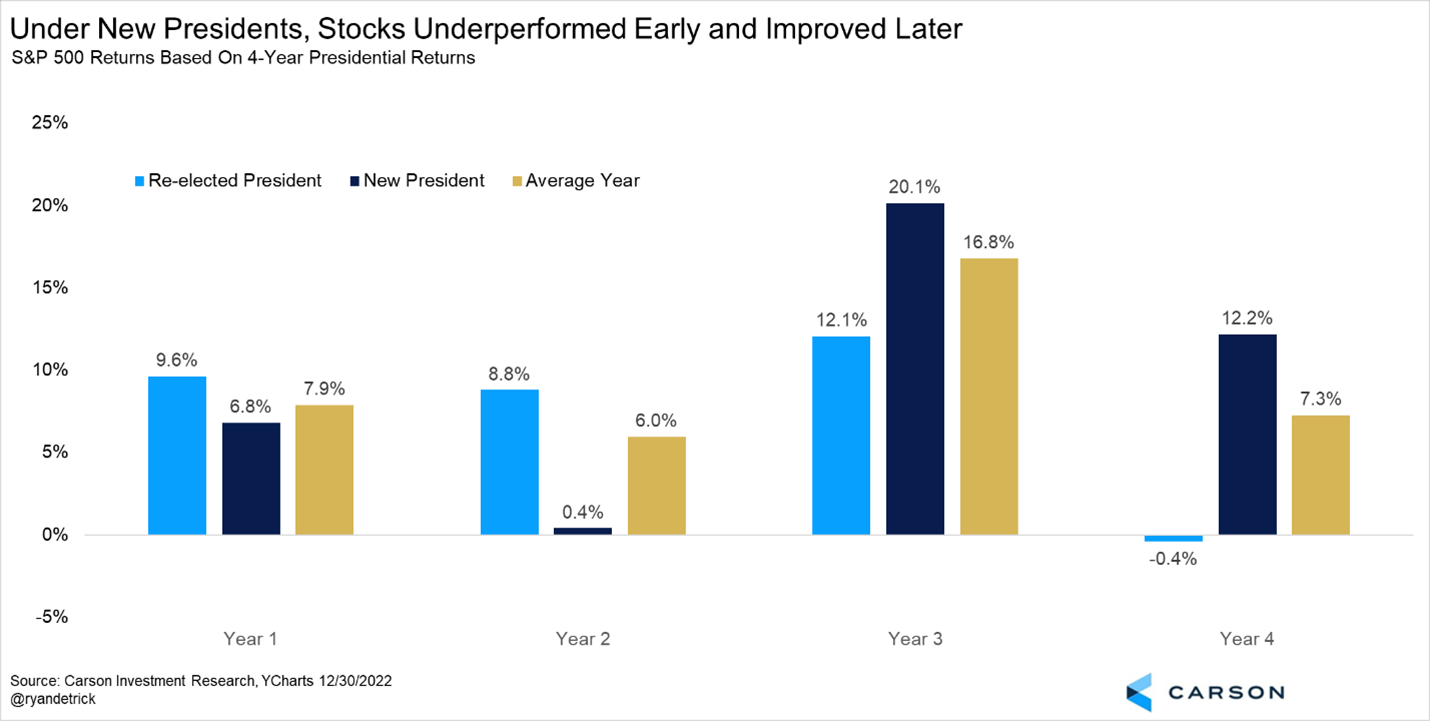
Another thing we knew was that the third year of a new President tends to see the very best returns.
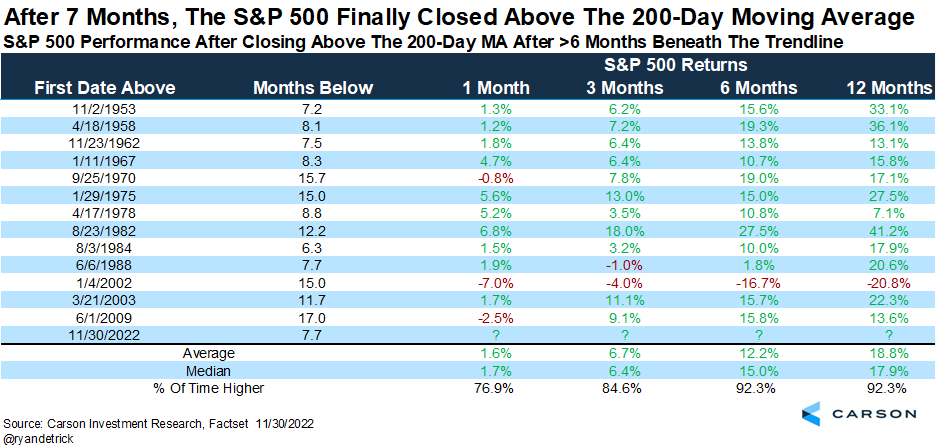
In late November the S&P 500 finally moved above the 200-day moving average after more than seven months beneath it. Historically, stocks tended to soar from this point, up nearly 20% a year later.
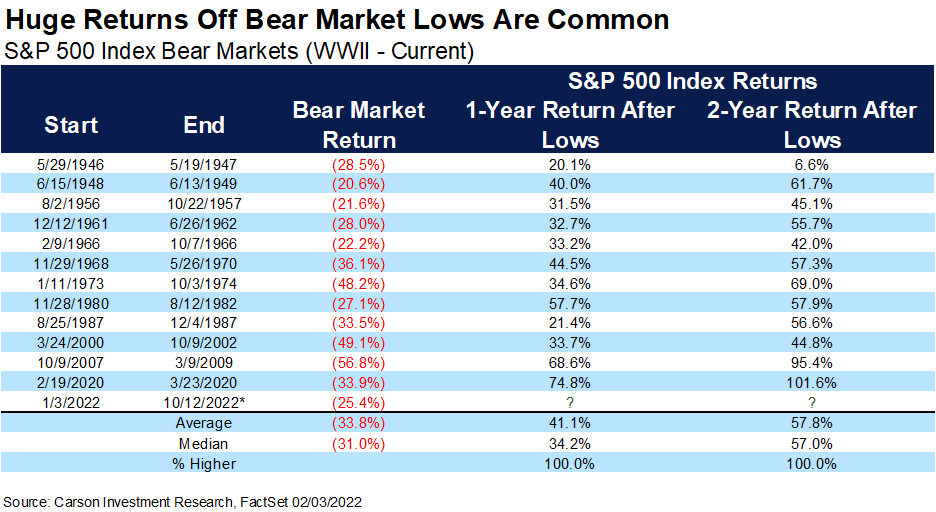
What if October was the low, like we started to say in November? Well, enormous gains a year later wouldn’t be abnormal.
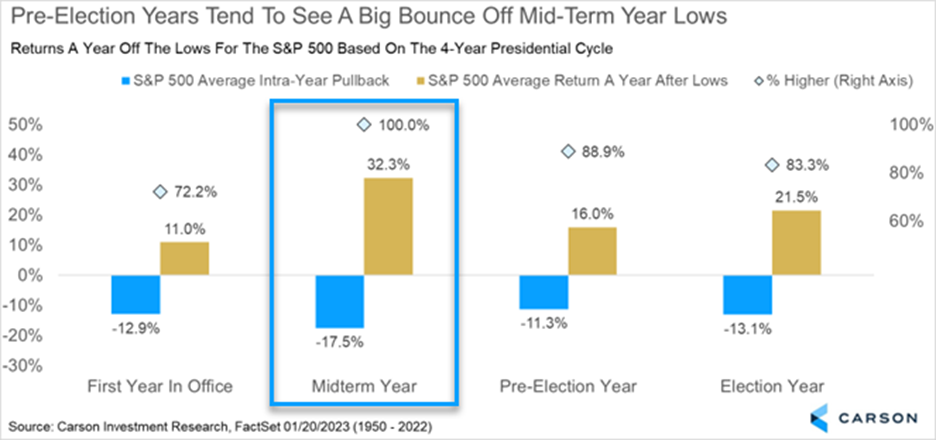
Another chart we shared many times late last year was a year off of the mid-term year lows, stocks tend to gain a lot, to the tune of more than 32% on average and never lower. We knew October 12 was the closing low at the end of the year, so we could make a safe assumption that big gains would be in store a year after those lows.
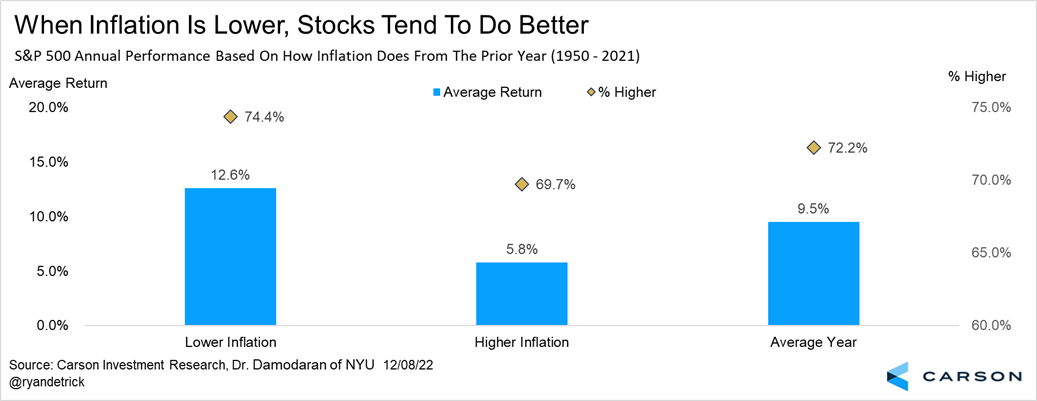
Inflation soared last year, but we expected it to come back this year. Simply put, stocks tend to do much better when inflation is lower than it was the year before.
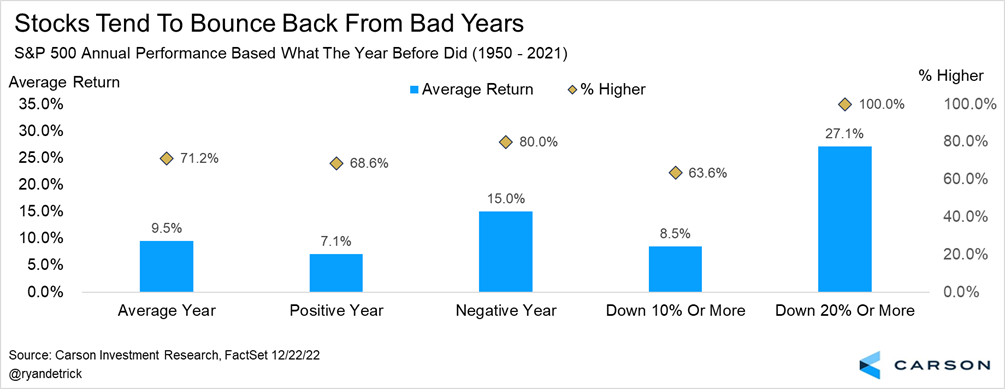
It is really rare for stocks to be lower two years in a row. The odds of a big bounce back were high. Not to mention when the previous year falls 20% or more, the move back the next year tended to be huge. Stocks didn’t quite lose 20% last year, but it was close, suggesting higher prices in 2023.
So, everything I’ve said above were things we shared late last year, again, giving clues a bounce back was likely. Now we will look at things that happened in the early part of this year that added to the chances of a strong rally.
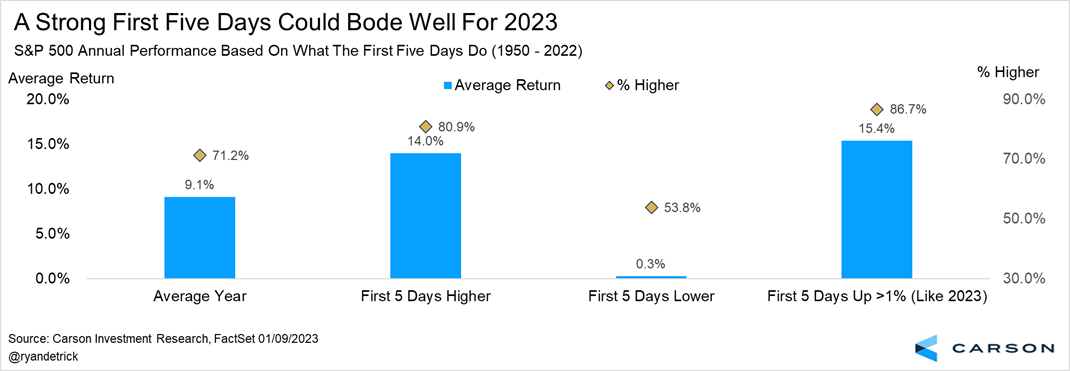
When the first five days are up nicely, like this year, the full year has tended to go well.
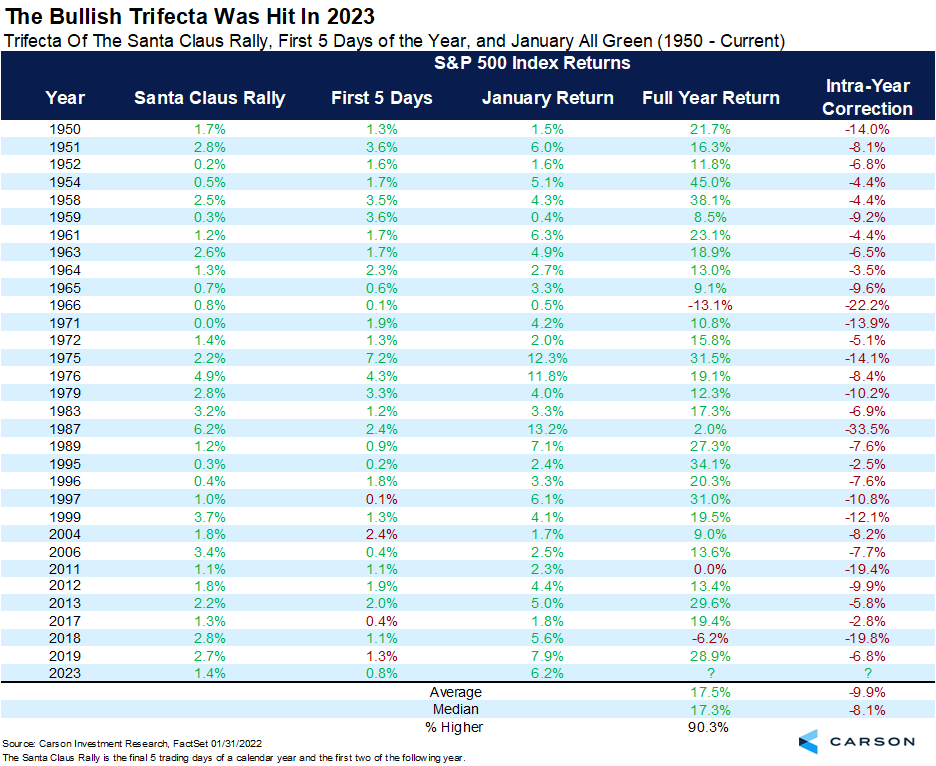
The bullish trifecta was met as well. This is when stocks are up during the Santa Claus Rally period, the first five days, and during the month of January. Following the trifecta, stocks are up 17% on average for the full year and higher 90% of the time.
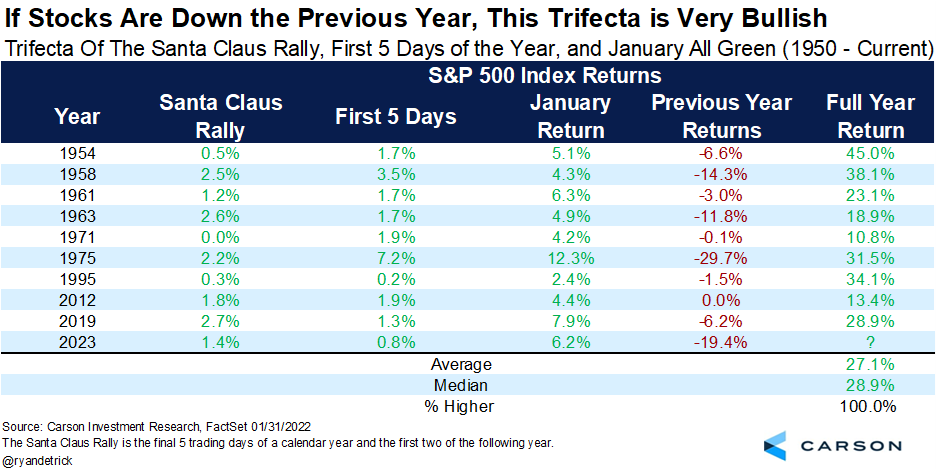
What if stocks fell the previous year and hit the trifecta? Things tended to get even better.
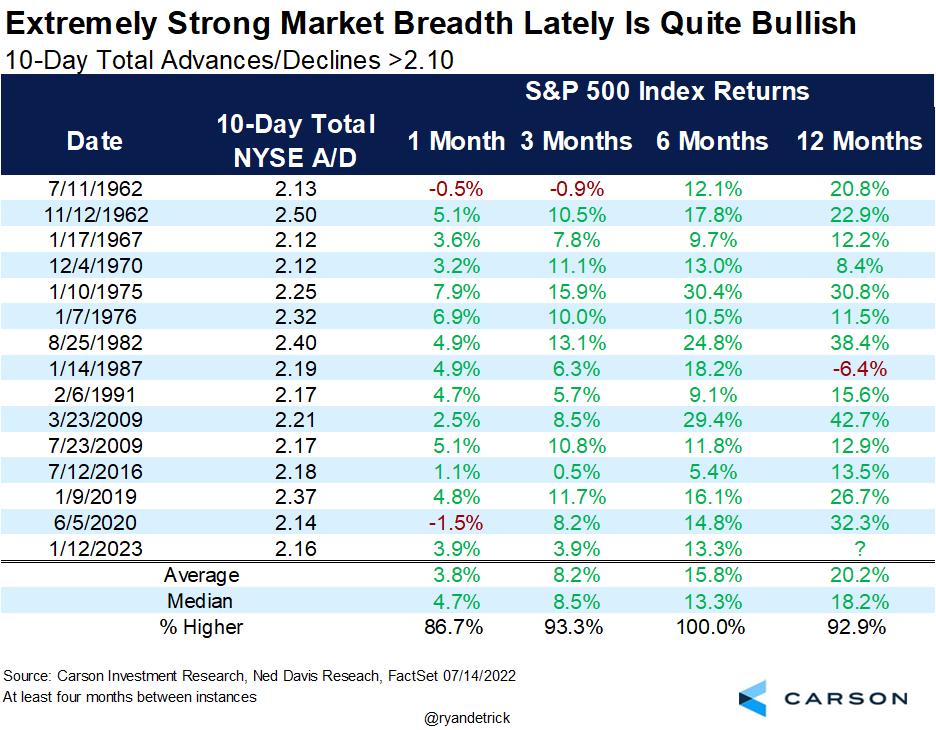
We saw extreme buying pressure to start the year, with the 10-day total of advances versus declines on the NYSE above 2.1, a very rare signal. As you can see in the table we shared in mid-January, six months after this signal stocks had never been lower. Six months later this year, that is still true.
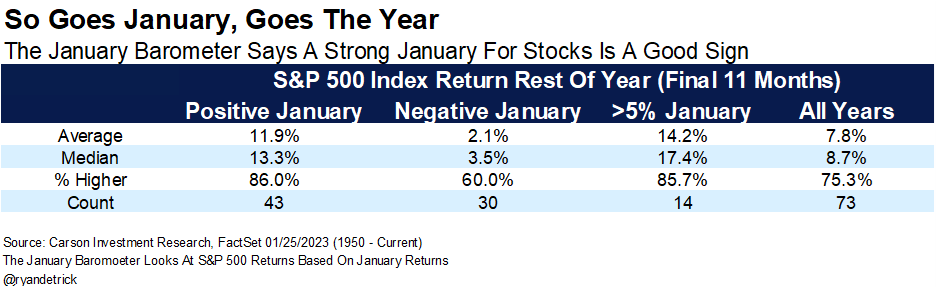
Stocks gained in January and the gains were large, more than 5%, suggesting the full year was going to be up nicely.
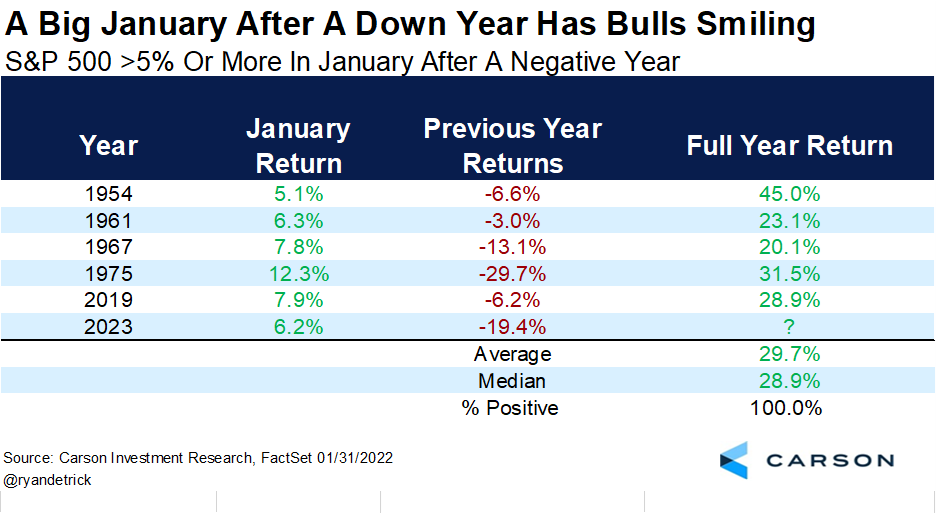
But if the year before was negative and stocks added 5% in January, the full year did even better, up close to 30% and never lower.
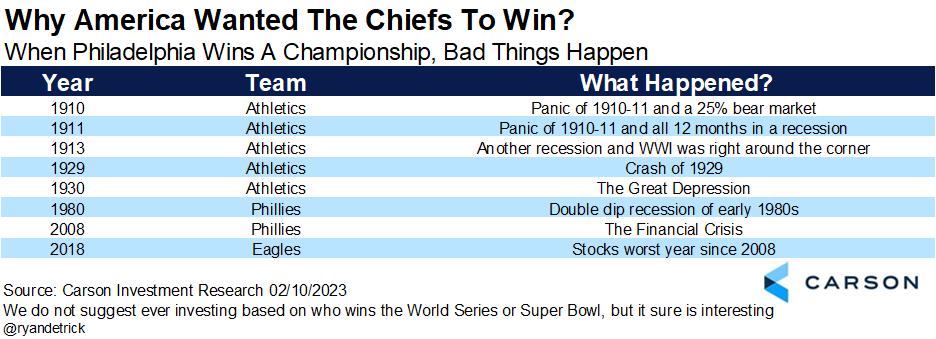
Lastly, stocks tended to do quite poorly when a team from Philly won it all in baseball or football. With apologies to the great fans of the city of brotherly love, a narrow loss to the Chiefs in the Superbowl may just have given markets a little extra insurance. Sure, this is actually random and all, but I’m not arguing with history!
So there you have it. I just shared 20 tables and charts that we shared from October through January, which all told a similar story. Go all the way back up to the top and the quote from Yogi. The clues were there and you could learn a lot by watching. If you watched what the Carson Investment Research team was saying, this historic rally shouldn’t be much of a surprise.
This is a big reason why we moved our Carson House Views for equities from neutral to overweight all the way back in December. We expected markets to rebound in 2023, as we wrote in our 2023 outlook.
If using an evidence-based approach to investing makes sense to you, please continue to follow us. And for more of our views on what could be next, be sure to read our just released Mid-Year Outlook: Edging Closer to Normal.
1839192-0723-A