
One of the central themes in our 2024 Outlook was higher productivity growth over the next several years. The key idea was that tight and mature labor markets enhance worker productivity and incentivize businesses to organize work more efficiently and invest in technological resources. That’s something that doesn’t happen when labor is cheap. With better productivity growth, you can have strong wage growth without significant inflationary pressures. That allows the Federal Reserve (Fed) to ease rates – not by a lot, but just enough to boost business investment and drive further productivity gains.
The problem right now is that rate cut expectations have been pushed further out, thanks to firmer inflation data in Q1. That’s led to rising bond yields and market volatility in April. As Ryan discussed in his latest blog, the shift in pricing has been remarkable – going from 6-7 rate cut expectations at the beginning of the year to under 2 now.
However, there’s been some missing of the forest for the trees amidst this sharp shift in sentiment. I think it’s useful to look at the big picture.
Stay on Top of Market Trends
The Carson Investment Research newsletter offers up-to-date market news, analysis and insights. Subscribe today!
"*" indicates required fields
Economic Growth Remains Solid, As Does the Outlook
Yes, we got some hot inflation data in Q1, albeit for some idiosyncratic reasons (see my blog for more on that). But we also got the following:
- Strong employment data, with payroll growth accelerating from last year and layoffs low
- Strong consumption data, including March retail sales
- Strong industrial production data and a pickup in manufacturing survey sentiment
Perhaps the best way to capture all of that is via the Atlanta Fed’s GDP Now estimate for Q1 GDP growth – that’s now at 2.9%. And it hides underlying strength. Inventories and exports are typically the most volatile parts of GDP, and excluding those tells us the pace of underlying demand in the economy (inflation adjusted). That’s above 3.5% now! For perspective, the 2010-2019 trend pace was 2.4%.
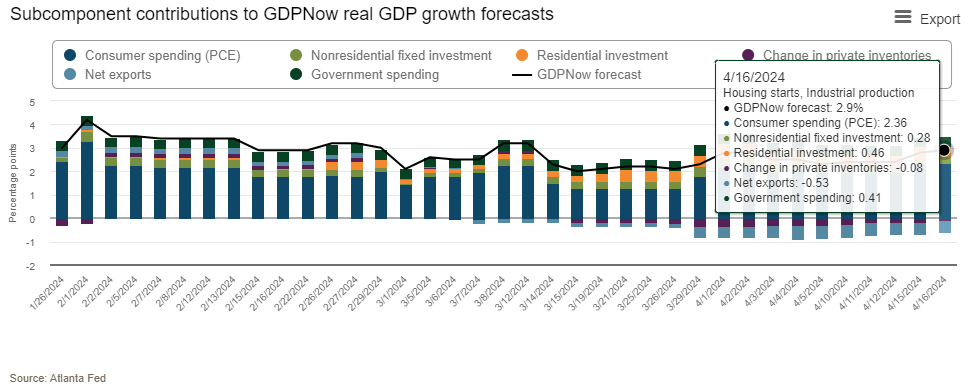
Perhaps just as important, the employment data shows that “hours worked” by workers was more or less flat in Q1. That means productivity, which is output over hours worked, is likely to run above trend for the fourth quarter in a row. It’s good to see that the productivity story is intact, mostly thanks to a strong labor market, and that bodes well for future growth.
Higher Interest Rates for Much Longer
Usually as short-term interest rate expectations rise, investors get worried that the Fed is “too tight,” driving economic growth lower (or into a recession). So long-term yields typically fall in anticipation, as inflation expectations fall. However, long-term rates have risen recently, and even more so than short-term rates.
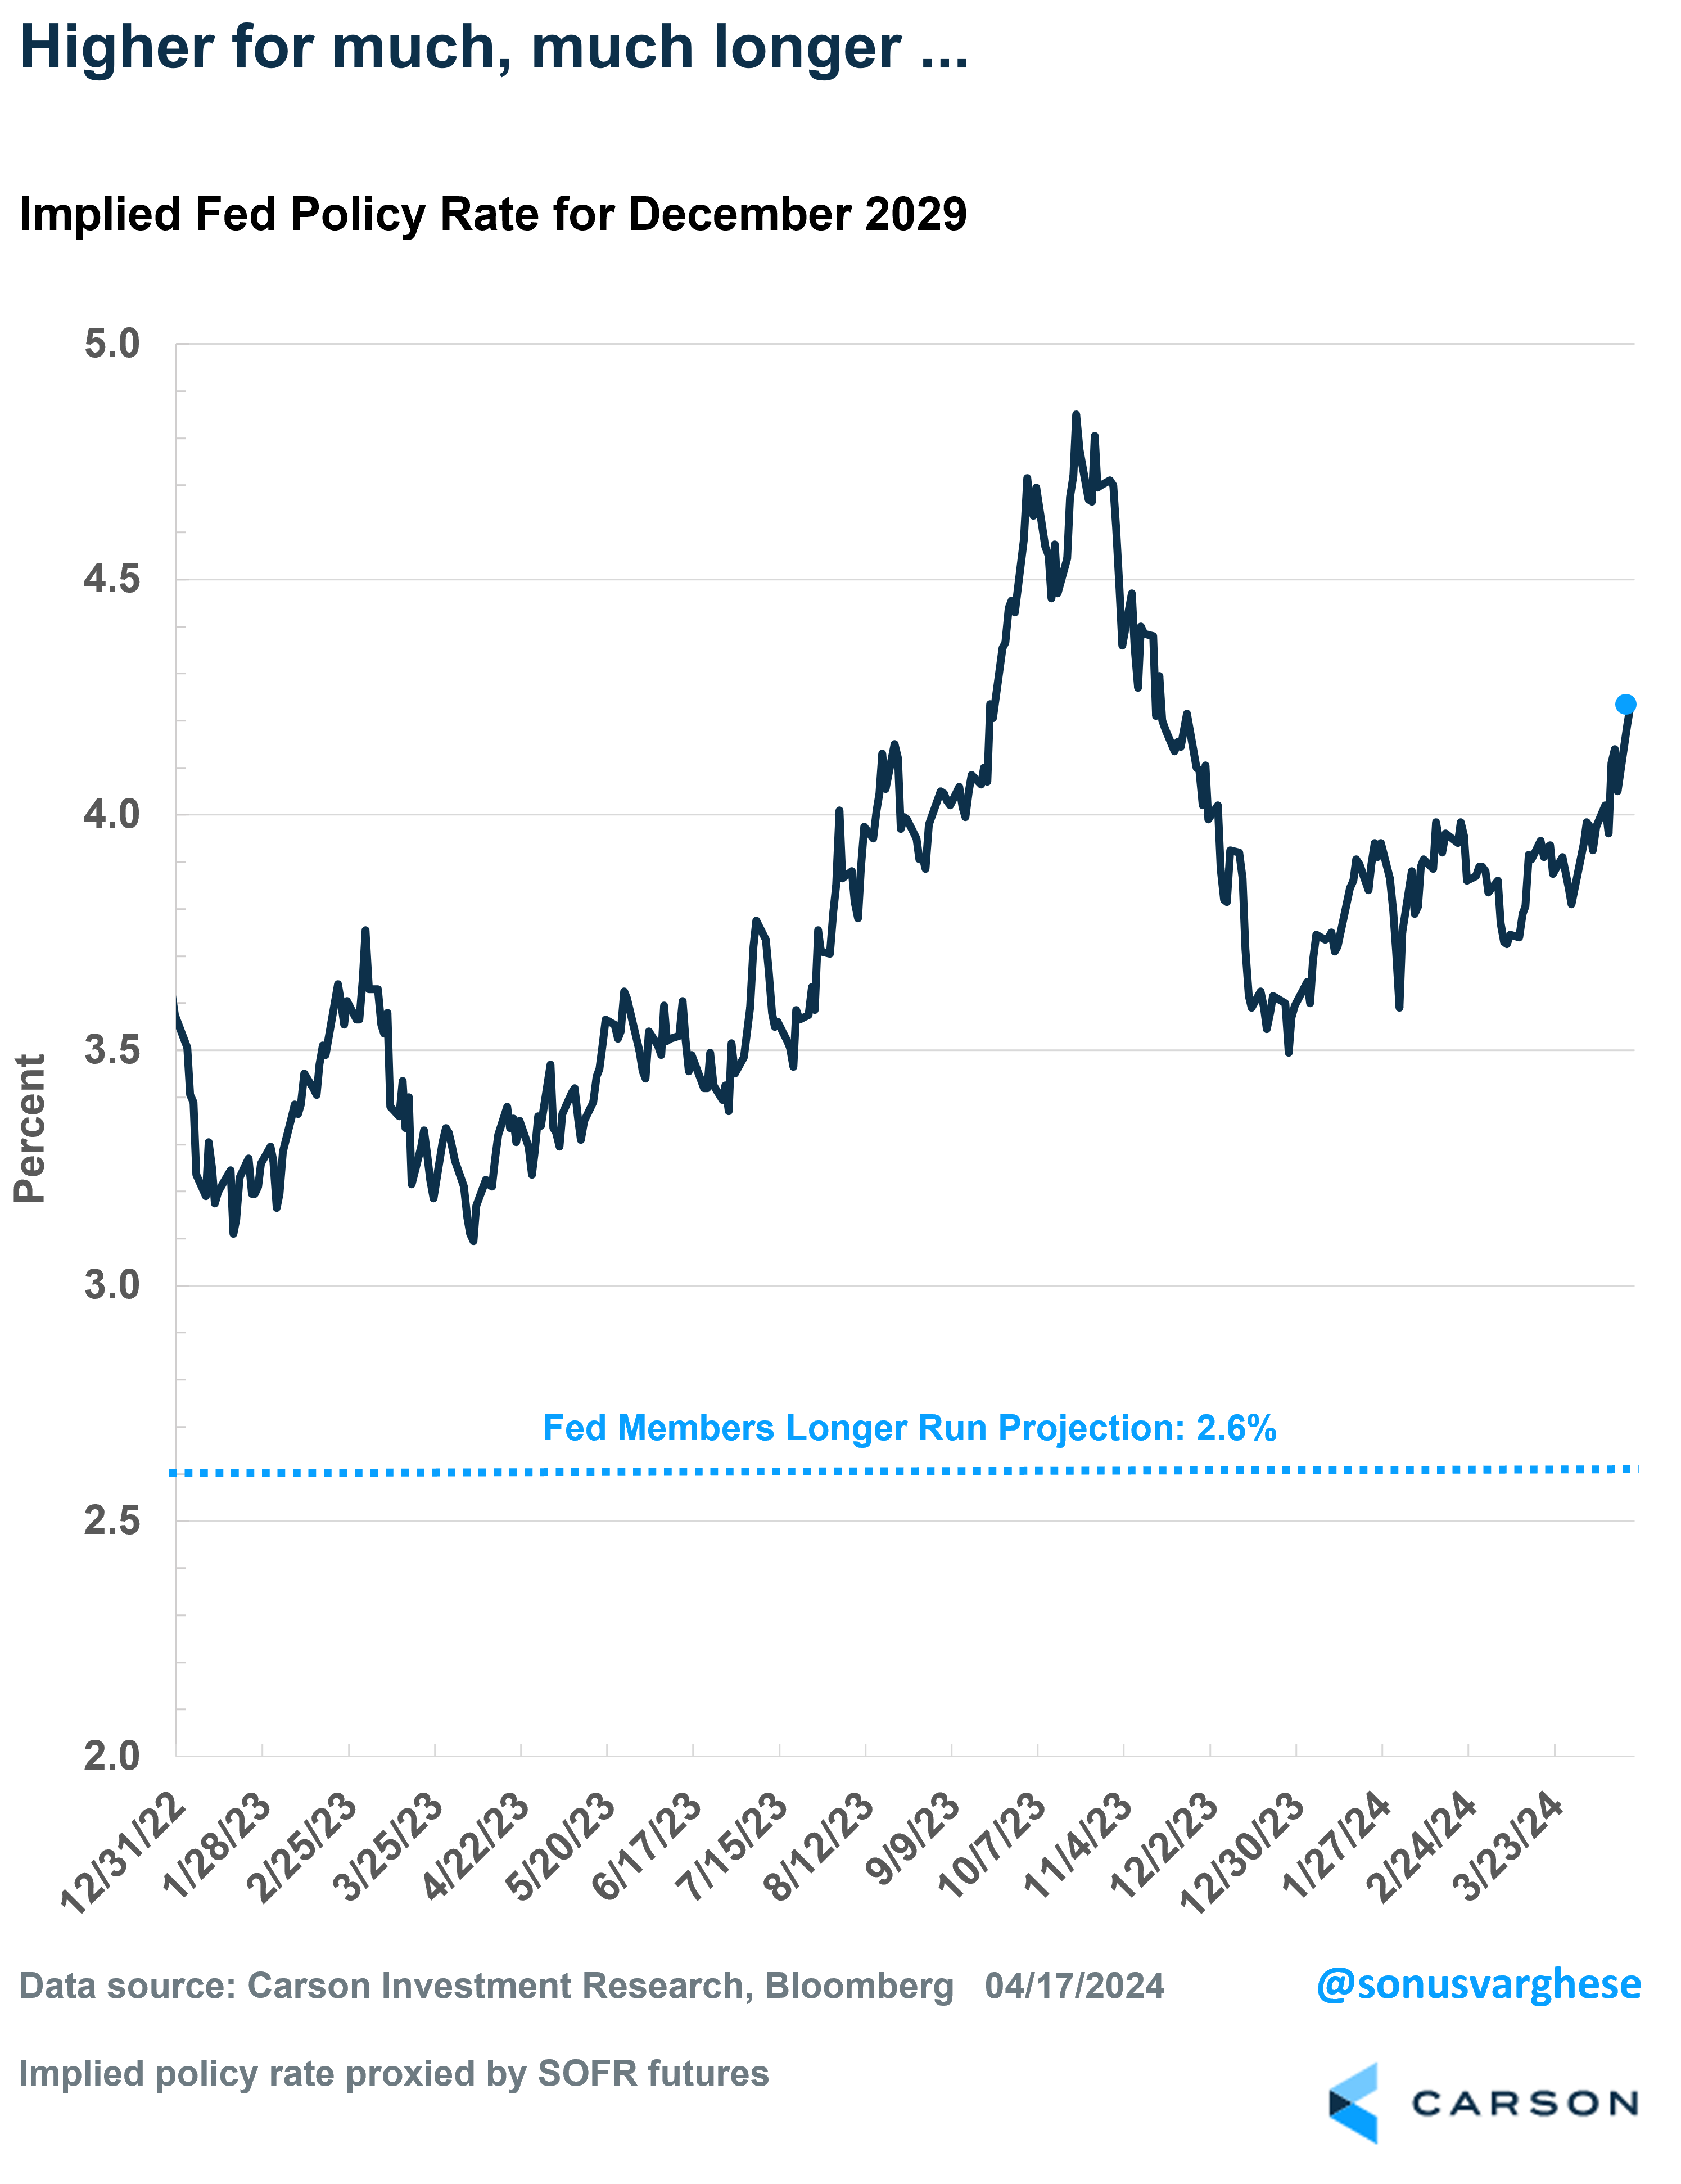
To a first approximation, long-term rates are simply an estimate of future short-term Fed policy rates. So, higher long-term rates means investors now expect higher policy rates in the future. In fact, expected policy rates for 2029 are now above 4%, well above where they were at the end of 2023. That implies investors now expect stronger economic growth in the future, with strong labor markets and high productivity. At the same time, an economy running near capacity means we could see more inflationary pressure, which is why investors expect policy rates to stay on the higher side.
Interestingly, the Fed expects to lower rates all the way down to 2.5 – 2.75% over the long run. That’s because they expect the economy to revert to the low productivity, low growth economy of the last two decades. We’re not in that camp – we expect stronger productivity growth over the next several years, leading to a stronger economy (relative to the last decade), and higher interest rates as a result.
Fiscal Deficits Are Not Going Away
This is an election year, and come the fall, the election-related noise is going to increase by several decibels. It’s best to not involve politics in investing, and as Ryan has written, it historically seems best to ignore who sits in the White House. But that does not imply that elections and policy don’t matter. Irrespective of who’s President, one thing we’re staring at is higher fiscal deficits over the next several years. (I wrote about this here.) Partly this is because of higher interest costs for the government, but policy will also play a role no matter which party is in the White House.
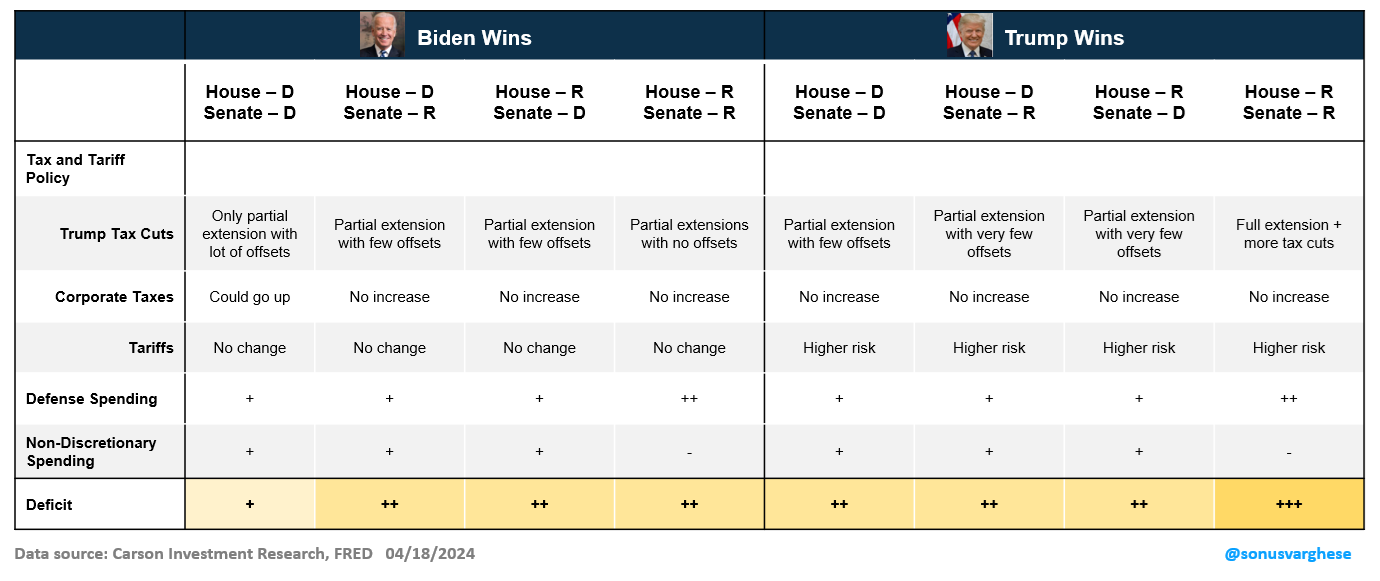
With respect to President Biden and former President Trump, we actually have a reasonably good idea of policies they’ll implement – and either way those are likely to drive the deficit higher over the next few years. The big one is tax policy. The 2017 Tax Cuts and Jobs Act (under President Trump) had a slew of individual tax cuts that are all slated to “sunset” at the end of 2025. Renewing them all, as President Trump has said he’ll do, means the deficit remains high (and he’s indicated there may be even more tax cuts to come). There’ll be some revenue coming in if he raises tariffs but that won’t be nearly enough to offset tax cuts. Also possibly confounding this will be who controls Congress if President Trump is re-elected.
On the other hand, President Biden has said he wouldn’t renew all the individual tax cuts, so cuts for the highest tax brackets would go away. He’s also raised the possibility of raising corporate taxes. Of course, he’ll need a Democratic sweep of Congress and Senate for this to happen, and right now, that’s looking very unlikely. The table below shows scenarios for control of Congress under President Biden or Trump, and the likely impact on the fiscal deficit.
Of course, the question is how deficits matter to markets.
Market Implications
A common refrain is that the stock market is not the economy (and vice versa), sometimes couched as “S&P is not GDP.” That’s true but profits matter for markets, and over the long term, market returns are mostly driven by profit growth. And profits come from the economy. It’s the net result of saving and consumption by four sectors of the economy: households, businesses, governments, and the rest of the world via trade. In fact, there’s a national accounting identity that precisely relates profits to the various components of GDP, called the Levy-Kalecki profit equation:
Corporate Profits After Tax = Corporate Investment + Dividends – Household Savings – Government Savings + Current Account Surplus
What it captures is the various sources of profits on a macro aggregate level:
- Investment: More businesses investing in equipment, structures, etc., increases profits. The idea is that one business’s investment is another business’s revenue, and profits.
- Dividends: Income received by shareholders tends to get spent, unless households increase their savings. So, it goes back to businesses as revenue.
- Household savings: If households spend more, that translates to more revenue and profits for businesses. Conversely, increasing household savings reduces profits.
- Government savings: Rising government savings reduces corporate profits, and vice versa. In other words, deficits add to profits, all else equal.
- Current account surplus: A rising current account surplus means the rest of the world is buying more US-made goods and services than Americans buy from foreigners, and that increases business revenues and profits. Whereas a current account deficit (which is typically what the US has) means Americans buy relatively more from abroad, and that’s a drag on profits.
By definition, this accounting identity has to be true. It doesn’t tell us which companies are growing profits, or how profits are distributed across industries. But it tells us what can happen to drive profits up or down. For example, if the government is reducing its deficit, corporate profits will rise only if the private sector is increasing consumption such that it offsets increased government saving. If not, corporate profits will fall.
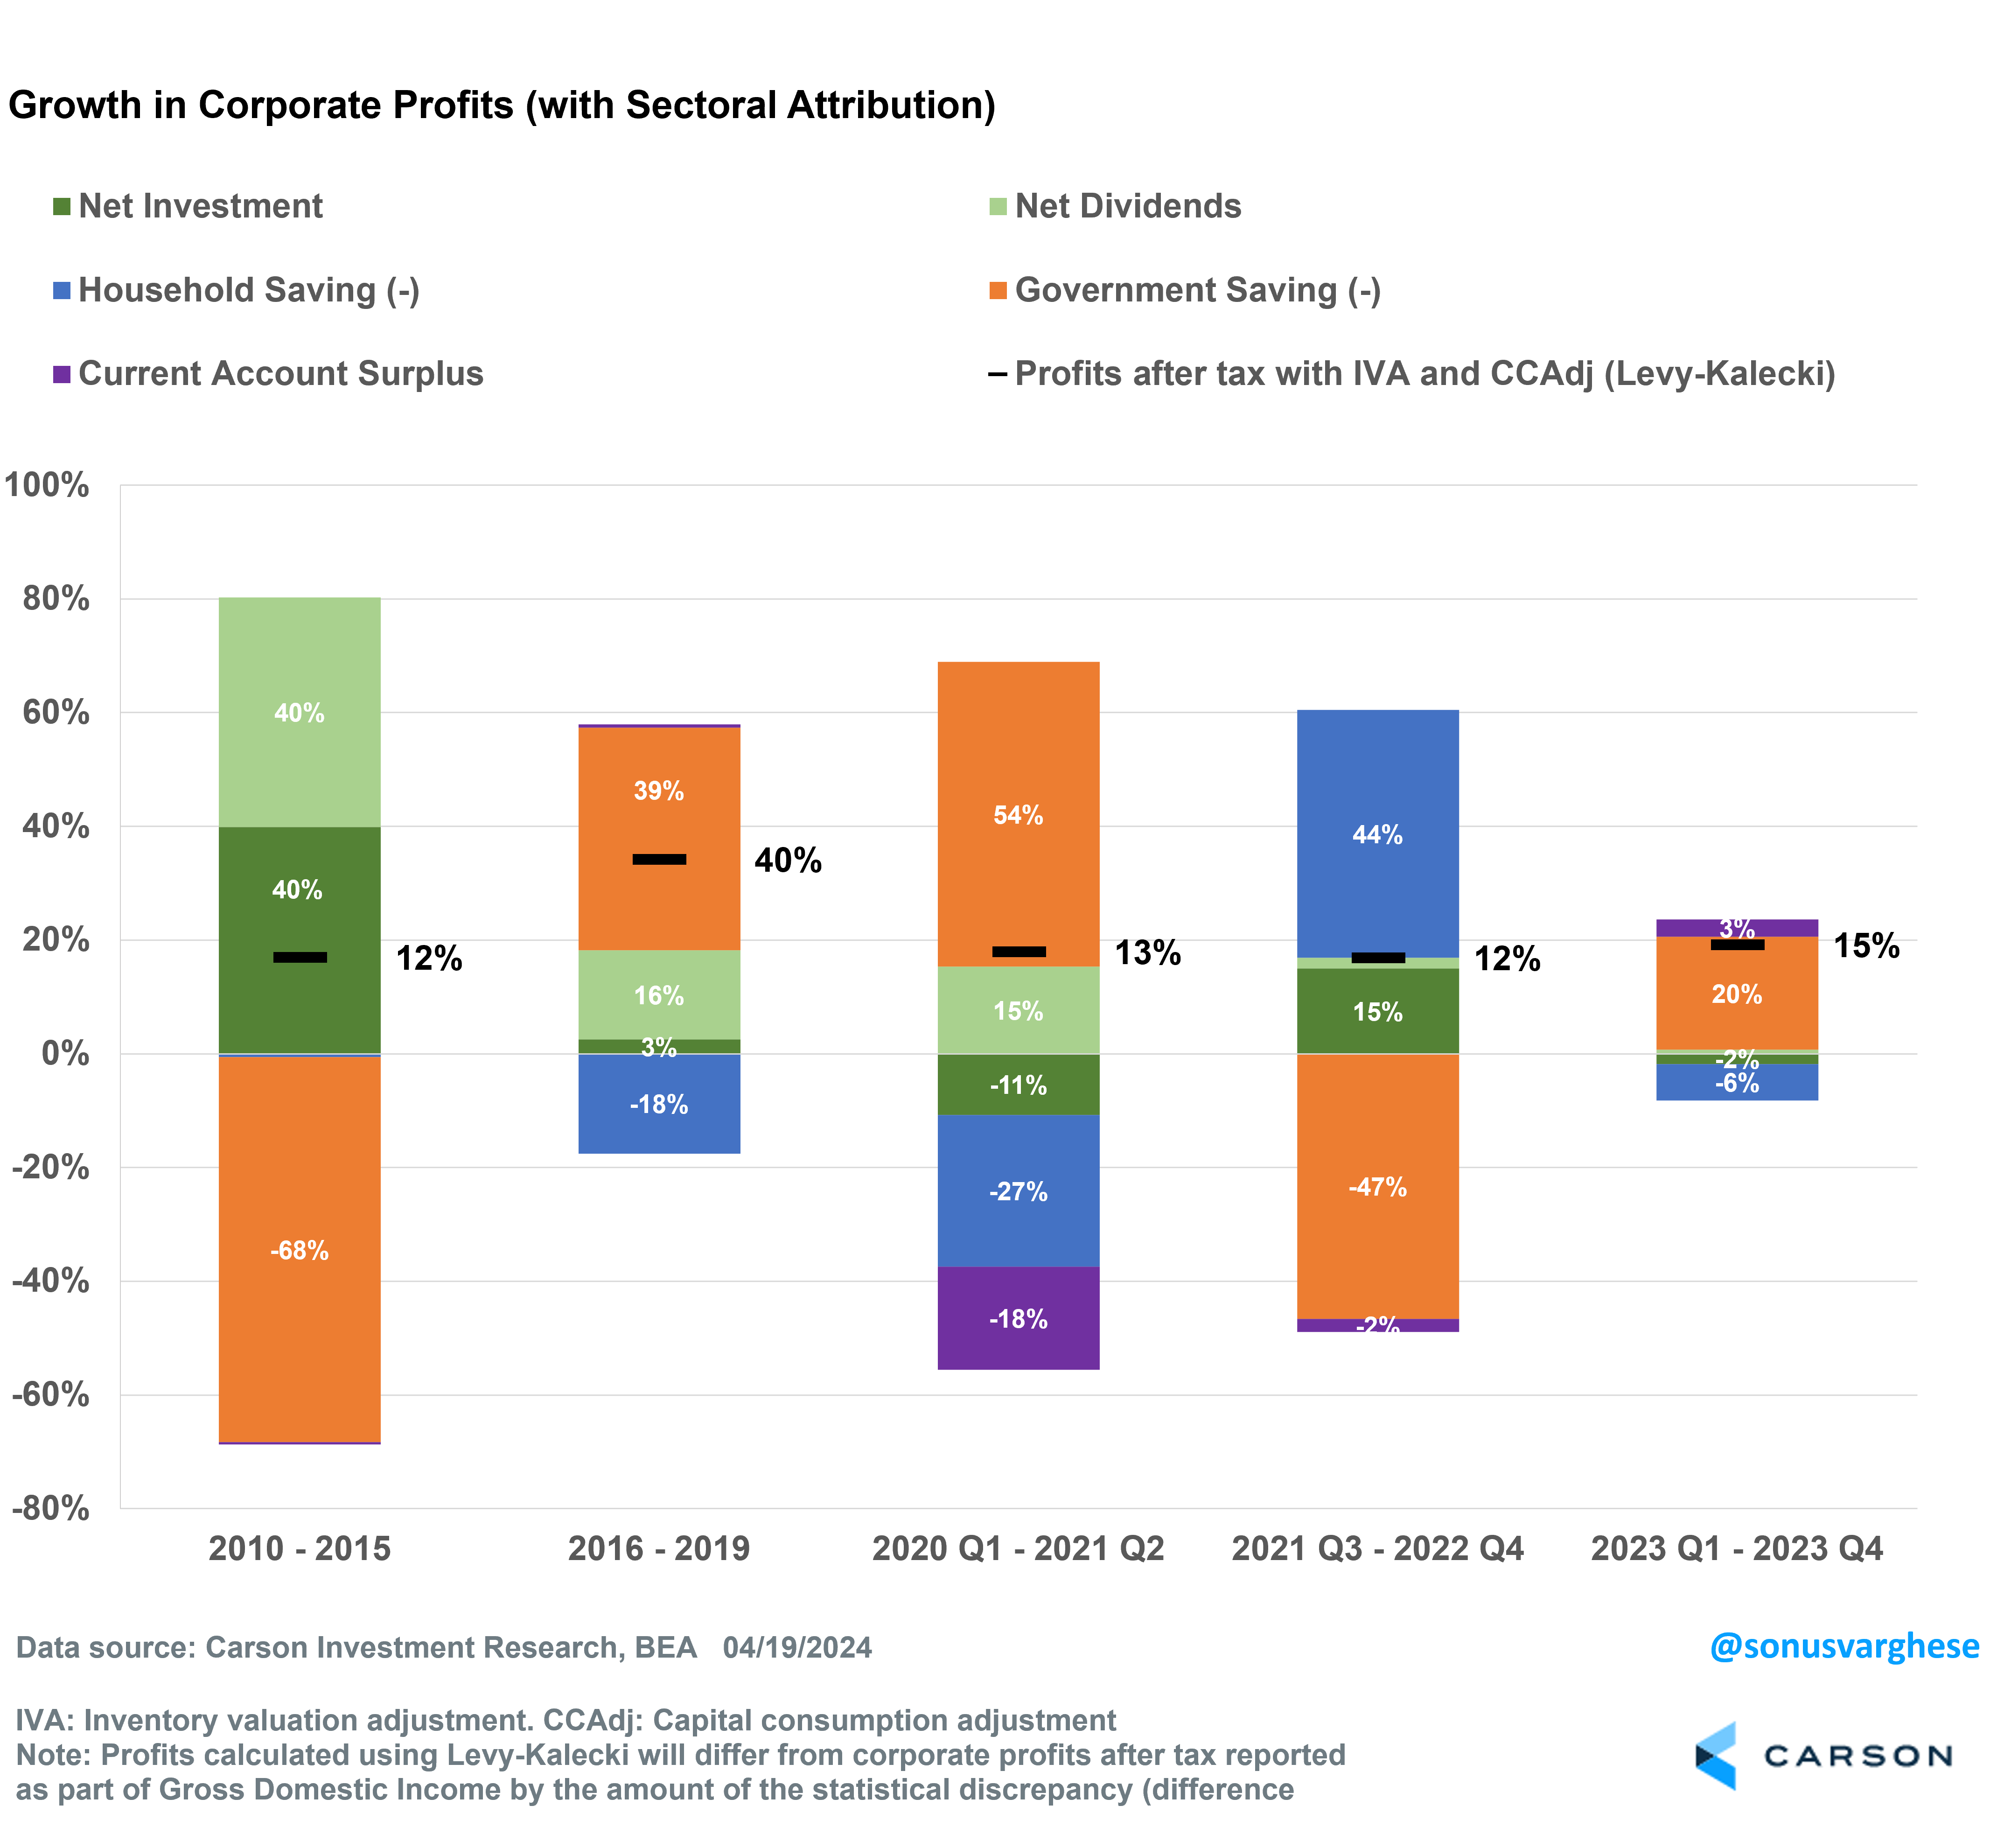
The chart below shows an attribution of corporate profit growth over several sub-periods since 2010. Note that this is not equivalent to S&P 500 profits, as it comes from macroeconomic data and includes all businesses in the US, public and private.
- 2010 – 2015: Business investment and dividends drove profit growth, overcoming the drag from the reduction in government spending.
- 2016 – 2019: Profit growth surged thanks to rising fiscal deficits (on the back of the 2017 tax cuts), even as households savings increased.
- 2020 Q1 – 2021 Q2: Profit growth was driven by massive fiscal deficits, which overcame the drag from rising household savings, lack of business investment, and rising trade deficit (as Americans purchased more goods from abroad).
- 2021 Q3 – 2022 Q4: Recovering household consumption (as consumers spent their excess savings) and business investment drove profit growth, overcoming the drag from falling fiscal deficits.
- 2023 Q1 – 2023 Q4: Profit growth was once again boosted by rising fiscal deficits (especially as interest costs rose), more than offsetting rising household savings.
Portfolio Positioning
These three themes: economic growth driven by stronger productivity, higher interest rates amid a strong economy, and fiscal deficits, are all related to profit growth. As I discussed above, business investment that boosts productivity can drive profits higher. The outlook for fiscal deficits suggests they’re going to increase. Higher interest costs for the government will only add to this. Fiscal deficits can boost profits as long as it is not completely offset by higher household savings rates and lack of business investment.
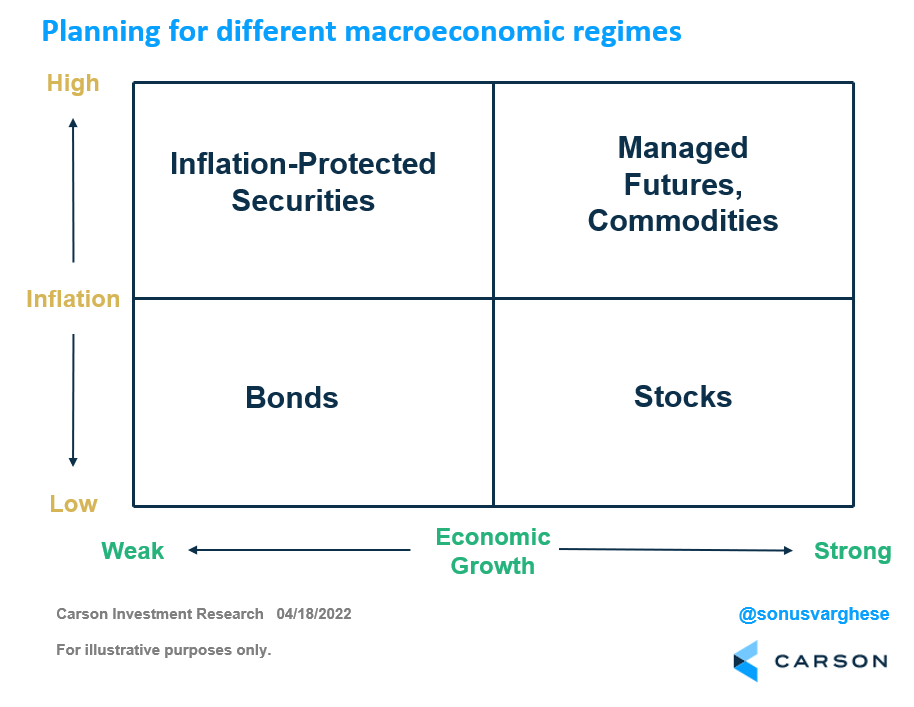
The chart below shows how we think of allocating among asset classes depending on the macroeconomic regime. Right now, we believe the positive outlook for profit growth amid a strong economy makes the case for overweighting equities, and underweighting bonds – amid a high economic growth environment. At the same time, a high-capacity economy that is likely to see inflationary pressures from time to time makes the case for diversifying away from bonds and into asset classes like managed future. Managed futures are a trend-following strategy that can take long or short positions in commodities, interest rates, equities, and currencies, and can provide valuable diversification to stocks and bonds. Periods of rising inflation, and rising rate expectations, can put pressure on both stocks and bonds, increasing the importance of some diversification outside these two traditional asset classes.
Food for thought: A big piece of the productivity story is the potential for AI to provide an additional boost, even if not right away, and to that end technology companies are likely to play a big role in the future. Ryan Detrick, Chief Market Strategist, and I chatted with Dan Ives, Managing Director, Equity Research at Wedbush Securities, about that on our latest episode of Facts vs Feelings.
