
The Bureau of Economic Analysis just reported that the U.S. economy expanded by only 1.1% in the first quarter. By the way, that’s an annualized rate – the actual quarter-over-quarter increase is just under 0.3%. This was well below expectations for 1.9% growth.
More fodder for recession calls?
Short answer, no.
Stay on Top of Market Trends
The Carson Investment Research newsletter offers up-to-date market news, analysis and insights. Subscribe today!
"*" indicates required fields
GDP can basically be broken down into 5 components:
- Personal consumption (68% of GDP)
- Business Investment (13%)
- Residential investment, i.e. housing (4%)
- Government spending and investment (18%)
- Net exports, i.e. exports minus imports (-3%)
- Change in private inventories
The last two components are extremely volatile and can create significant volatility in the headline data. Note that net exports are “-3%” of GDP because the US exports less than it imports, and so “net exports” is negative.
Here’s how the various components contributed to the headline number in Q4 2022 and Q1 2023. The last two columns show the pace at which they increased (or decreased). As you can see, change in private inventories pulled GDP growth down by a whopping 2.3%-points in Q1.
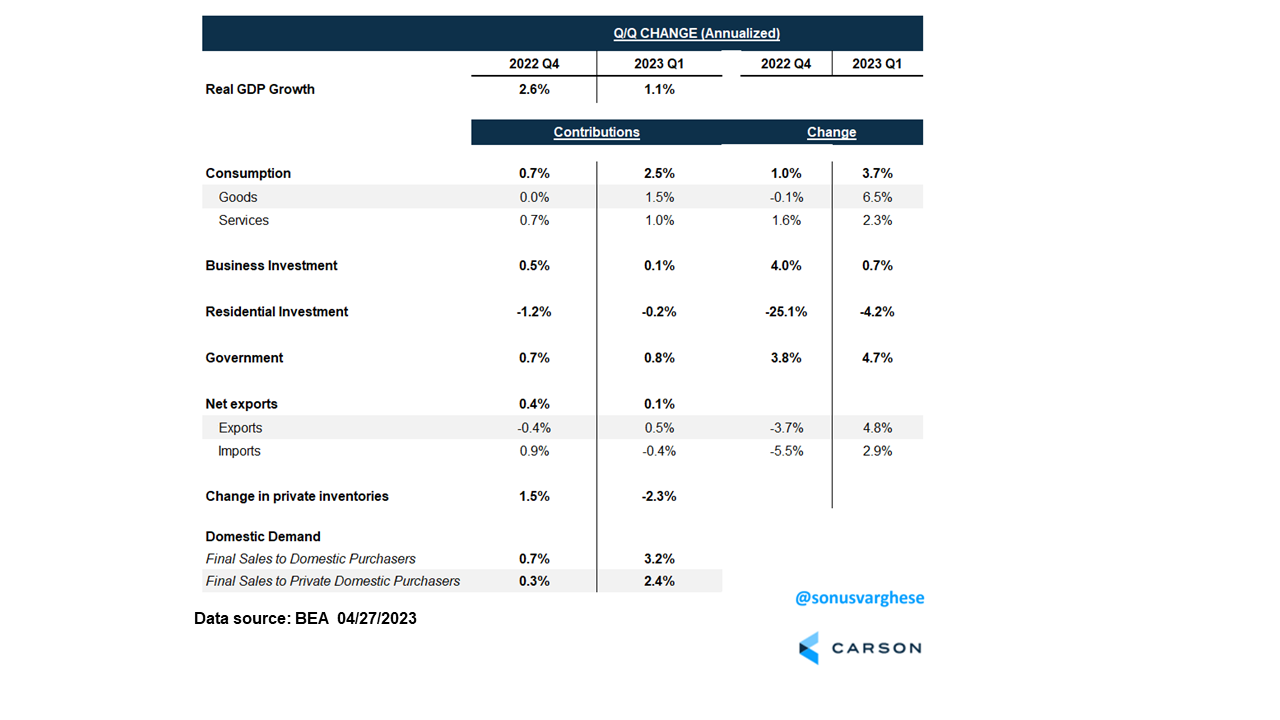
Private inventories are the physical volume of inventories businesses maintain to support their production/distribution activities. Private inventories were actually more or less unchanged in the first quarter. But private inventories increased significantly in Q4, and so “change in private inventories” showed up as a massive drag on GDP. Yeah, if you’re confused, don’t worry about it.
The good news is that we have a measure of economic growth that excludes this, which is shown in the last couple of lines of the previous table. Ultimately, when thinking about economic growth, we want to look at domestic demand, a good measure is “Real final sales to domestic purchasers”, which is simply the sum of the contributions from the top 4 components. And we can calculate private sector demand by excluding government.
There was no “slowdown”
Domestic demand rose by 3.2% in Q1. That’s the fastest pace of growth since the second quarter of 2021. By the way, the average over the last decade (2010 – 2019) was 2.3%.
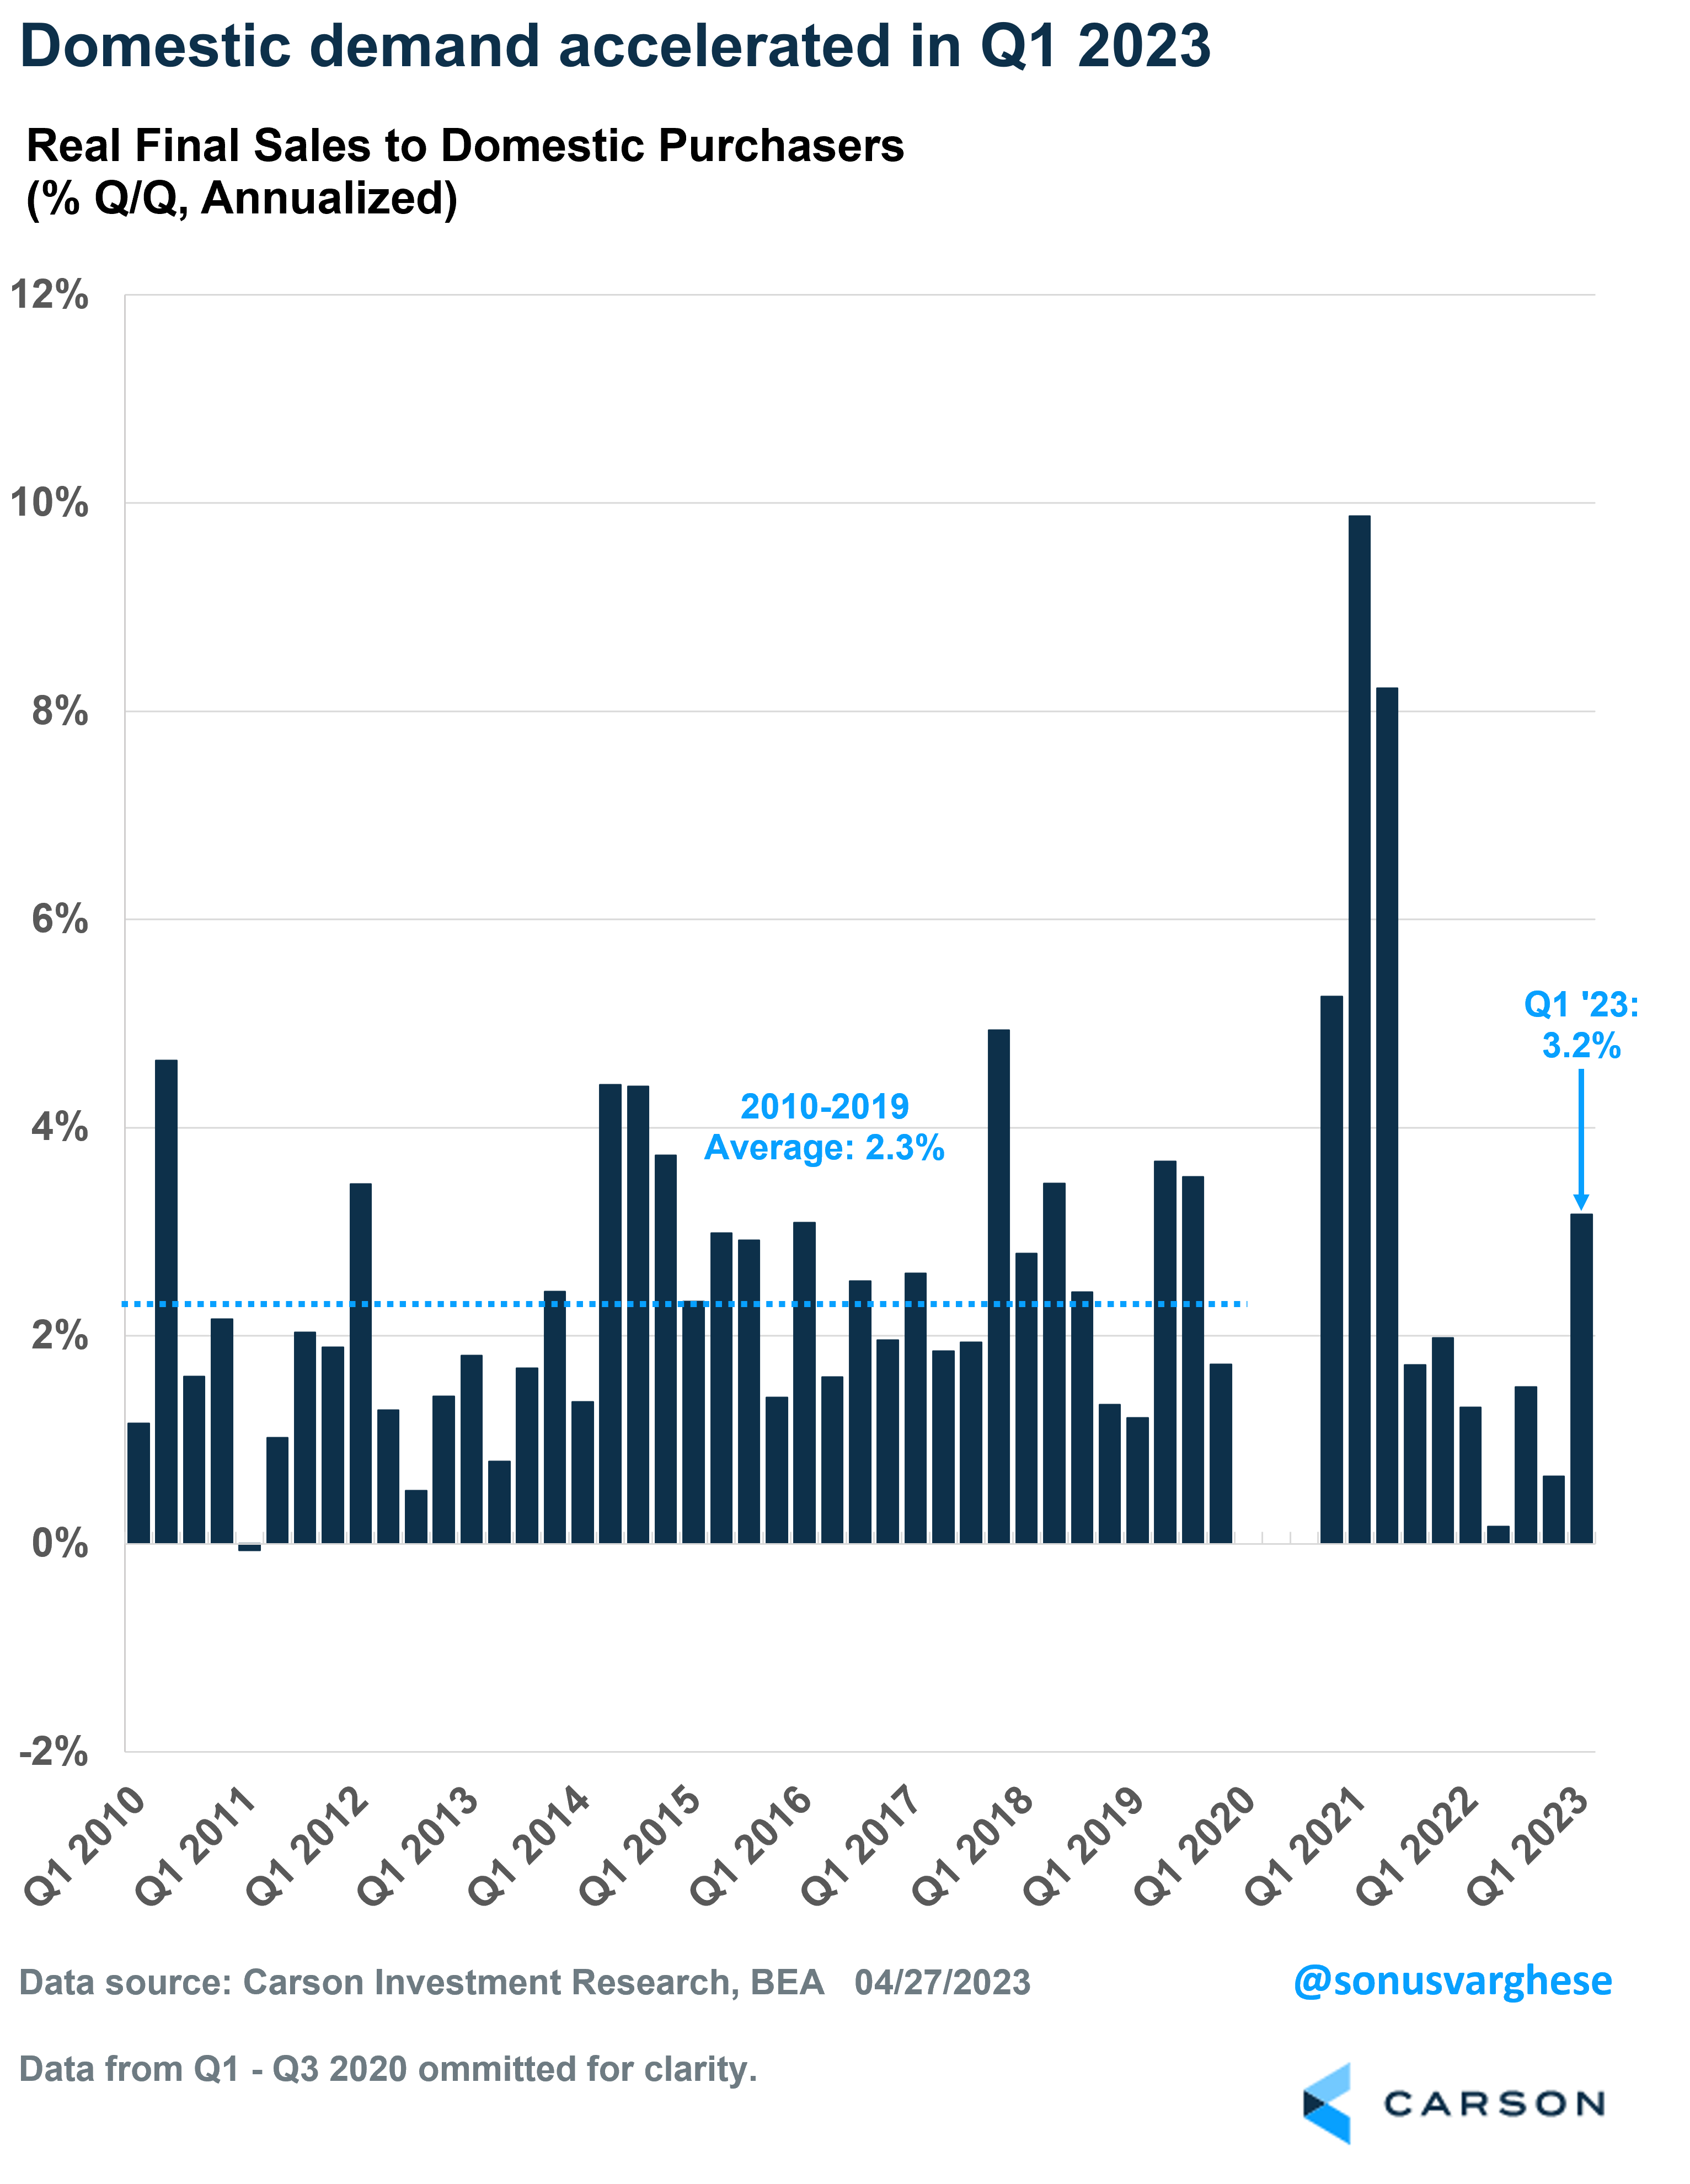
By the way, this wasn’t boosted only by government, though we shouldn’t really ignore the government sector because it makes up close to a fifth of the economy.
Private sector demand rose 2.9% in Q1, which is the fastest pace we saw since the second quarter of 2021.
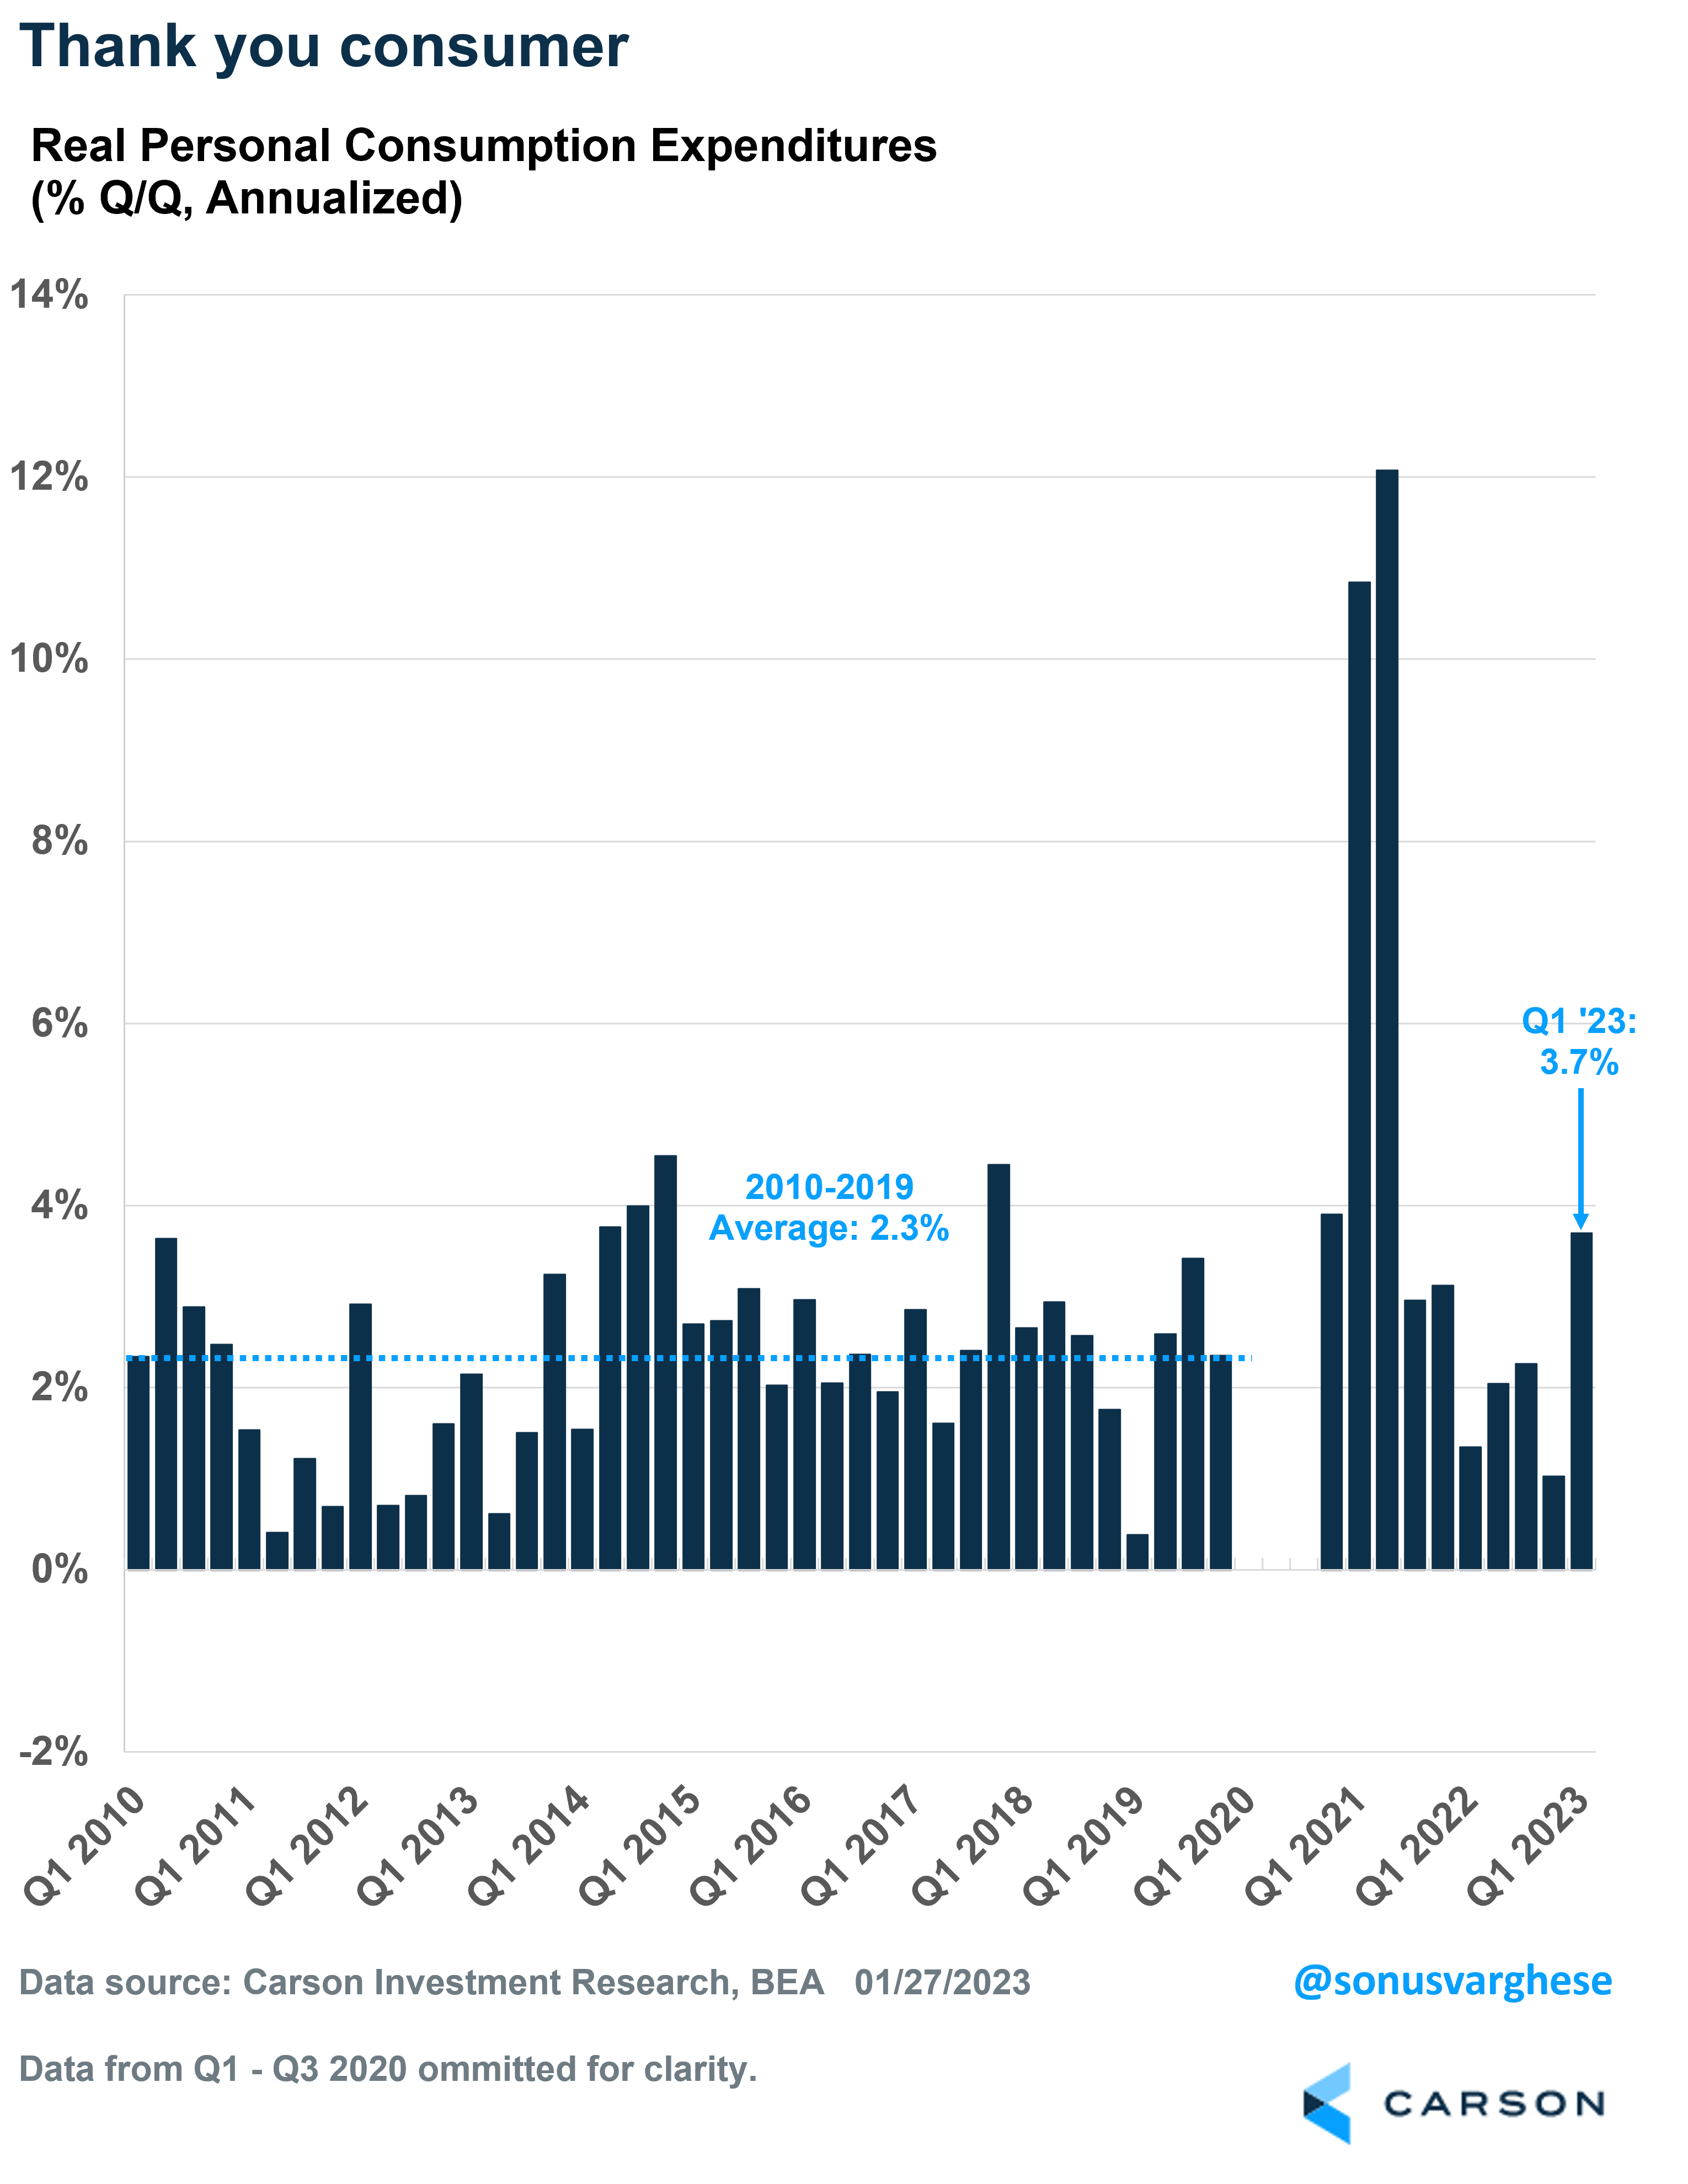
Consumers powering the economy
As you may have noticed from the GDP contribution table, domestic demand was boosted by personal consumption, which surged at a 3.7% pace. A lot of this came from a rebound in goods consumption, mostly thanks to increased vehicle purchases. But even services spending, which makes up 45% of the economy, rose 2.3%.
For perspective on the consumption numbers from Q1, the pace of growth was a lot faster than the average pace of 2.3% we experienced during the last decade, and the fastest since Q2 2021. Though back in early 2021, consumption was boosted by stimulus checks.
What’s driving strong consumption now? Two things:
- Strong employment
- Lower inflation, especially gas and food prices, which is boosting real incomes, i.e. incomes adjusted for inflation
What next?
Of course, all the above data is for the last quarter and we’re already a month into the second quarter. It’s hard to imagine consumption, and domestic demand, growing at the torrid pace of Q1. However, if you’re predicting a recession, then the onus is to explain what leads to a crash in employment, and/or raises inflation going forward.
On the employment front, the latest news is good. Initial claims for unemployment benefits dropped last week, from 246,000 to 230,000. This means fewer workers were laid off and filing for benefits. Even continuing claims, which represents the total number of people who are continuing to receive unemployment benefits, were unchanged at about 1.86 million.
Beyond the actual numbers, what really matters is the trend. And to that end, we’re not seeing a pickup in initial or continuing claims. In fact, the current levels are in line with what we saw just before the pandemic hit, when the employment situation was strong. Of course, with job growth already hitting 1 million plus in the first quarter, and the unemployment rate close to 50+ year lows, I think its safe to say we currently have a strong labor market.
Another potential positive going forward: housing. Residential investment has dragged on GDP growth for 8 straight quarters now. But as we wrote about last week, we see relief coming from this sector of the economy. Which would be more than welcome.
Of course, we’ll continue to track the data, including inflation and payrolls. Those will tell us a lot about how things are looking in Q2, and just as important, what that means for monetary policy.
The other side of strong domestic demand is that It’s hard to imagine Fed officials looking at these numbers and thinking “the job is done, and now we can cut rates”. But we’ll see.
