“It isn’t about good or bad, it is about better or worse.” Burt White, Carson Group’s CEO
The headlines remain volatile, but there are some clues that the worst could be over for the sell-off around the war in Iran.
Since the war started I’ve been asked many times what I wanted to see for clues the worst may be over and I always gave the same answer: We need the S&P 500 to get back above its 200-day moving average and we needed to see some late week buying. Let’s look at those two things first.
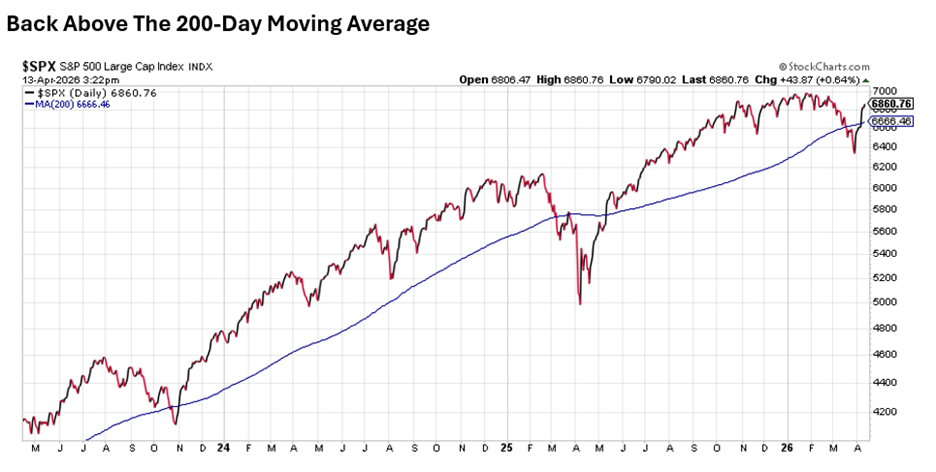
The 200-Day
I like to use the 200-day moving average as a longer-term gauge for whether things are in a bullish or bearish trend. The way I learned it many years ago was that bad things happen beneath the 200-day moving average. Markets rarely (if ever) crash when they’re at all-time highs—the worst days usually happen when the market is already oversold and beneath the 200-day. Well, after 13 days beneath this longer-term trendline, the S&P 500 has popped back above it, a clear sign of improvement.
Thursday and Friday
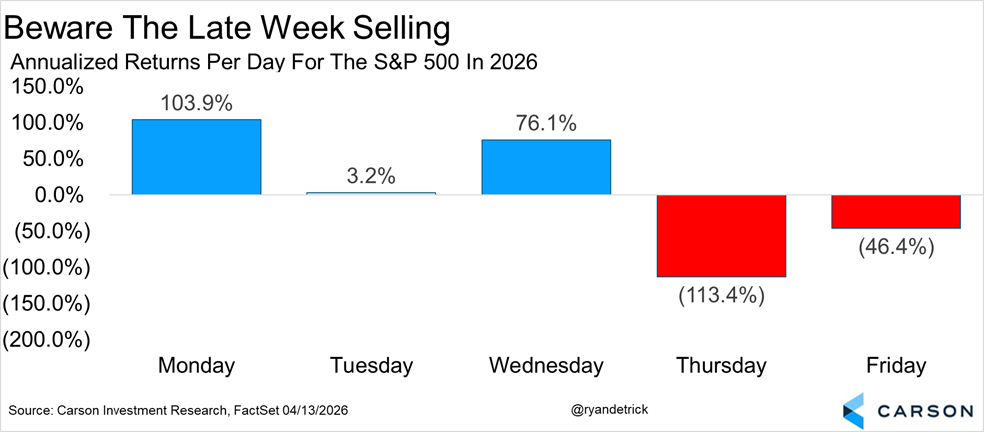
The other thing I’ve wanted to see is some late week buying. Think about it, if the bulls are in charge, then strength late in the week is normal. But if the bears are in charge, then heavy selling ahead of the weekend is what we see, as no one wants to hold over the weekend for fear of bad news. I’ll never forget COVID and how volatile Fridays were in March 2020. That’s an extreme example, but it’s been seared into my brain. Compare that to the past few years where Friday has been very strong, consistent with a bull market.
Incredibly, the last time both Thursday and Friday were higher during the same week was the third week of January, nearly three months ago! Here’s a nice breakdown of how each day of the week has done this year on an annualized basis. Should we start to see some late week confidence (which we haven’t seen yet), that would be another reason to think the worst could be behind us.
So that is what I wanted to see for clues the lows are in, but here are some things we have already seen that make me optimistic we’ve already hit bottom.
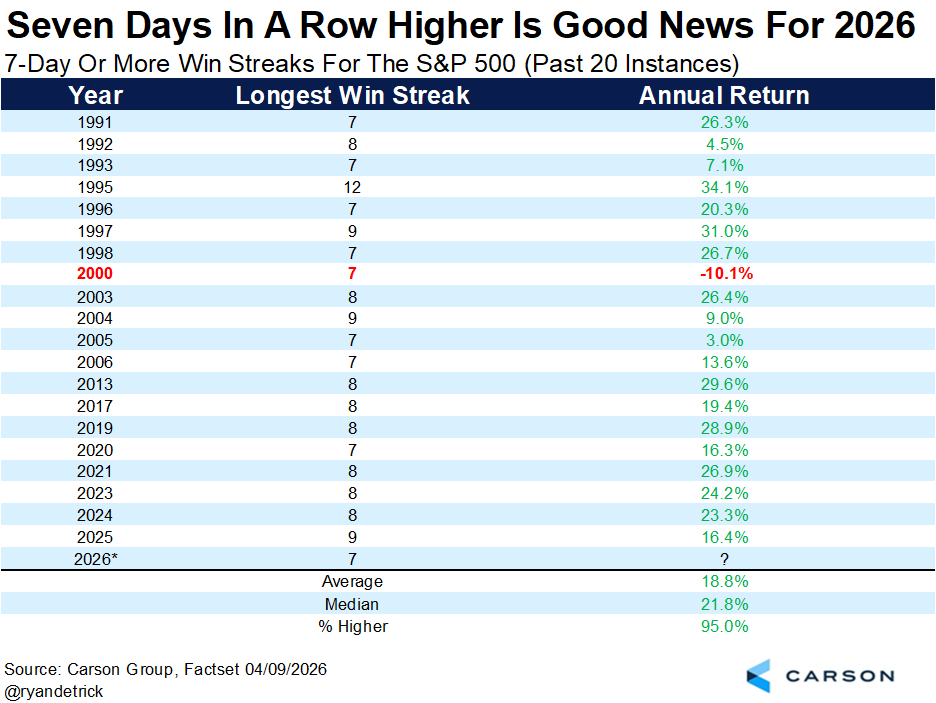
The Seven-Day Win Streak
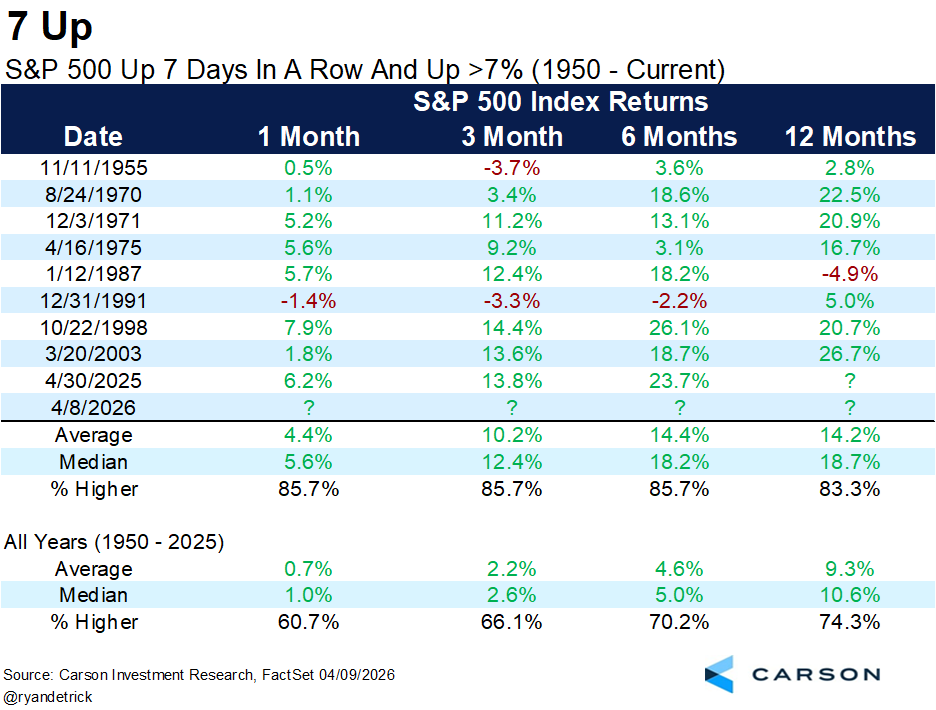
The S&P 500 recently was up an incredible seven days in a row, and it also gained more than 7% during that win streak. Plain and simple, these types of buying thrusts are often clues the trend has indeed changed and higher prices are coming and rarely just a teaser bear market rally.
The future returns have been extremely strong across the board when we’ve seen seven-day win streaks up more than 7%, but what really stands out to me is the average 10% gain just three months later. Going back 30 years, we’ve seen this happen only three other times and a gain of nearly 19% six months later was the worst follow-up out of the three. Not bad.
Building on the recent seven-day win streak, years that have one have been higher 19 of the past 20 time (only 2000 was lower) with an average annual gain of 18.8%, another clue 2026 might not be that bad when all is said and done.
Stay on Top of Market Trends
The Carson Investment Research newsletter offers up-to-date market news, analysis and insights. Subscribe today!
"*" indicates required fields
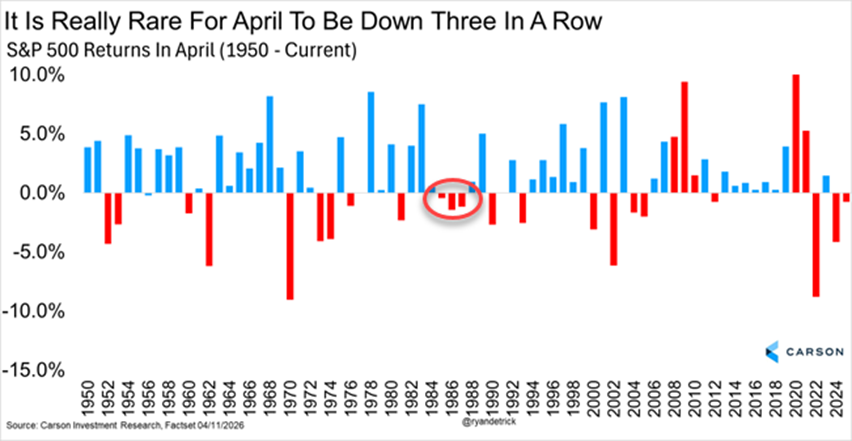
April Is Rarely Down Three in a Row
No, we don’t think you should ever blindly invest in seasonality, but it is worth noting that stocks were lower in April each of the past two years and only once in history (the mid-1980s) did it fall three years in a row. April is off to a roaring start, but there is clearly still more time.
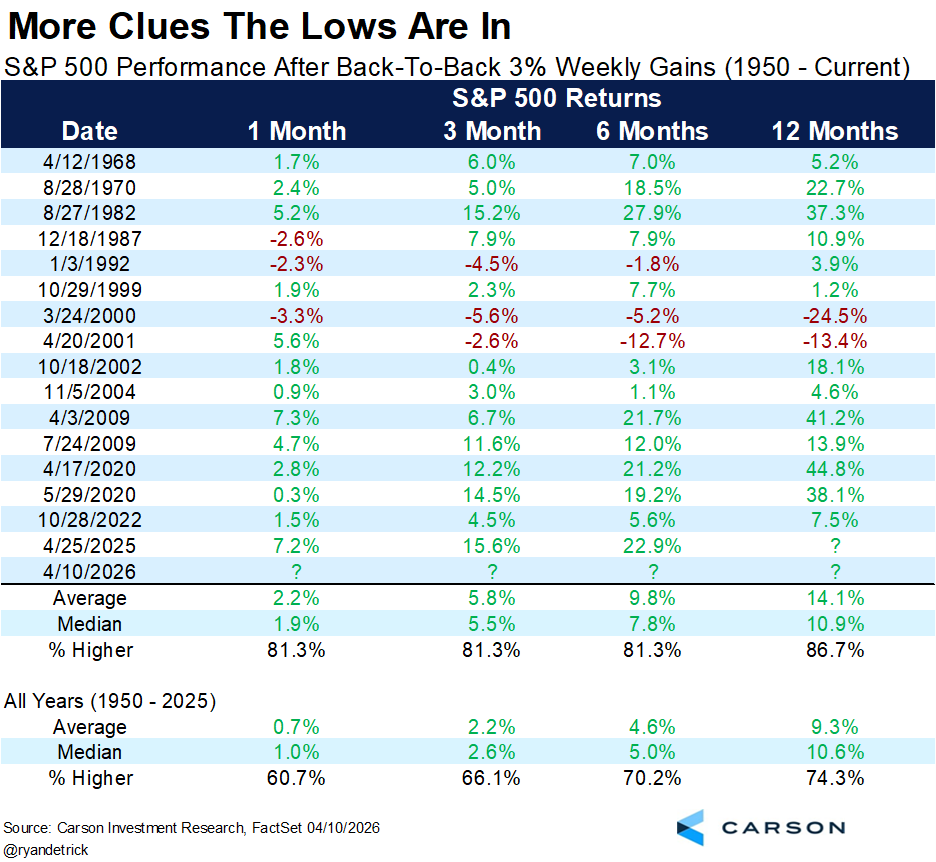
Two Big Weeks in a Row
Another clue the lows may be in is the S&P 500 just gained more than 3% on consecutive weeks for the first time since 2022. One year later stocks were higher 12 out of 14 years, with only the tech bubble of the early 2000s lower. In fact, the last seven times this happened (going back to the October 2002 lows) the S&P was always higher one, three, six, and twelve months later.
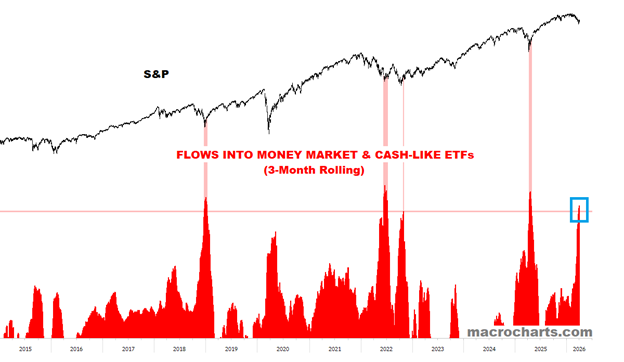
Sentiment Is Too Bearish
Even though price has started to improve, there is still plenty of negativity out there, which from a contrarian point of view could continue to push things higher.
This chart from MacroCharts shows that the move into cash and cash-like ETFs is at levels consistent with previous bear markets and 100-year pandemics. With any good news at all, we could be due for a big rally. Or as Burt likes to say in the quote at the top, just ‘better’ news could be all that is needed to spark a rally. Markets have a funny way of pricing in good or bad news quickly, but then you have to pay more attention to whether it’s getting better or worse.
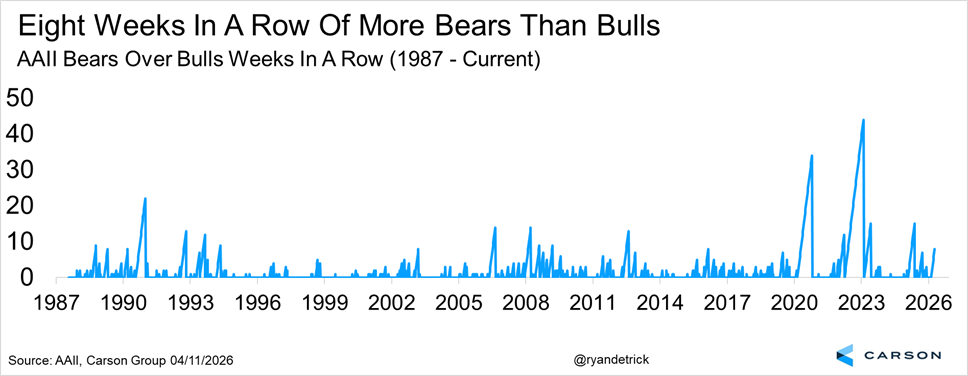
Lastly, the American Association of Individual Investors (AAII) Sentiment Poll has seen more bears than bulls for eight weeks in a row. I looked into this and found 19 other times the bears outnumbered the bulls for this long and the majority of those time stocks were down well over double digits or in outright bear markets. Well, this time the S&P 500 was only about three percent from all-time highs and you have to go back to 1993 for the last time we saw a streak of bearish sentiment like this and stocks closer to new highs.
The bottom line is we believe the lows very likely are in and a surprise move higher is probably coming. We are fully aware with the war in Iran this could always change and this is why we continue to preach staying diversified in this uncertain environment. But we still think this is a bull market and with new highs not all that far away, investors may once again be rewarded for sticking with their process and not get sucked into the headlines. Thanks for reading!
For the latest on our views on the war and markets, be sure to watch our latest Glass Half Full below.
For more content by Ryan Detrick, Chief Market Strategist click here.
8874309.1. – 14APR26A