
In our 2026 Outlook, we wrote about being in an inflationary growth environment and riding the wave of AI-related investment. Here we are six months later, and things have played out almost exactly as that. Of course, we didn’t predict the Middle East crisis and the energy price shock that followed, but inflation was a growing problem even before then. The AI-wave has only grown in strength, and technology stocks are riding higher on the back of that and pulling the overall market higher.
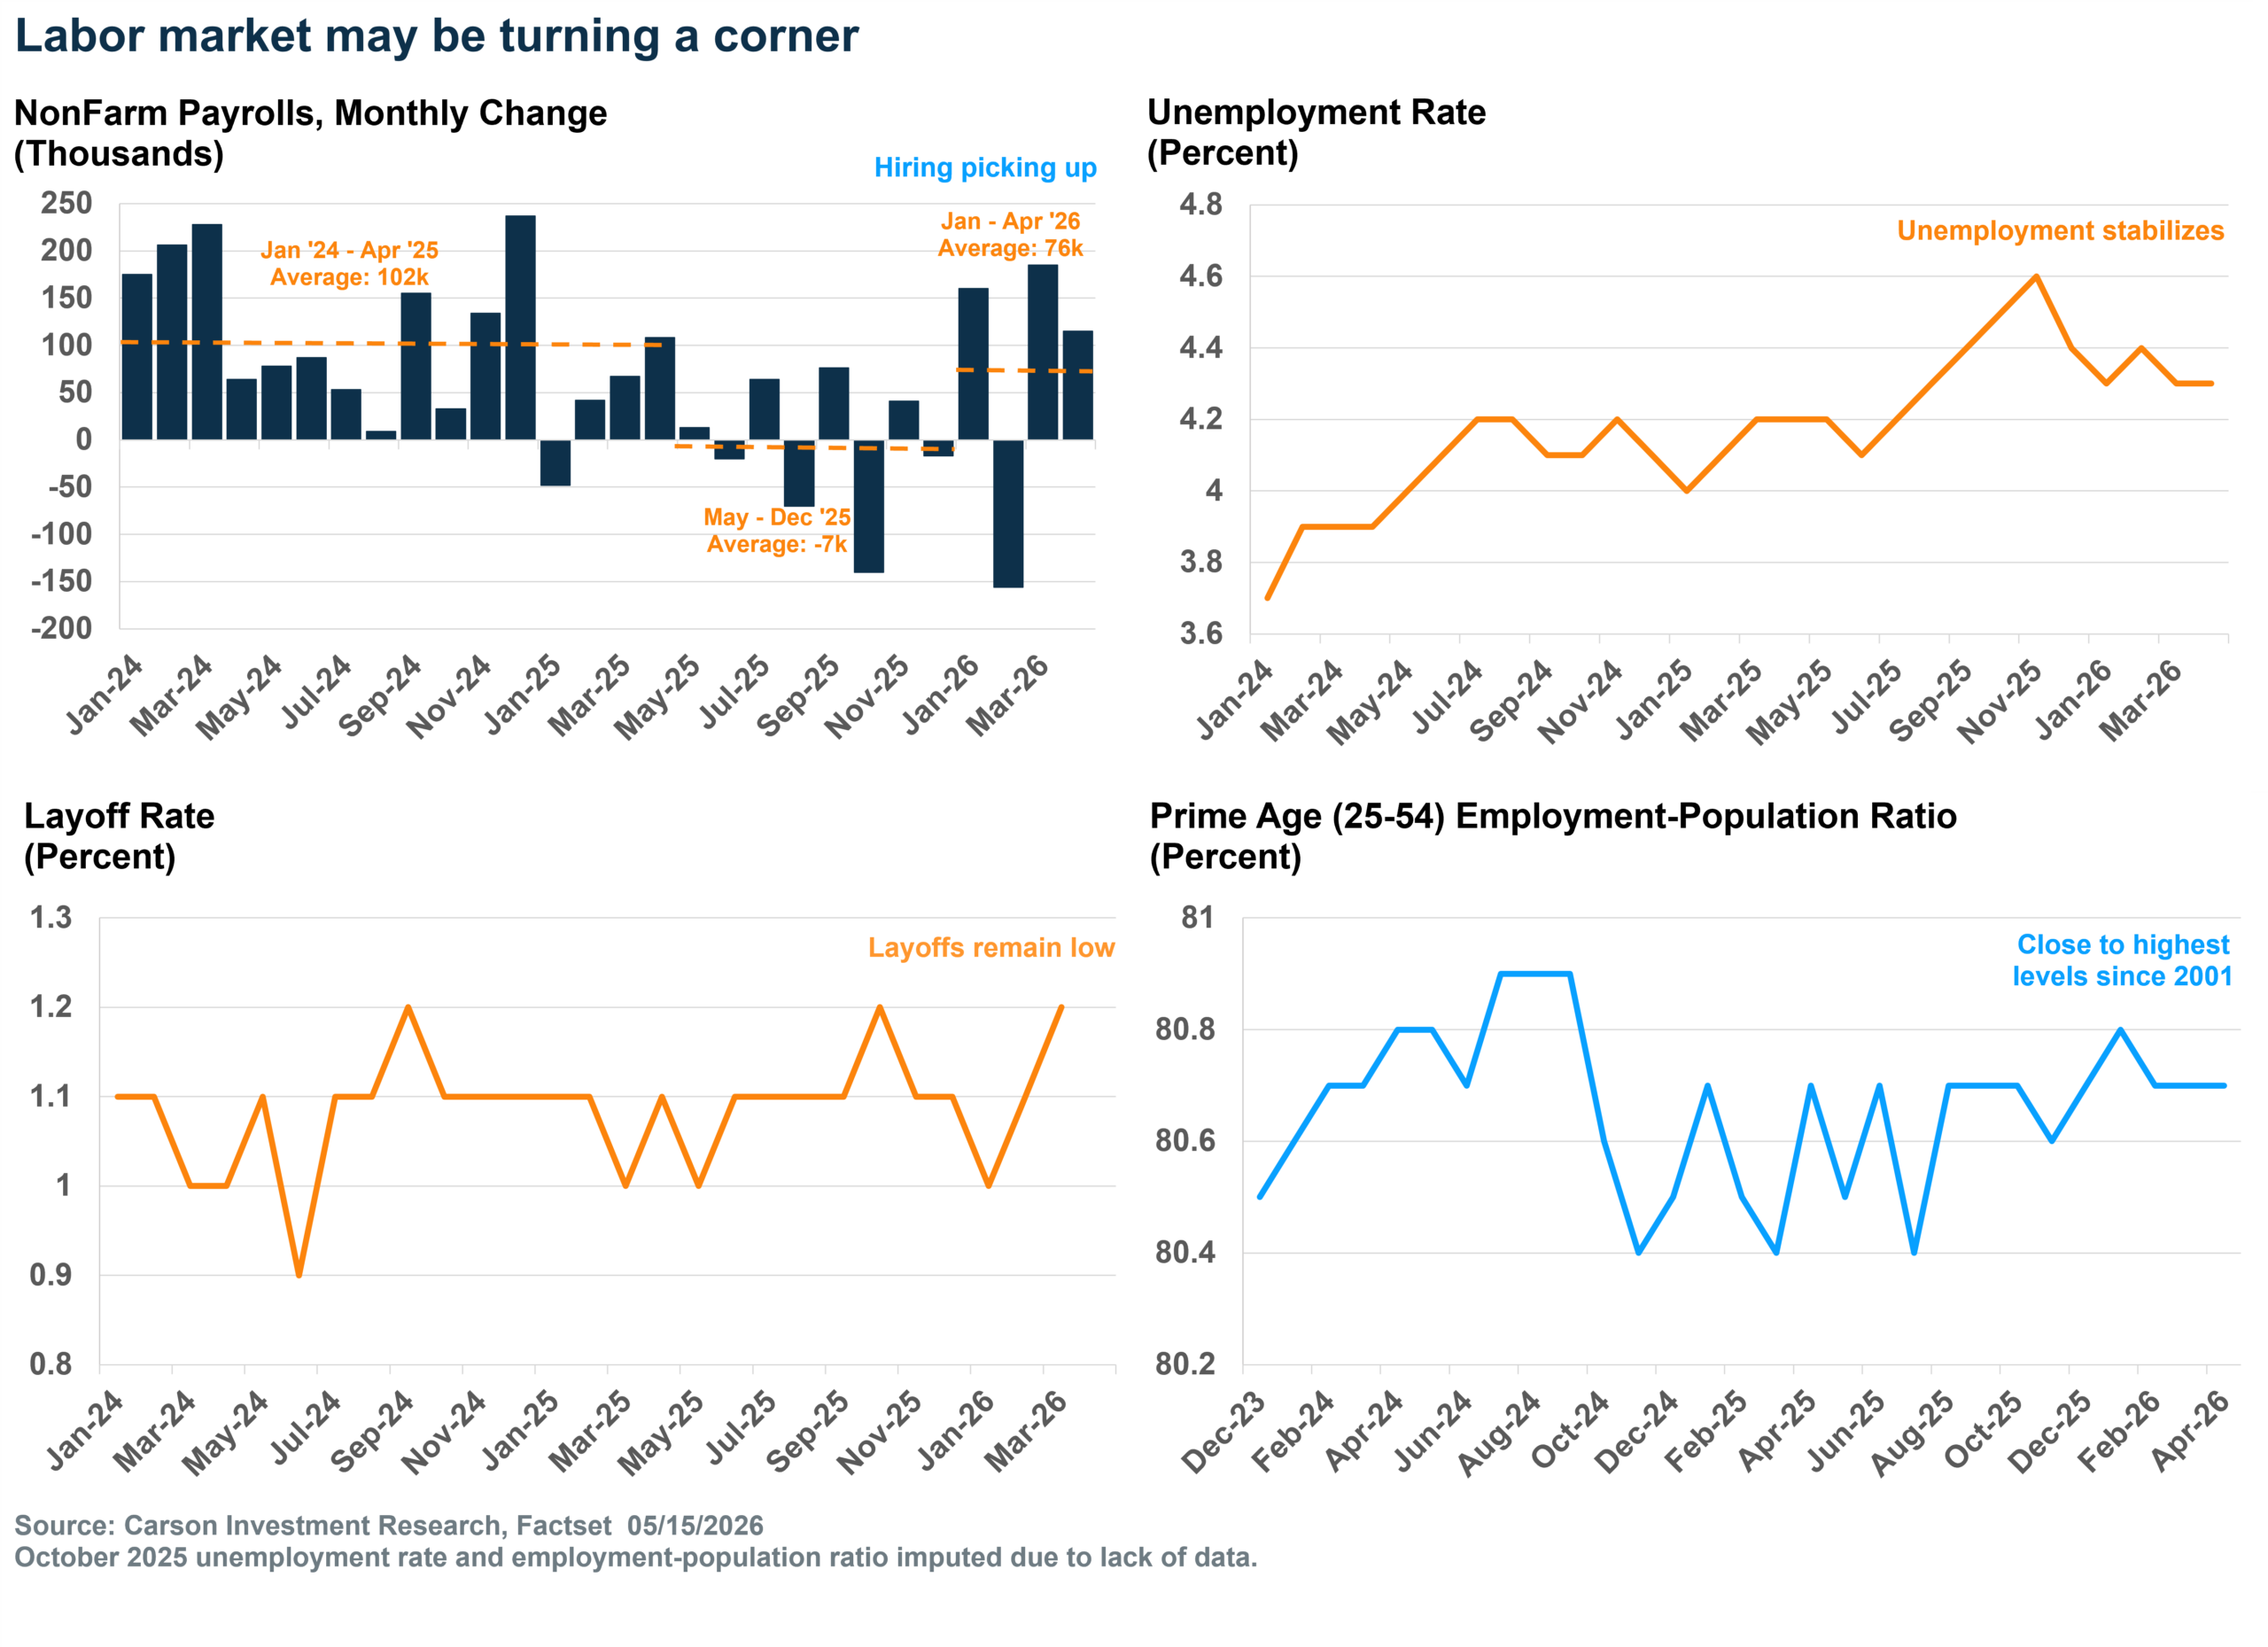
The biggest potential downside risk when we started the year was the labor market, but it looks like things have turned a corner there. After 10 months of job growth see-sawing between positive and negative prints, we finally got back-to-back months of job growth. Job growth is averaging 76,000 per month this year, a vast improvement from the -7,000 monthly average from May to December 2025. Normally, we’d say average payroll growth clocking in under 50,000 is no great shakes, but with population growth running low amidst the immigration collapse, the economy doesn’t need to create a lot of jobs to keep the unemployment rate steady. And the unemployment rate has, in fact, stayed steady at a historically low level of 4.3%. The prime-age (25-54) employment-population ratio has held steady at 80.75, higher than at any point in the 2000s or 2010s expansion. The aggregate layoff rate is also at a historical low, pushing against the narrative about layoffs at prominent large firms.
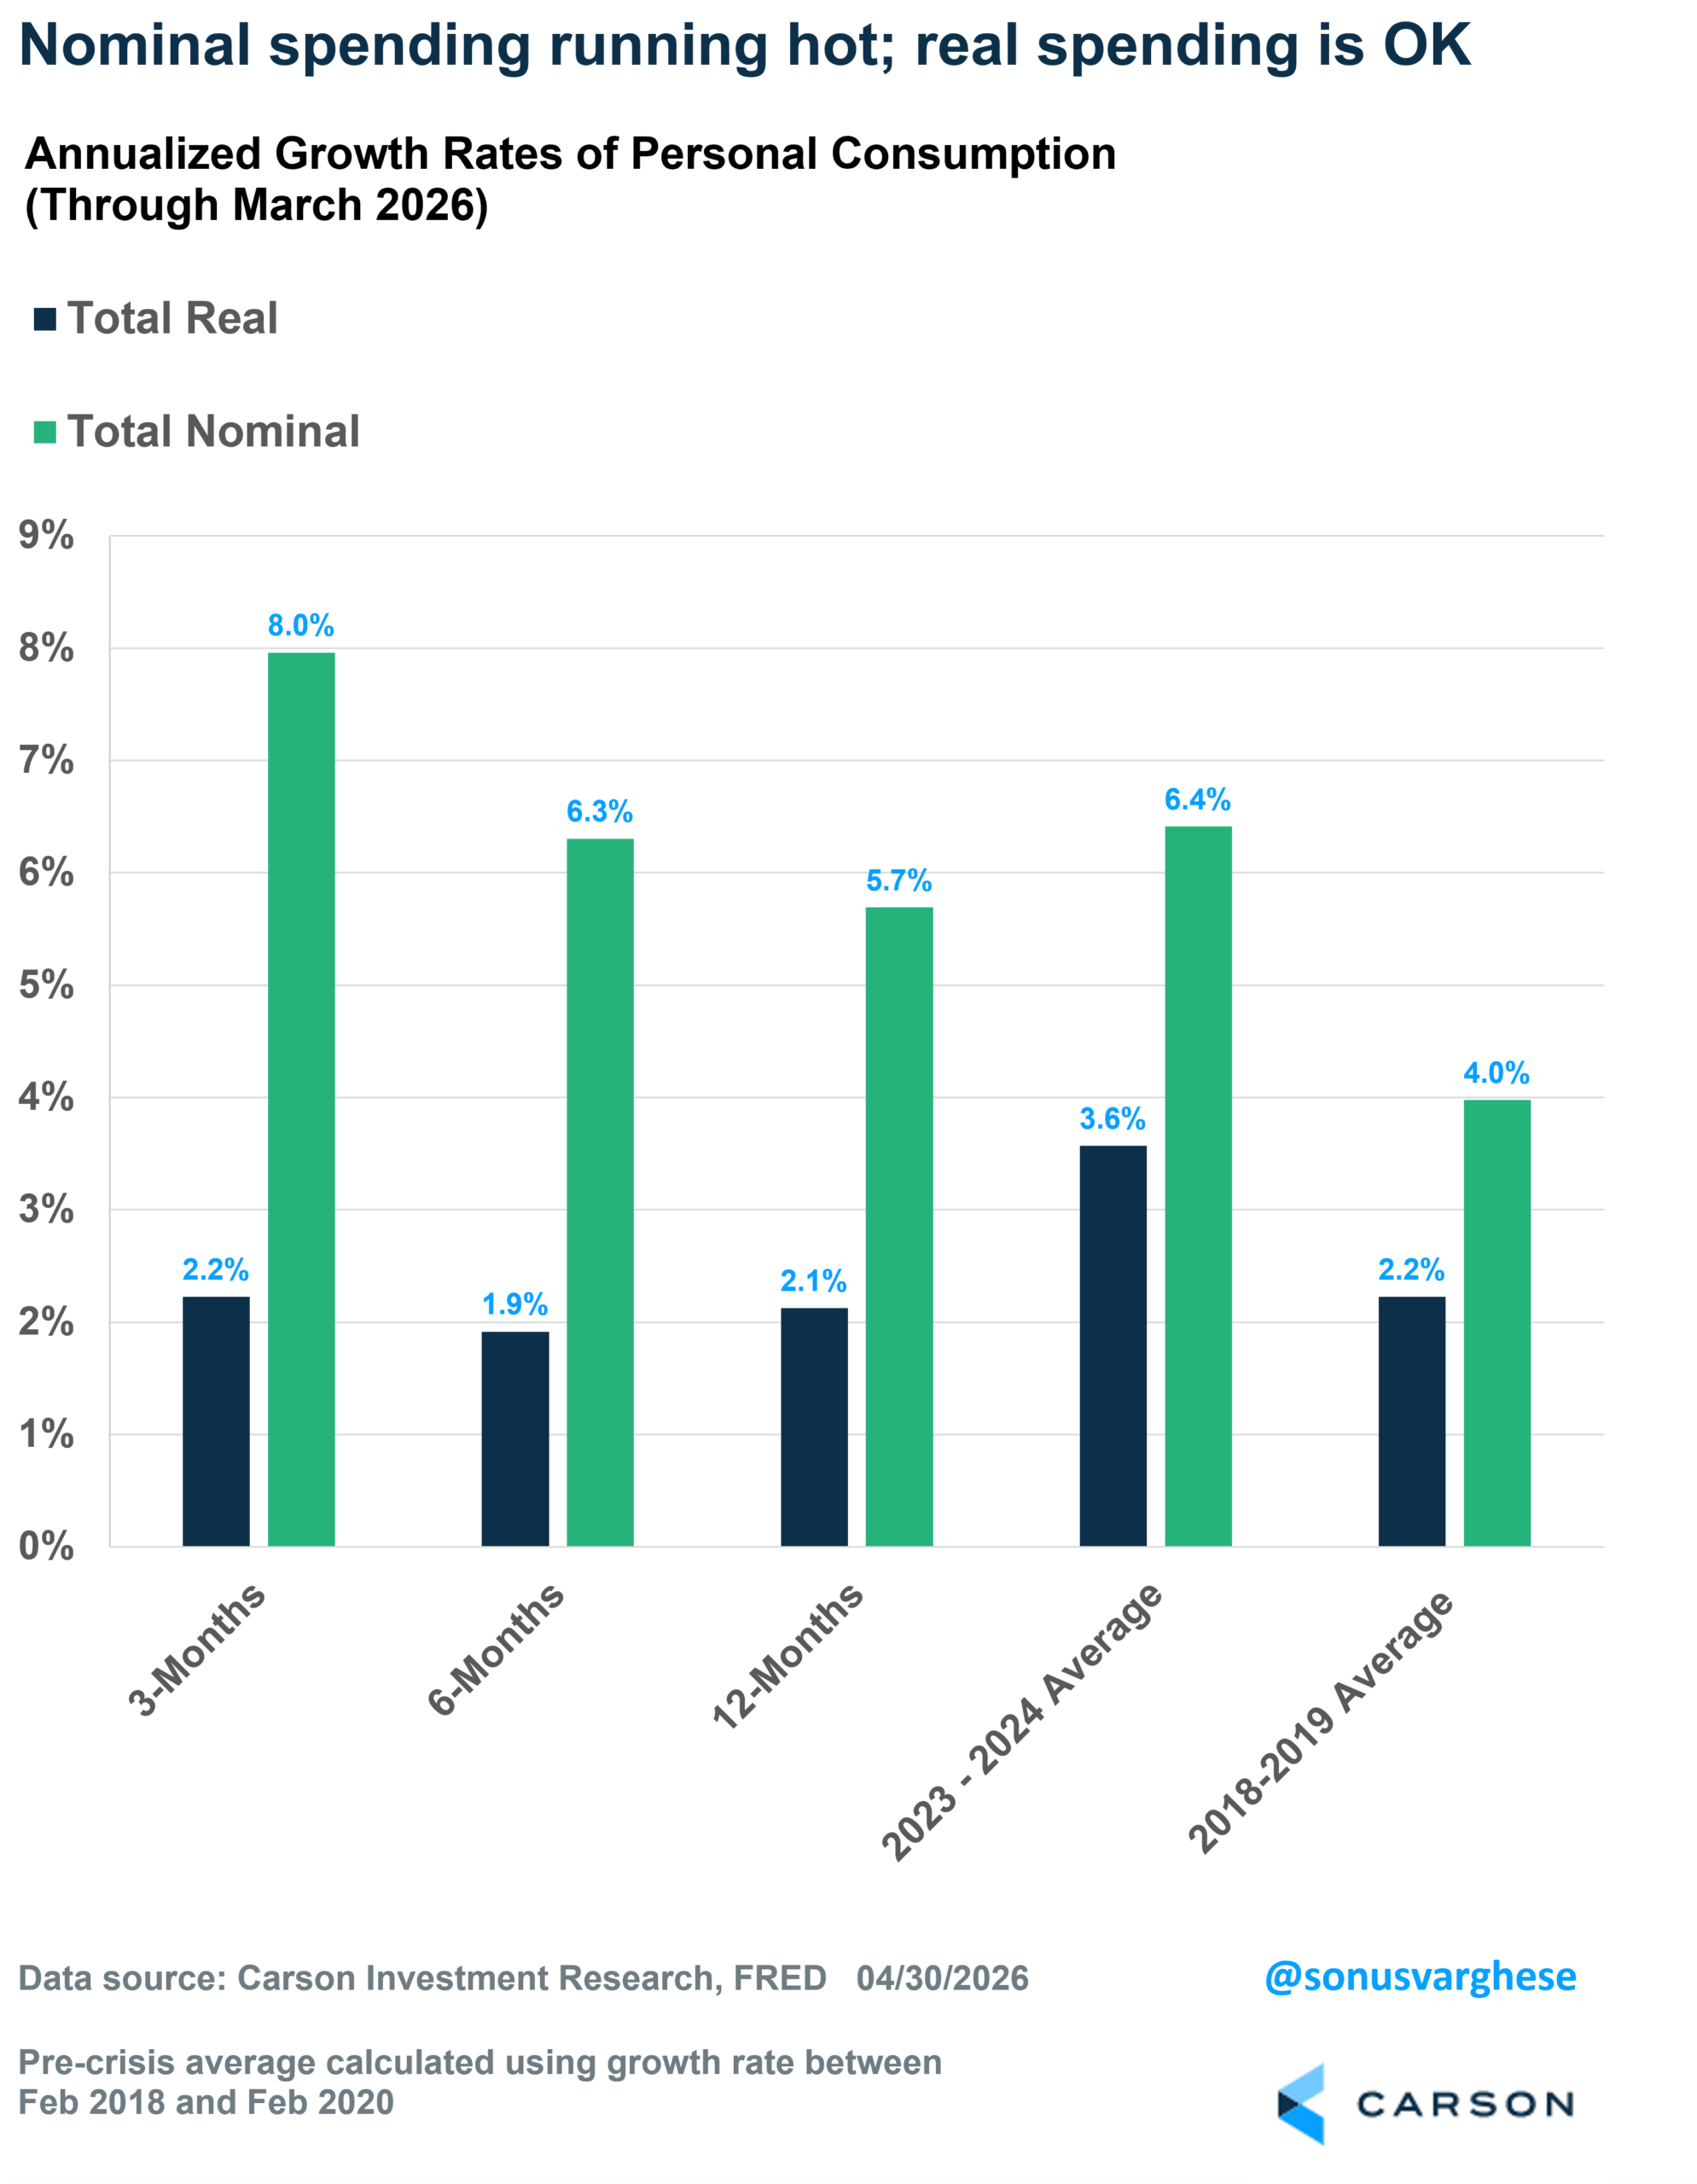
Of course, the problem is inflation, and as a result, inflation-adjusted (real) incomes aren’t growing. At the same time, nominal consumption rose at an annualized pace of 8% in the first quarter, well ahead of the 2023-2024 trend or even 2018-2019. Yet, real consumption lagged these prior trends.
Nominal consumption is running hot on the back of
- One: tax refunds from last year’s tax bill
- Two: consumers drawing down savings to keep consumption steady
The former point gets to the fact that it’s very hard to get a significant economic slowdown when the government is running deficits close to 6% of GDP. The US government is running things hot in a way that’s unprecedented this deep into an economic expansion (we’re five years from the last recession in 2020). The second point about falling savings rates is also partly due to the stock market doing as well as it is. If portfolio values are going up, and the risk of job loss is relatively low, there’s less urgency to save.
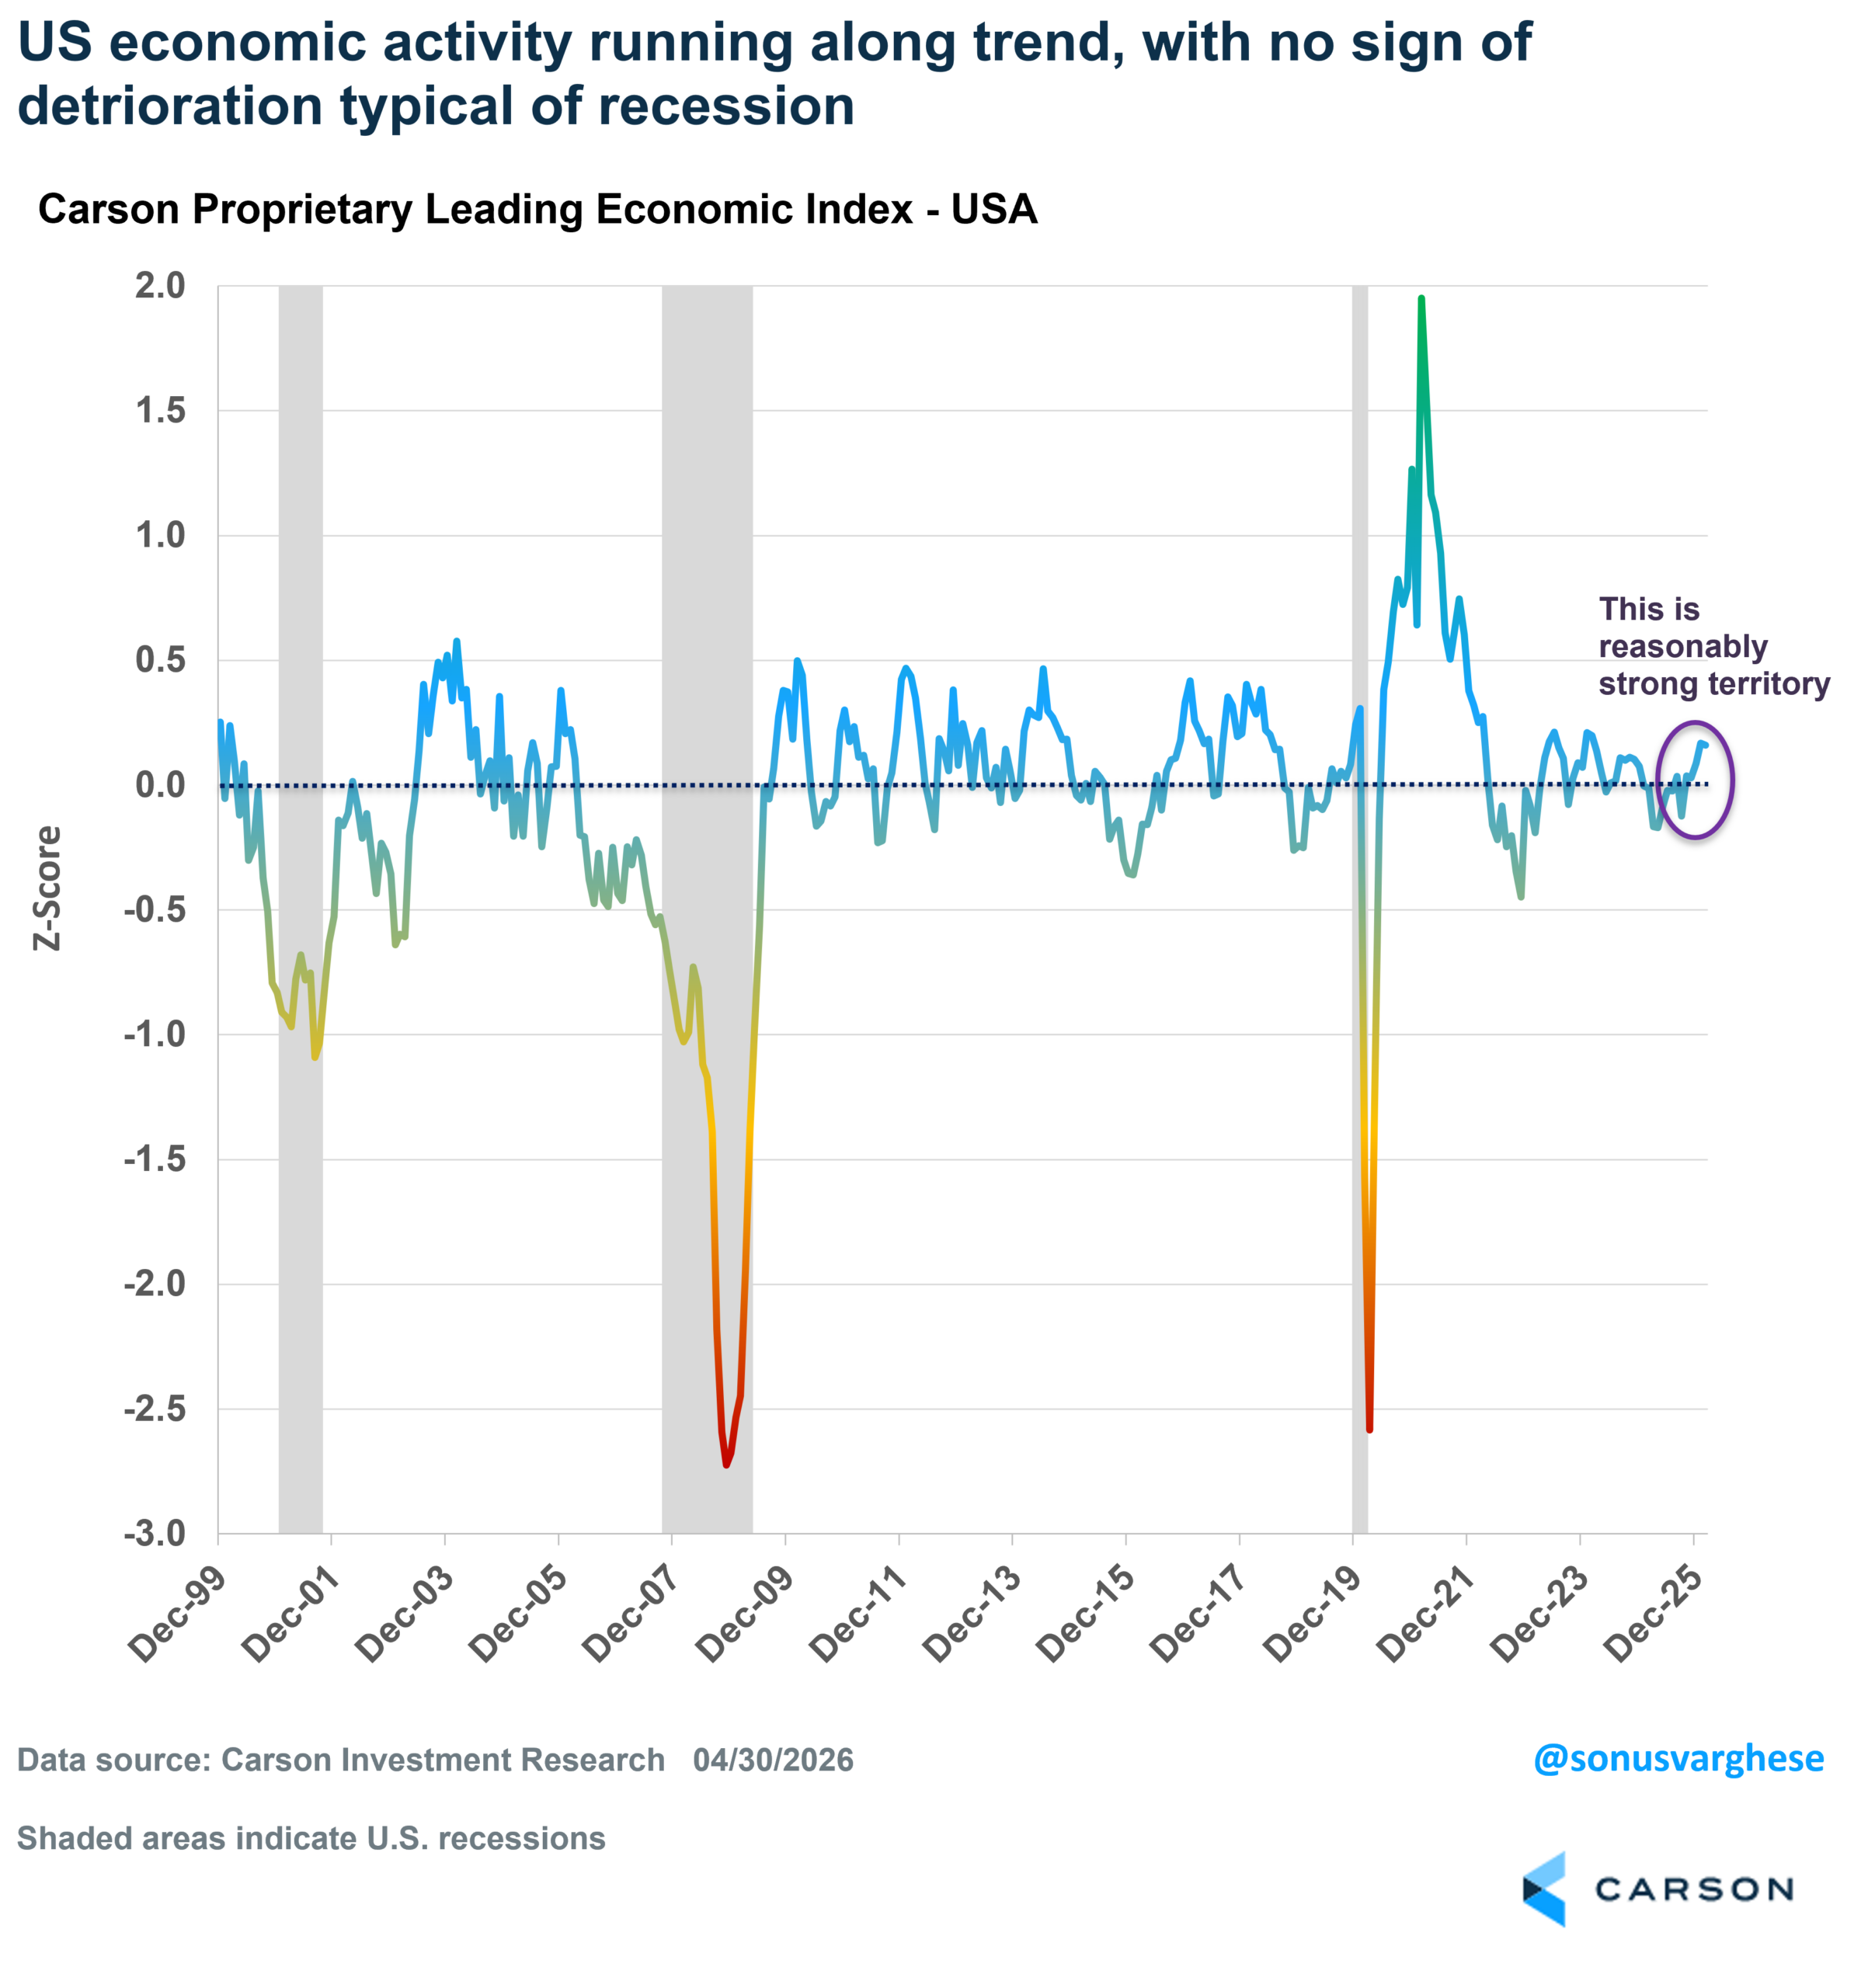
The dynamic of strong nominal growth is also captured in our proprietary leading economic index (LEI) for the US. Even during the worst of the post-Liberation Day downturn (April-May), levels were well above what we would normally associate with a recession, let alone levels we’ve historically seen in advance of a recession (like in 2000 or 2007), which is partly why we didn’t call for a recession last year. The LEI has seen a bit of an upswing this year, taking it from slightly below trend to above. This tells us nominal activity is running strong, and that’s important because nominal GDP growth is where company revenues and profits come from.
Big AI Wave Gets Bigger, Driving Profits Higher
We discussed the AI wave in our 2026 Outlook and said we believed the best approach for investors was to ride it, using an equity overweight and broad diversified exposure. Six months later, that picture hasn’t changed—if anything, it’s only strengthened. AI continues to have a big impact on the economy. When I say “impact,” I’m referring to investment spending related to AI, rather than the diffusion of AI through the economy, becoming a big boost to productivity (we’re yet to see that and probably won’t get details on that until several years from now).
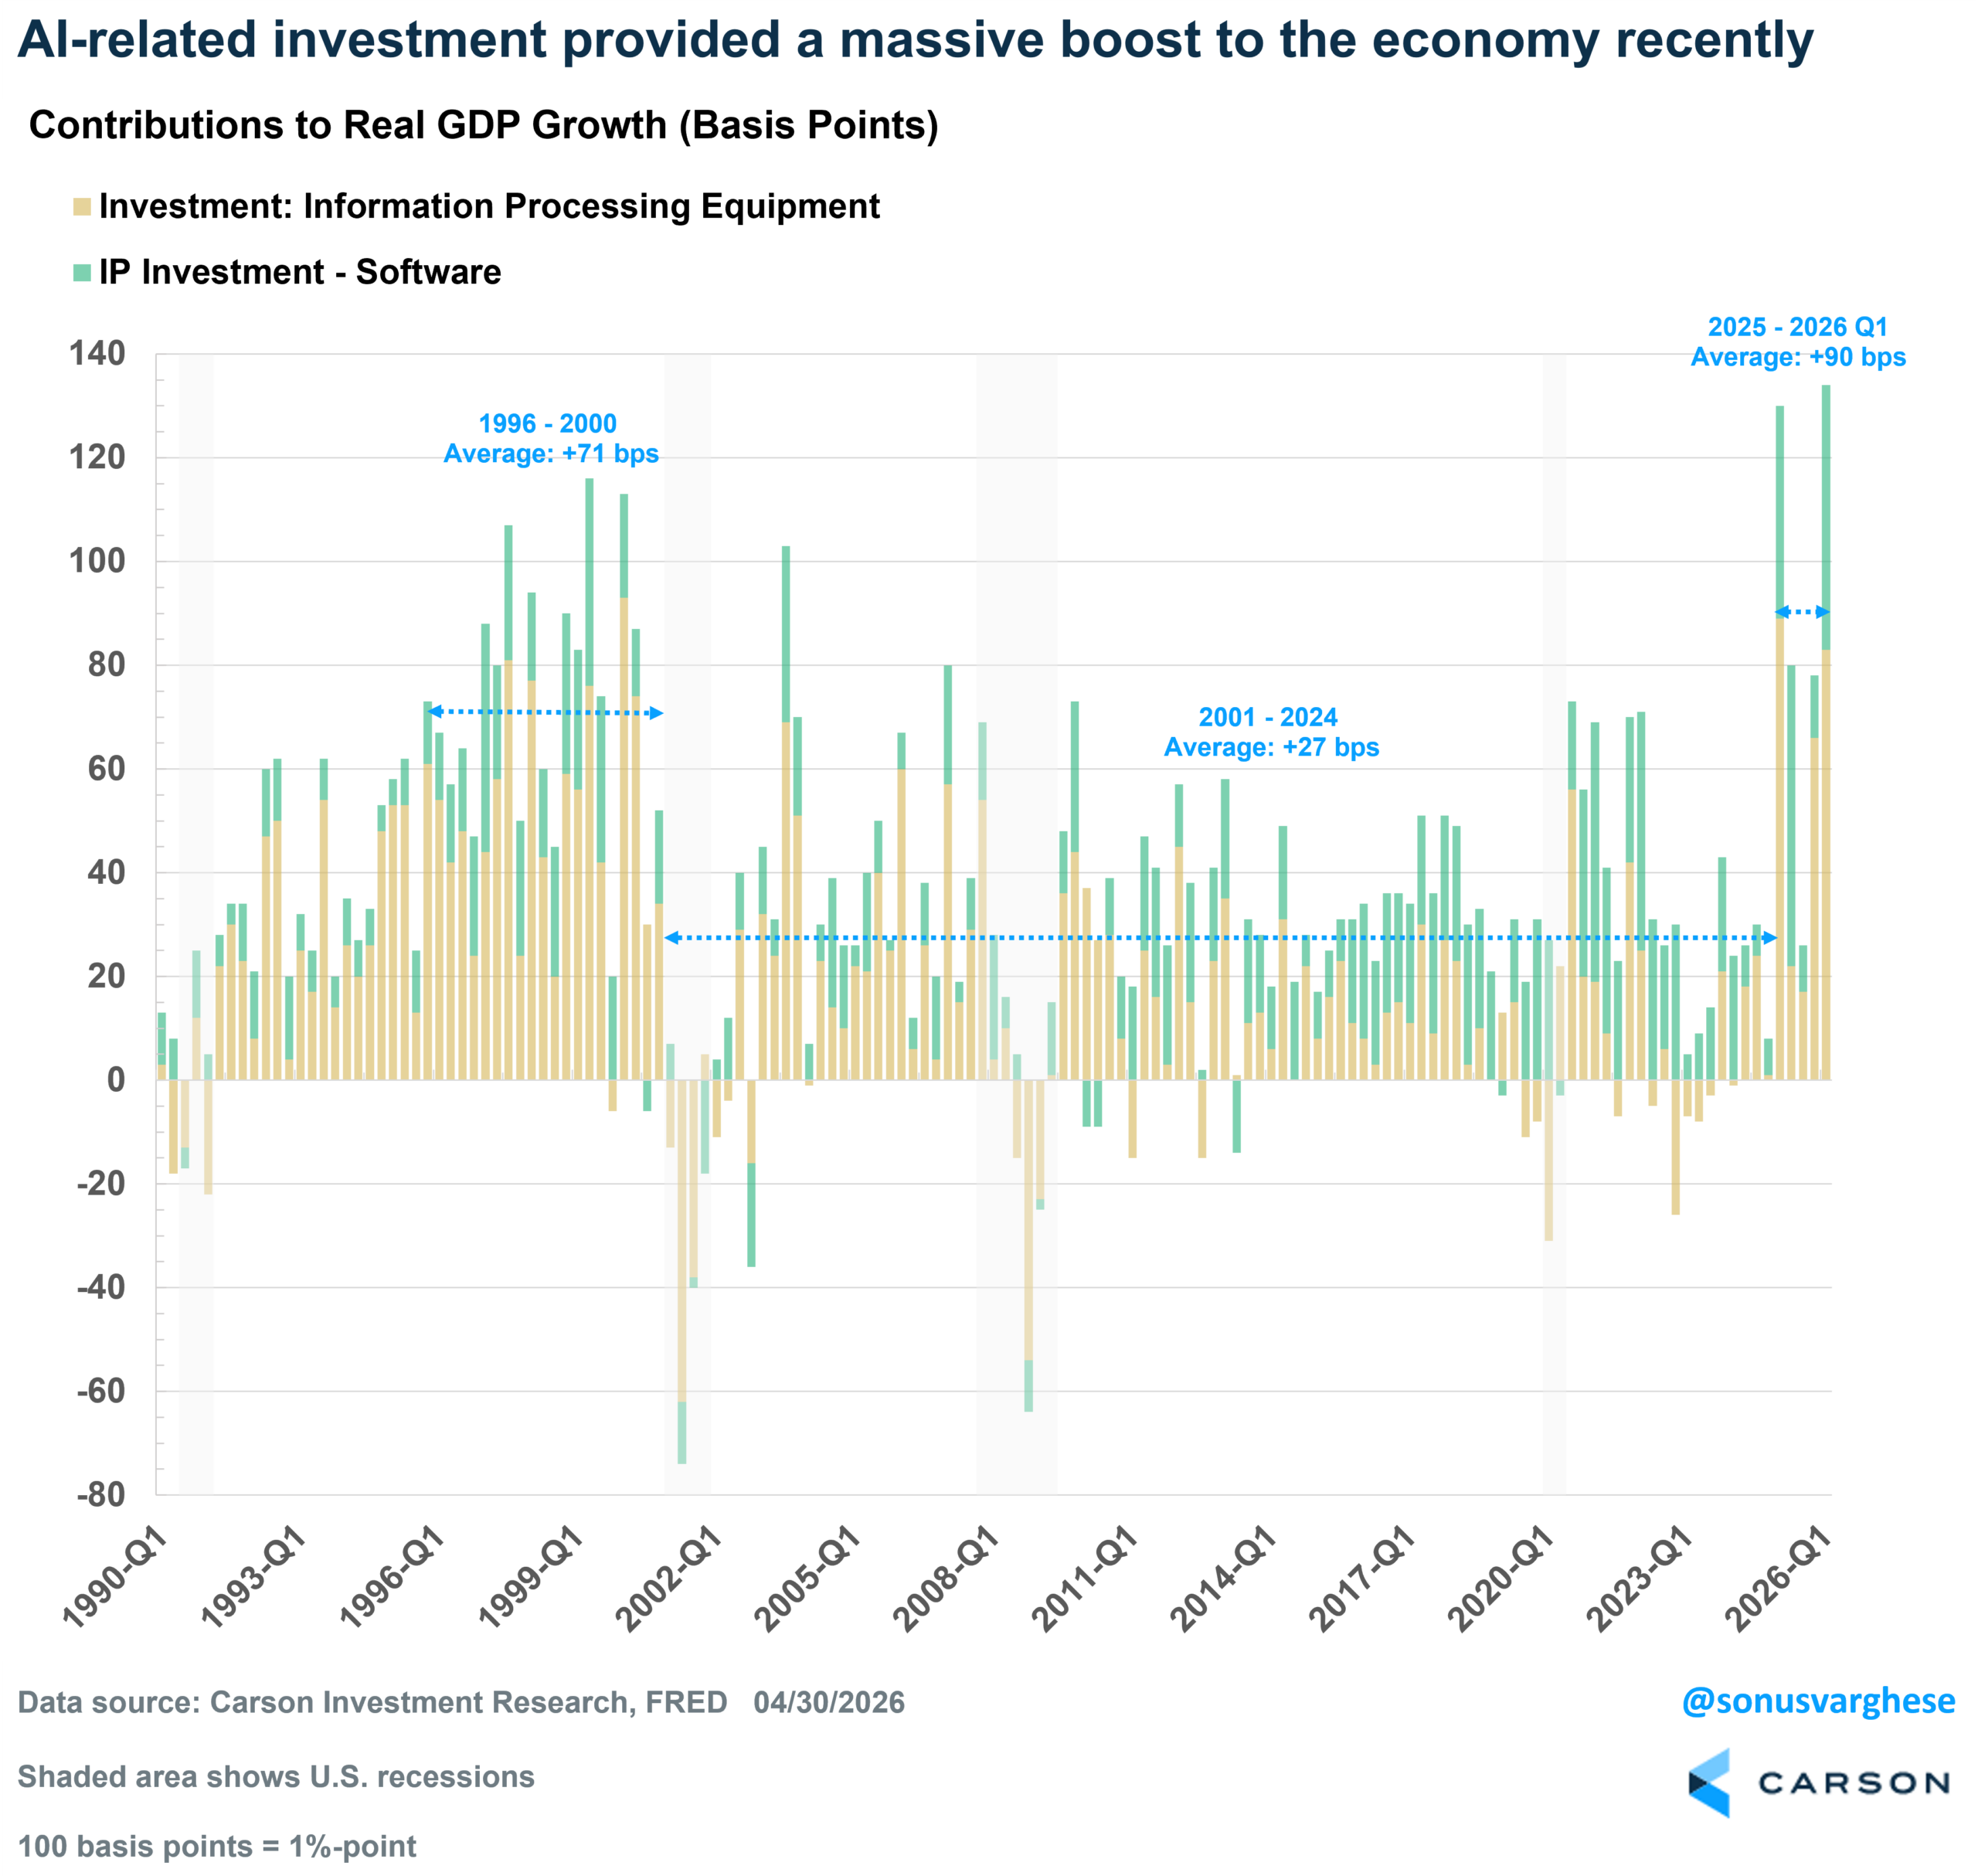
Over the last five quarters (Q1 2025 – Q1 2026), real GDP growth averaged 2.0% annualized. Real investment spending on IT equipment and software has added an average of 0.90%-points per quarter. That’s about 45% of real GDP growth, from a part of the economy that makes up under 5% of GDP. This is well above what we saw in the late 1990s, let alone the 2000s. So why isn’t real GDP growth higher? One issue is that a lot of the AI-related equipment is imported, and so doesn’t directly “contribute” to GDP in a strict sense, since only goods produced domestically contribute to GDP. But that doesn’t mean activity isn’t running hot.
Looking ahead, AI-related capex spending is set to keep running hot. The big tech firms, especially those that provide large-scale cloud capacity and operate hyperscale-level data centers (Microsoft, Alphabet, Amazon, Meta, Oracle), are ramping up capex to even larger levels. At the end of last year, these firms were estimated to spend a total of $515B on capex in 2026, up from almost $400B in 2025. That amounts to about 1.6% of GDP, which is staggering. The most recent updates take the 2026 capex estimate to a whopping $740B, which is about 2.3% of GDP (2027 is expected to be even larger at 2.7%) – that is over 4x the level of capex in 2023 (0.5% of GDP) and 7x the size of where it was in 2019 (0.3%).
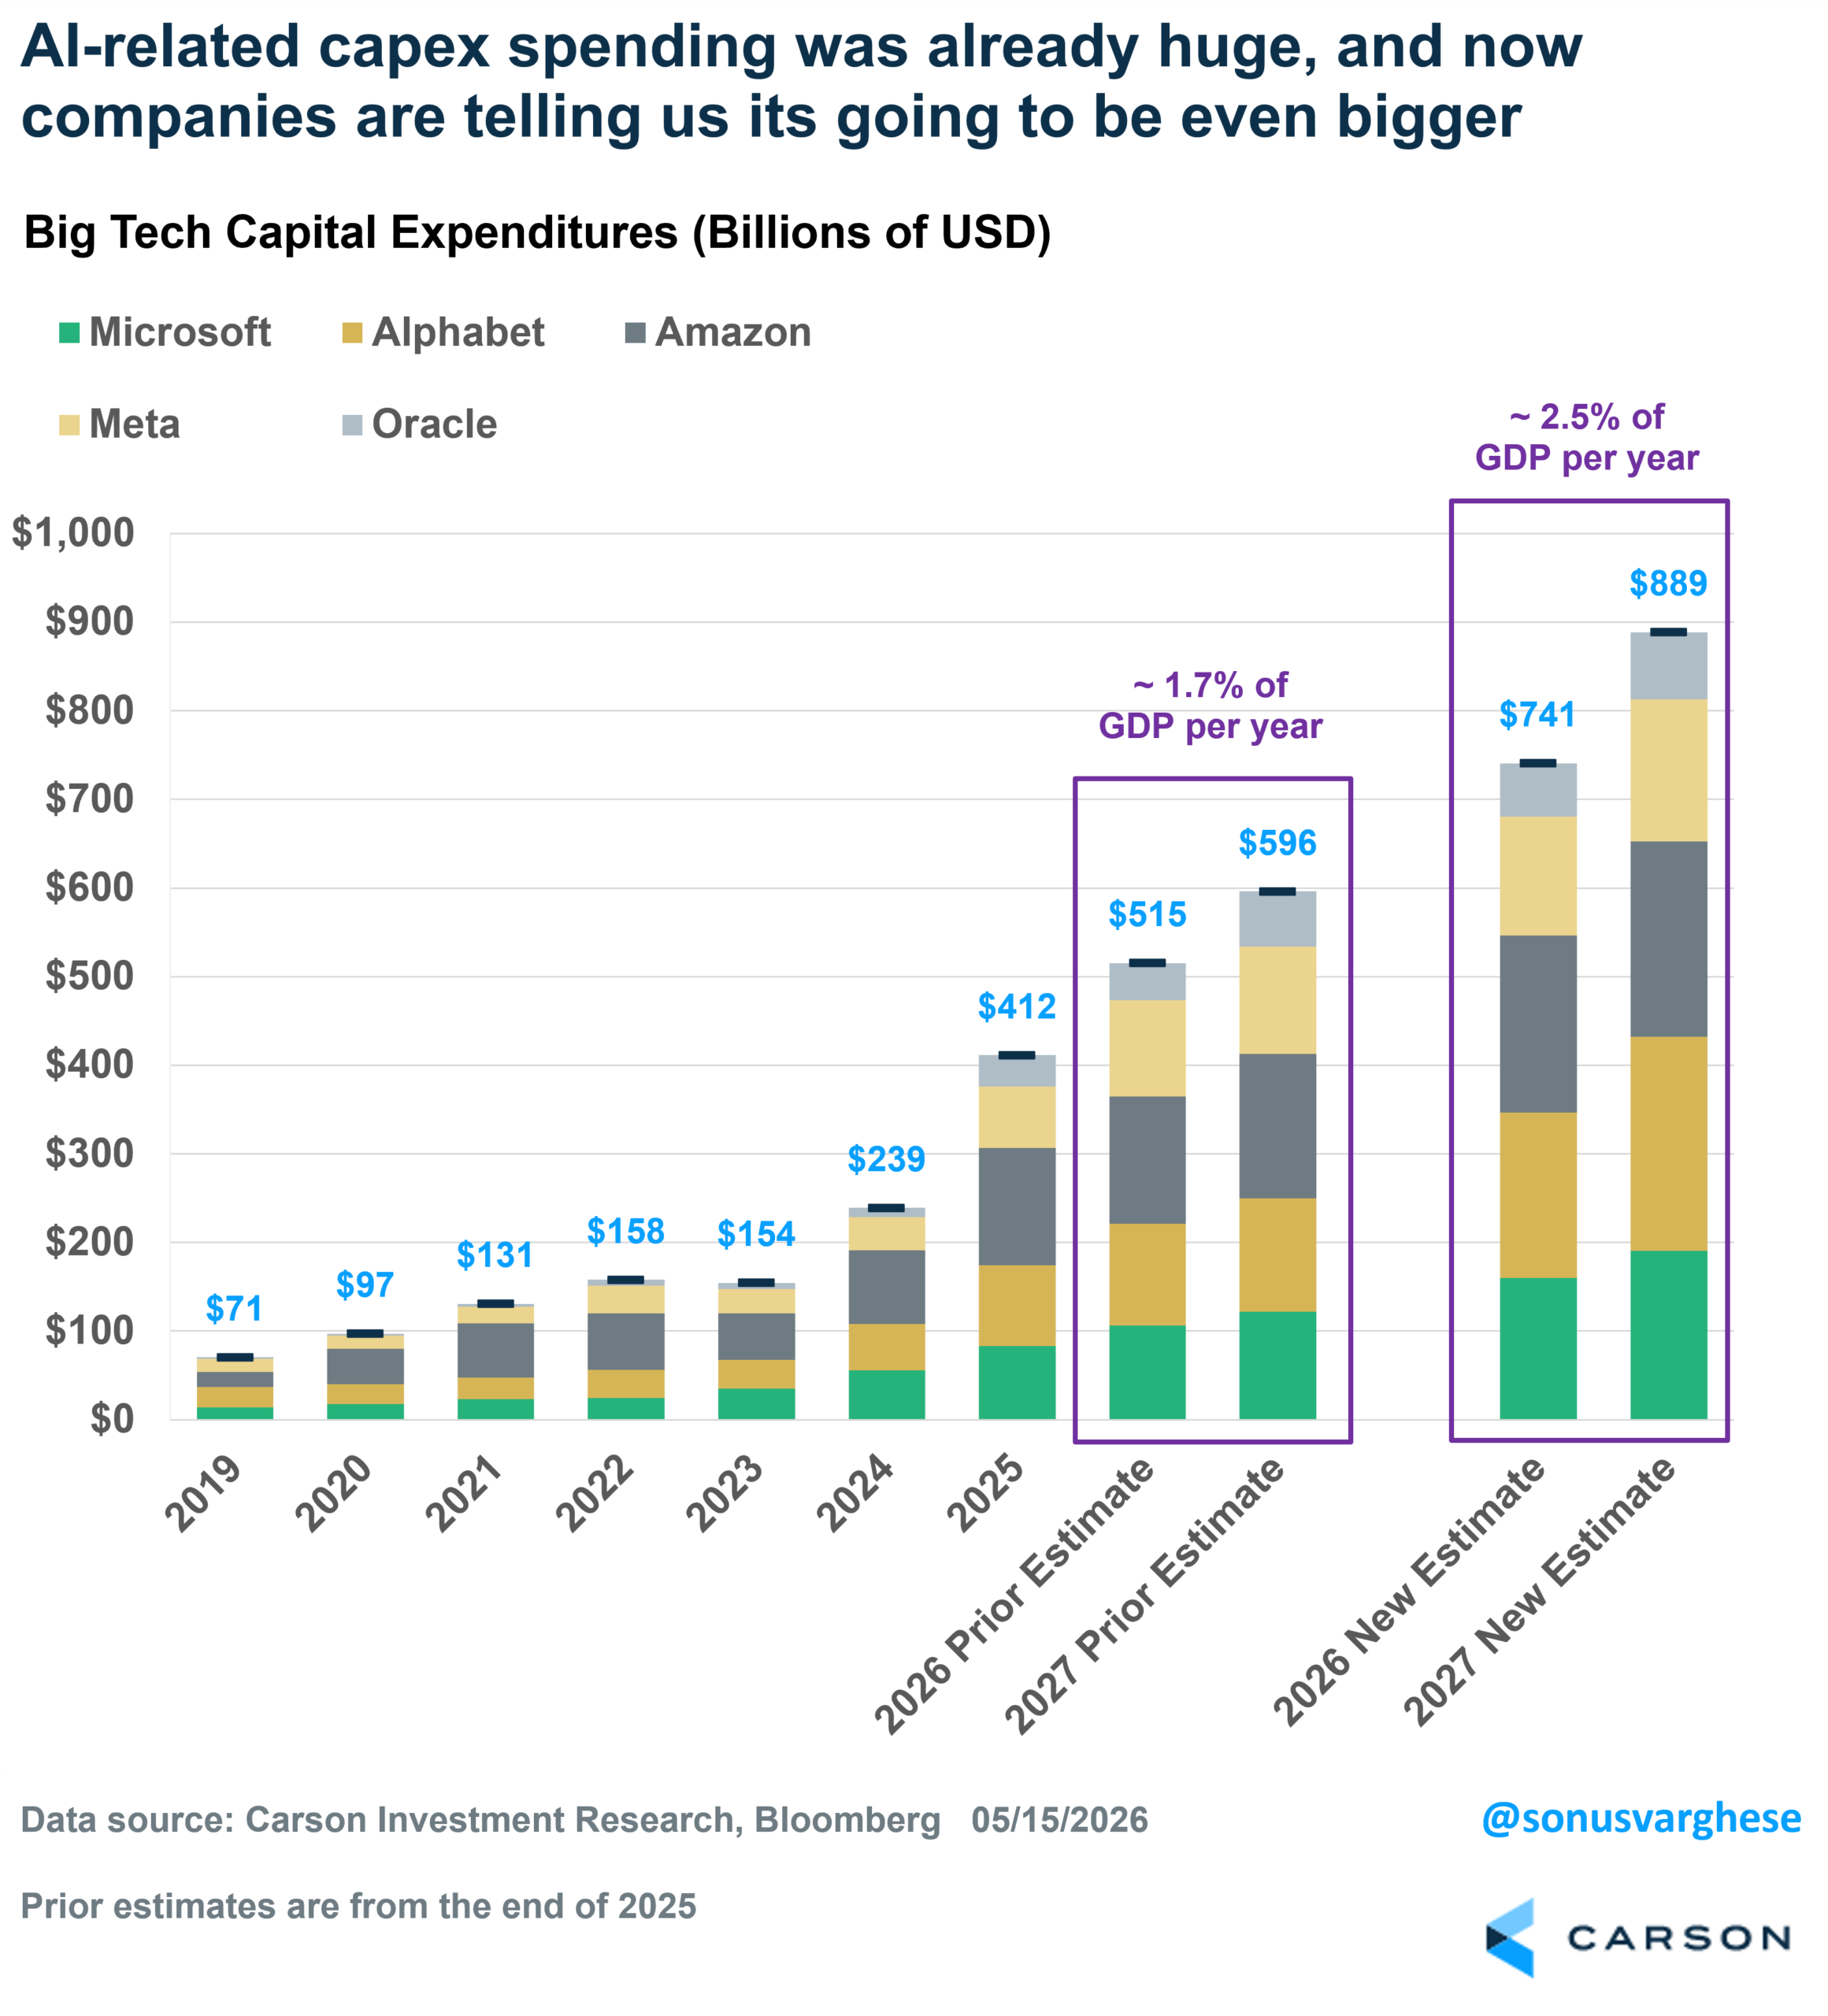
The melt-up in technology stocks has raised the obvious “bubble” concerns, but notably, this has come on the back of rising profit growth expectations. What’s important to keep in mind here is that one company’s spending is another company’s revenue and profits. That’s the connection between all this spending and what you see in the stock market. Interestingly, these profit growth estimates have seen the largest gains during earnings season, as companies tell us they’re going to spend even more on AI-related capex, and the companies on the other side of that (like the chip companies) see profits rise even more than expected.
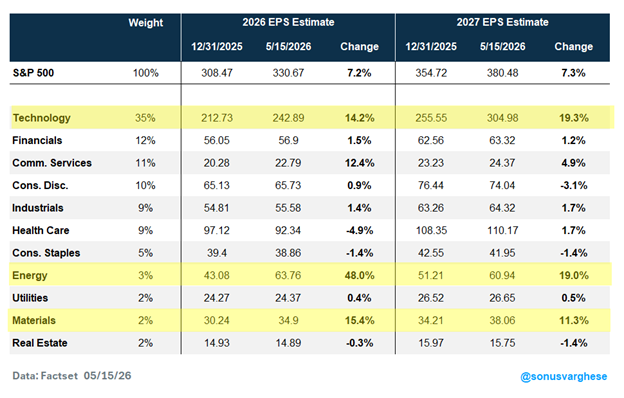
The S&P 500’s 2026 EPS expectation has risen over 7% since the start of the year, from $308 to $331. This isn’t “pulling forward” from 2027, as 2027 EPS expectations have jumped 7% as well, from $355 to $380. A breakdown of the 11 S&P 500 sectors shows exactly which sectors are boosting the aggregate index’s profit (EPS) expectations. From the start of the year, three sectors have mostly contributed to higher profit estimates:
- The tech sector has seen 2026 EPS expectations grow by 14% and 2027 EPS grow by 19%.
- Energy has seen 2026 EPS expectations grow by 48% and 2027 EPS by 19%.
- Materials has seen 2026 EPS expectations grow by 15% and 2027 EPS by 11%
The AI-wave is not just isolated to the US either. The MSCI Emerging Markets Index is up 23% year-to-date versus 10% for the S&P 500. This is on the back of massive gains in Korea (MSCI South Korea Index: +103%) and Taiwan (MSCI Taiwan Index: +49%) – both benefiting from large weights for chipmakers.
Stay on Top of Market Trends
The Carson Investment Research newsletter offers up-to-date market news, analysis and insights. Subscribe today!
"*" indicates required fields
Inflation’s Hot, and It’s A Broad Problem
Of course, profit growth and margin expansion also translate to inflation. The three sectors that have seen profit growth estimates soar are technology, energy, and materials, which are on the other side of inflation related to AI-bottlenecks and the energy spike due to the Middle East war. This is not to say it’s all “predatory pricing.” A lot of these firms are in the right place at the right time, whether it’s chip manufacturers (in the US or even in South Korea and Taiwan) or energy companies. As John Maynard Keynes said:
“Profiteers are a consequence, not a cause of rising prices.”
Amid AI-related bottlenecks, the Personal Consumption Expenditures Price Index (PCE) for computer software and accessories rose at an annualized pace of 59% in Q1 and 12% over the past year. Prices for this category fell continuously over the past two decades, but we’re seeing prices surge higher amid the AI boom. The producer price index (PPI) for semiconductor manufacturing is up 26% year-over-year, while the PPI for printed circuit board manufacturing is up a whopping 160%.
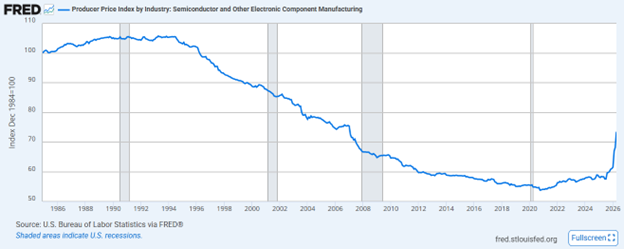
This is where the current AI wave is not quite like the late-1990s, yet. AI-related inflation shows that demand is outstripping supply now, whereas in the late 1990s, prices for all this stuff were plunging. If it were a bubble, we’d probably see massive over-capacity and over-supply (and then return on investment plunges). We’re not there yet, and perhaps keeping an eye on AI-related bottlenecks is important – if these start to ease, perhaps that will be the sign that we’re moving to oversupply.
The AI-related inflation story underlines why the inflation story is not just about energy or tariffs. Of course, the Middle East war and Strait of Hormuz closure are not helping matters, with the Fed’s preferred inflation metric, the personal consumption expenditures (PCE) index, up 3.8% year-over-year as of April. Core PCE is up 3.3%, but the problem is not isolated to a few items. Setting aside goods for a moment, and even shelter (which has normalized), the PCE index for core services ex-housing is up 3.6% over the past year, well above the 2018-2019 trend of 2.2%. Inflation’s hot, period.
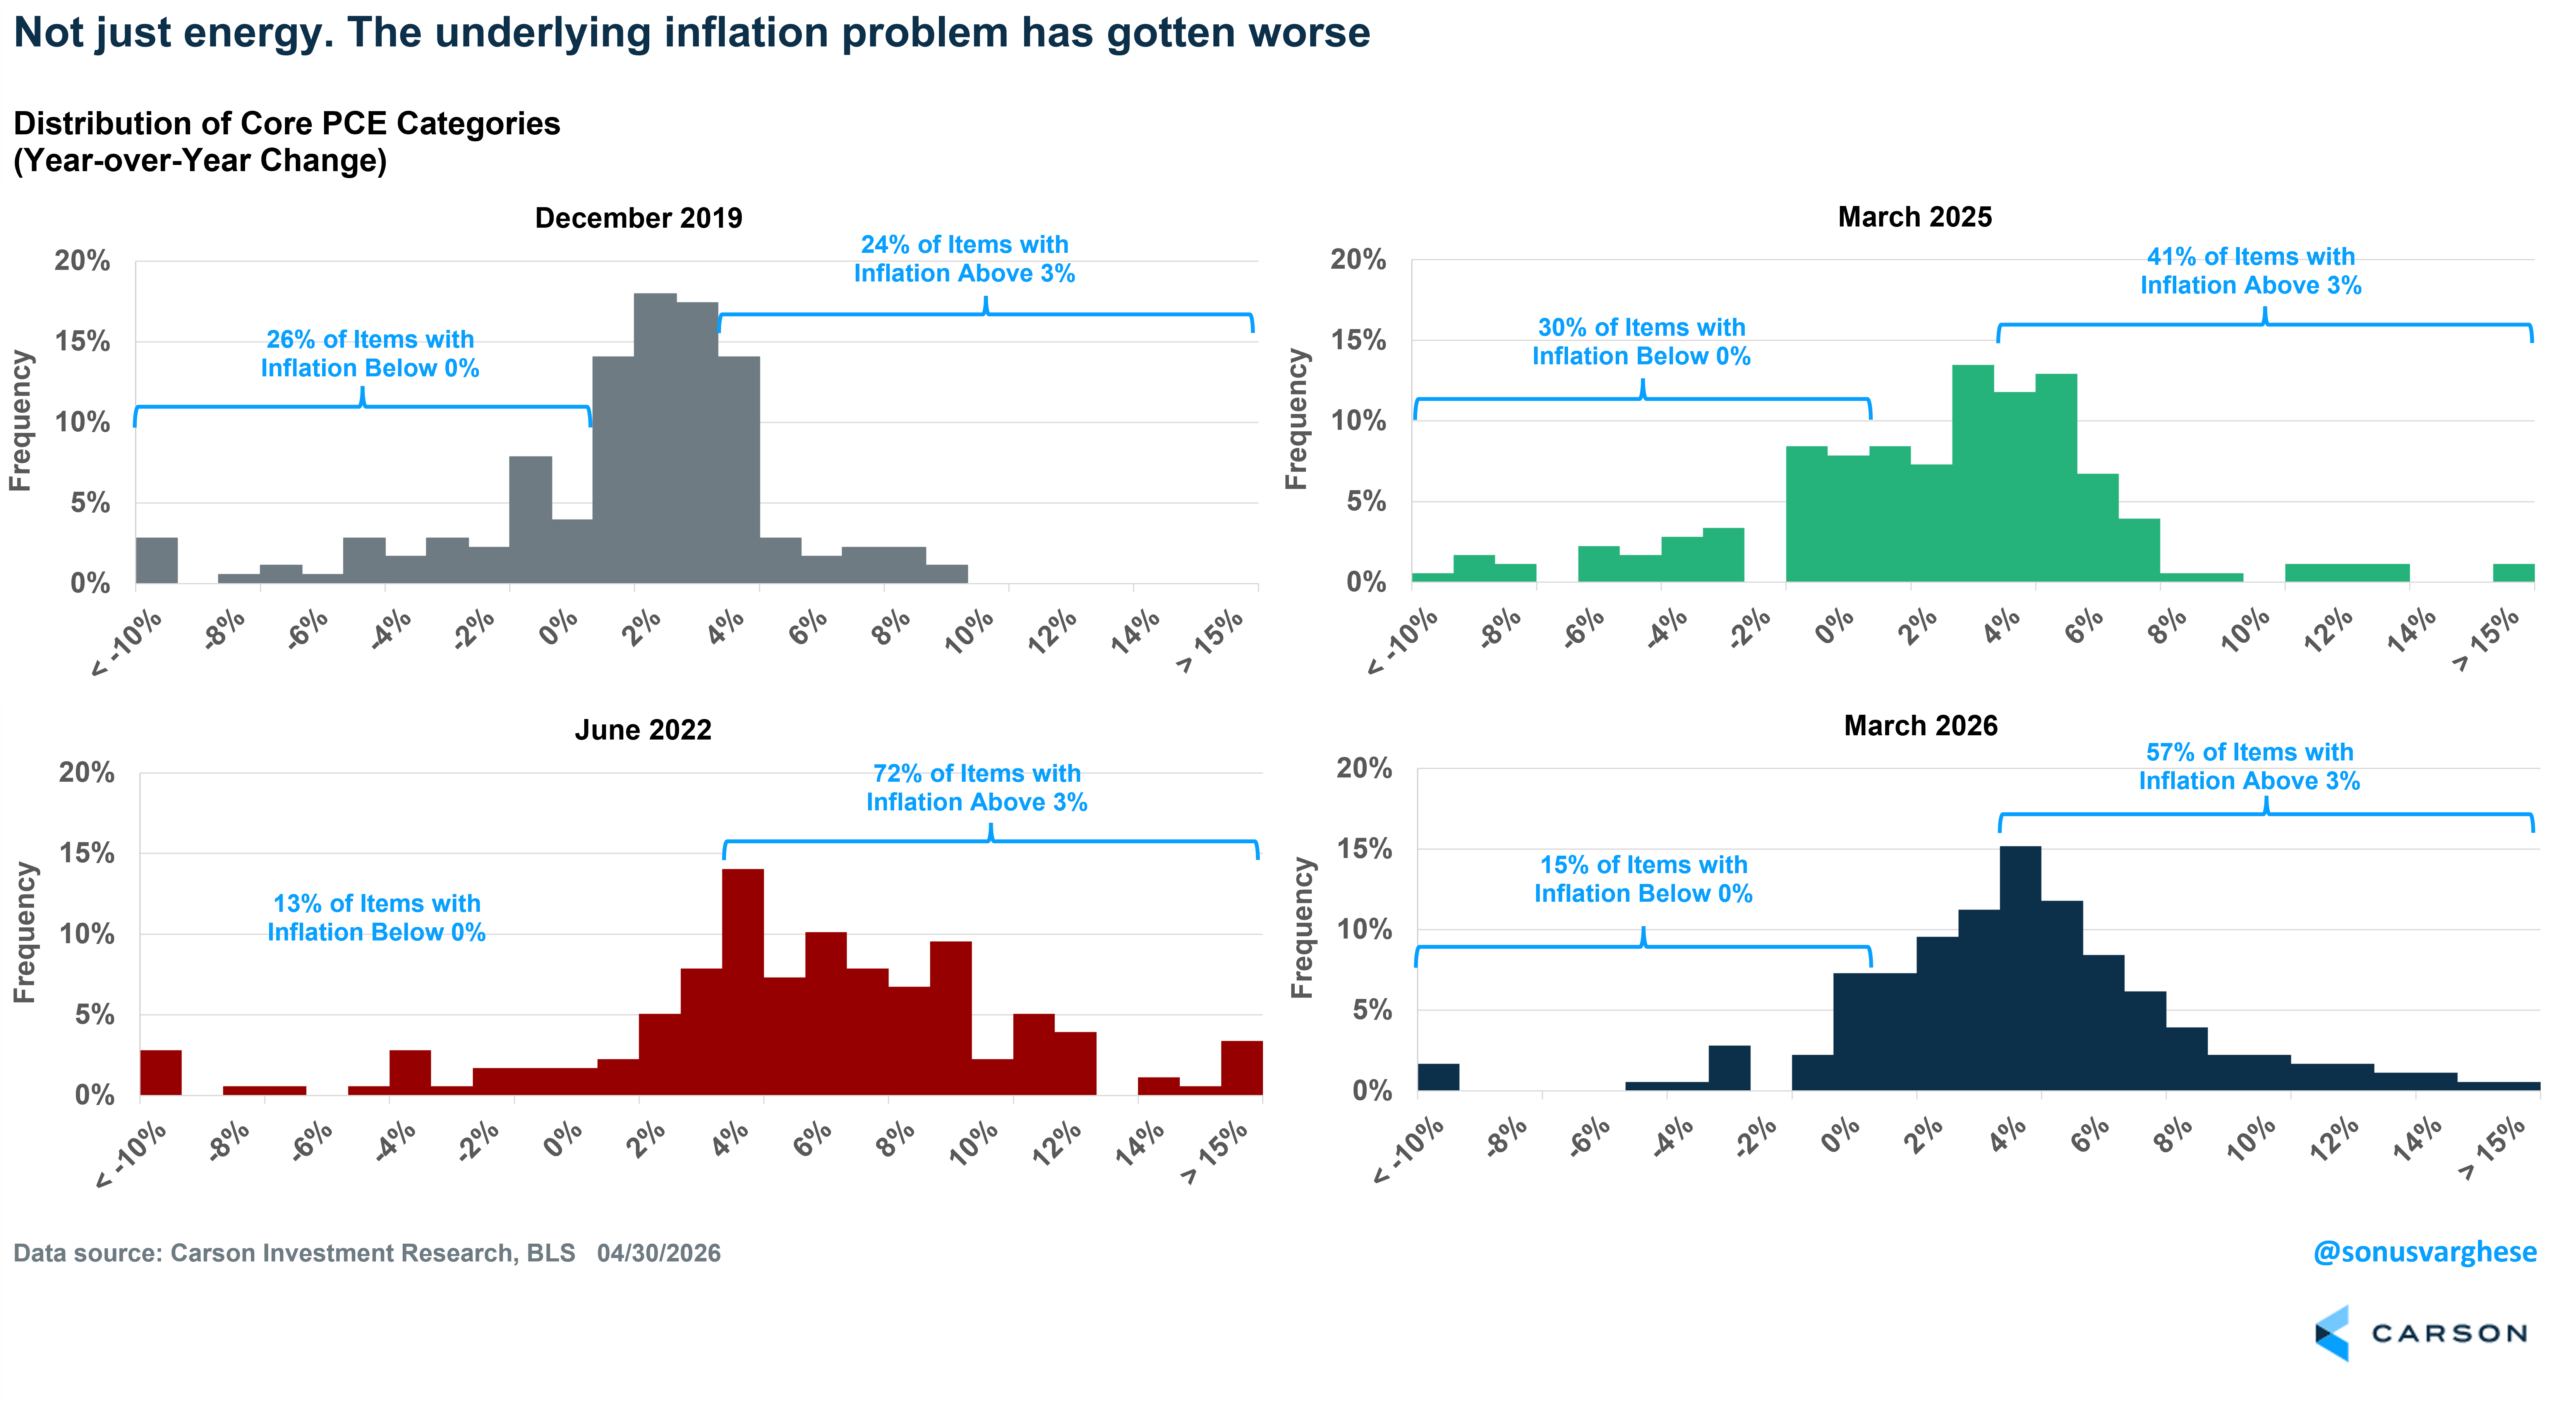
The Fed focuses on PCE rather than CPI, and one of the reasons is that it has a lot more items in the basket. We looked at 178 items within the core PCE basket and calculated the distribution of year-over-year inflation at four different times. You can see how inflation really broadened out in June 2022 relative to December 2019. Up until last year, the distribution was narrowing, but things were still not quite “normal”. And over the past year, things have gotten even worse. Here’s a look at the proportion of items with over 3% inflation rates (with over 4% in parentheses):
- December 2019: 24% with 3%+ inflation (10% with 4%+ inflation)
- June 2022: 72% (58%)
- March 2025: 41% (29%)
- March 2026 57% (42%)
Looking ahead, the indirect impact of Strait closure will feed into core inflation as well, via items like airfares and transportation costs (for goods). Food price inflation is likely to stay elevated amid higher fertilizer costs (a lot of which comes from the Middle East as a by-product of natural gas), and that’ll push restaurant prices higher. All this to say, the inflation problem will likely get worse before it gets better.
A Policy Tailwind (For Now): A Fed Expected to “Look Through” Inflation
All said and done, we were a long way away from normal on the inflation front, even if you ignore the energy shock (which you shouldn’t because that’s going to feed into core inflation as we noted above). Normally, a backdrop of a relatively healthy labor market and elevated (and rising) inflation would have the Fed thinking about rate hikes. Instead, it looks like the Fed, especially under incoming Chair Kevin Warsh, is going to look past elevated inflation.
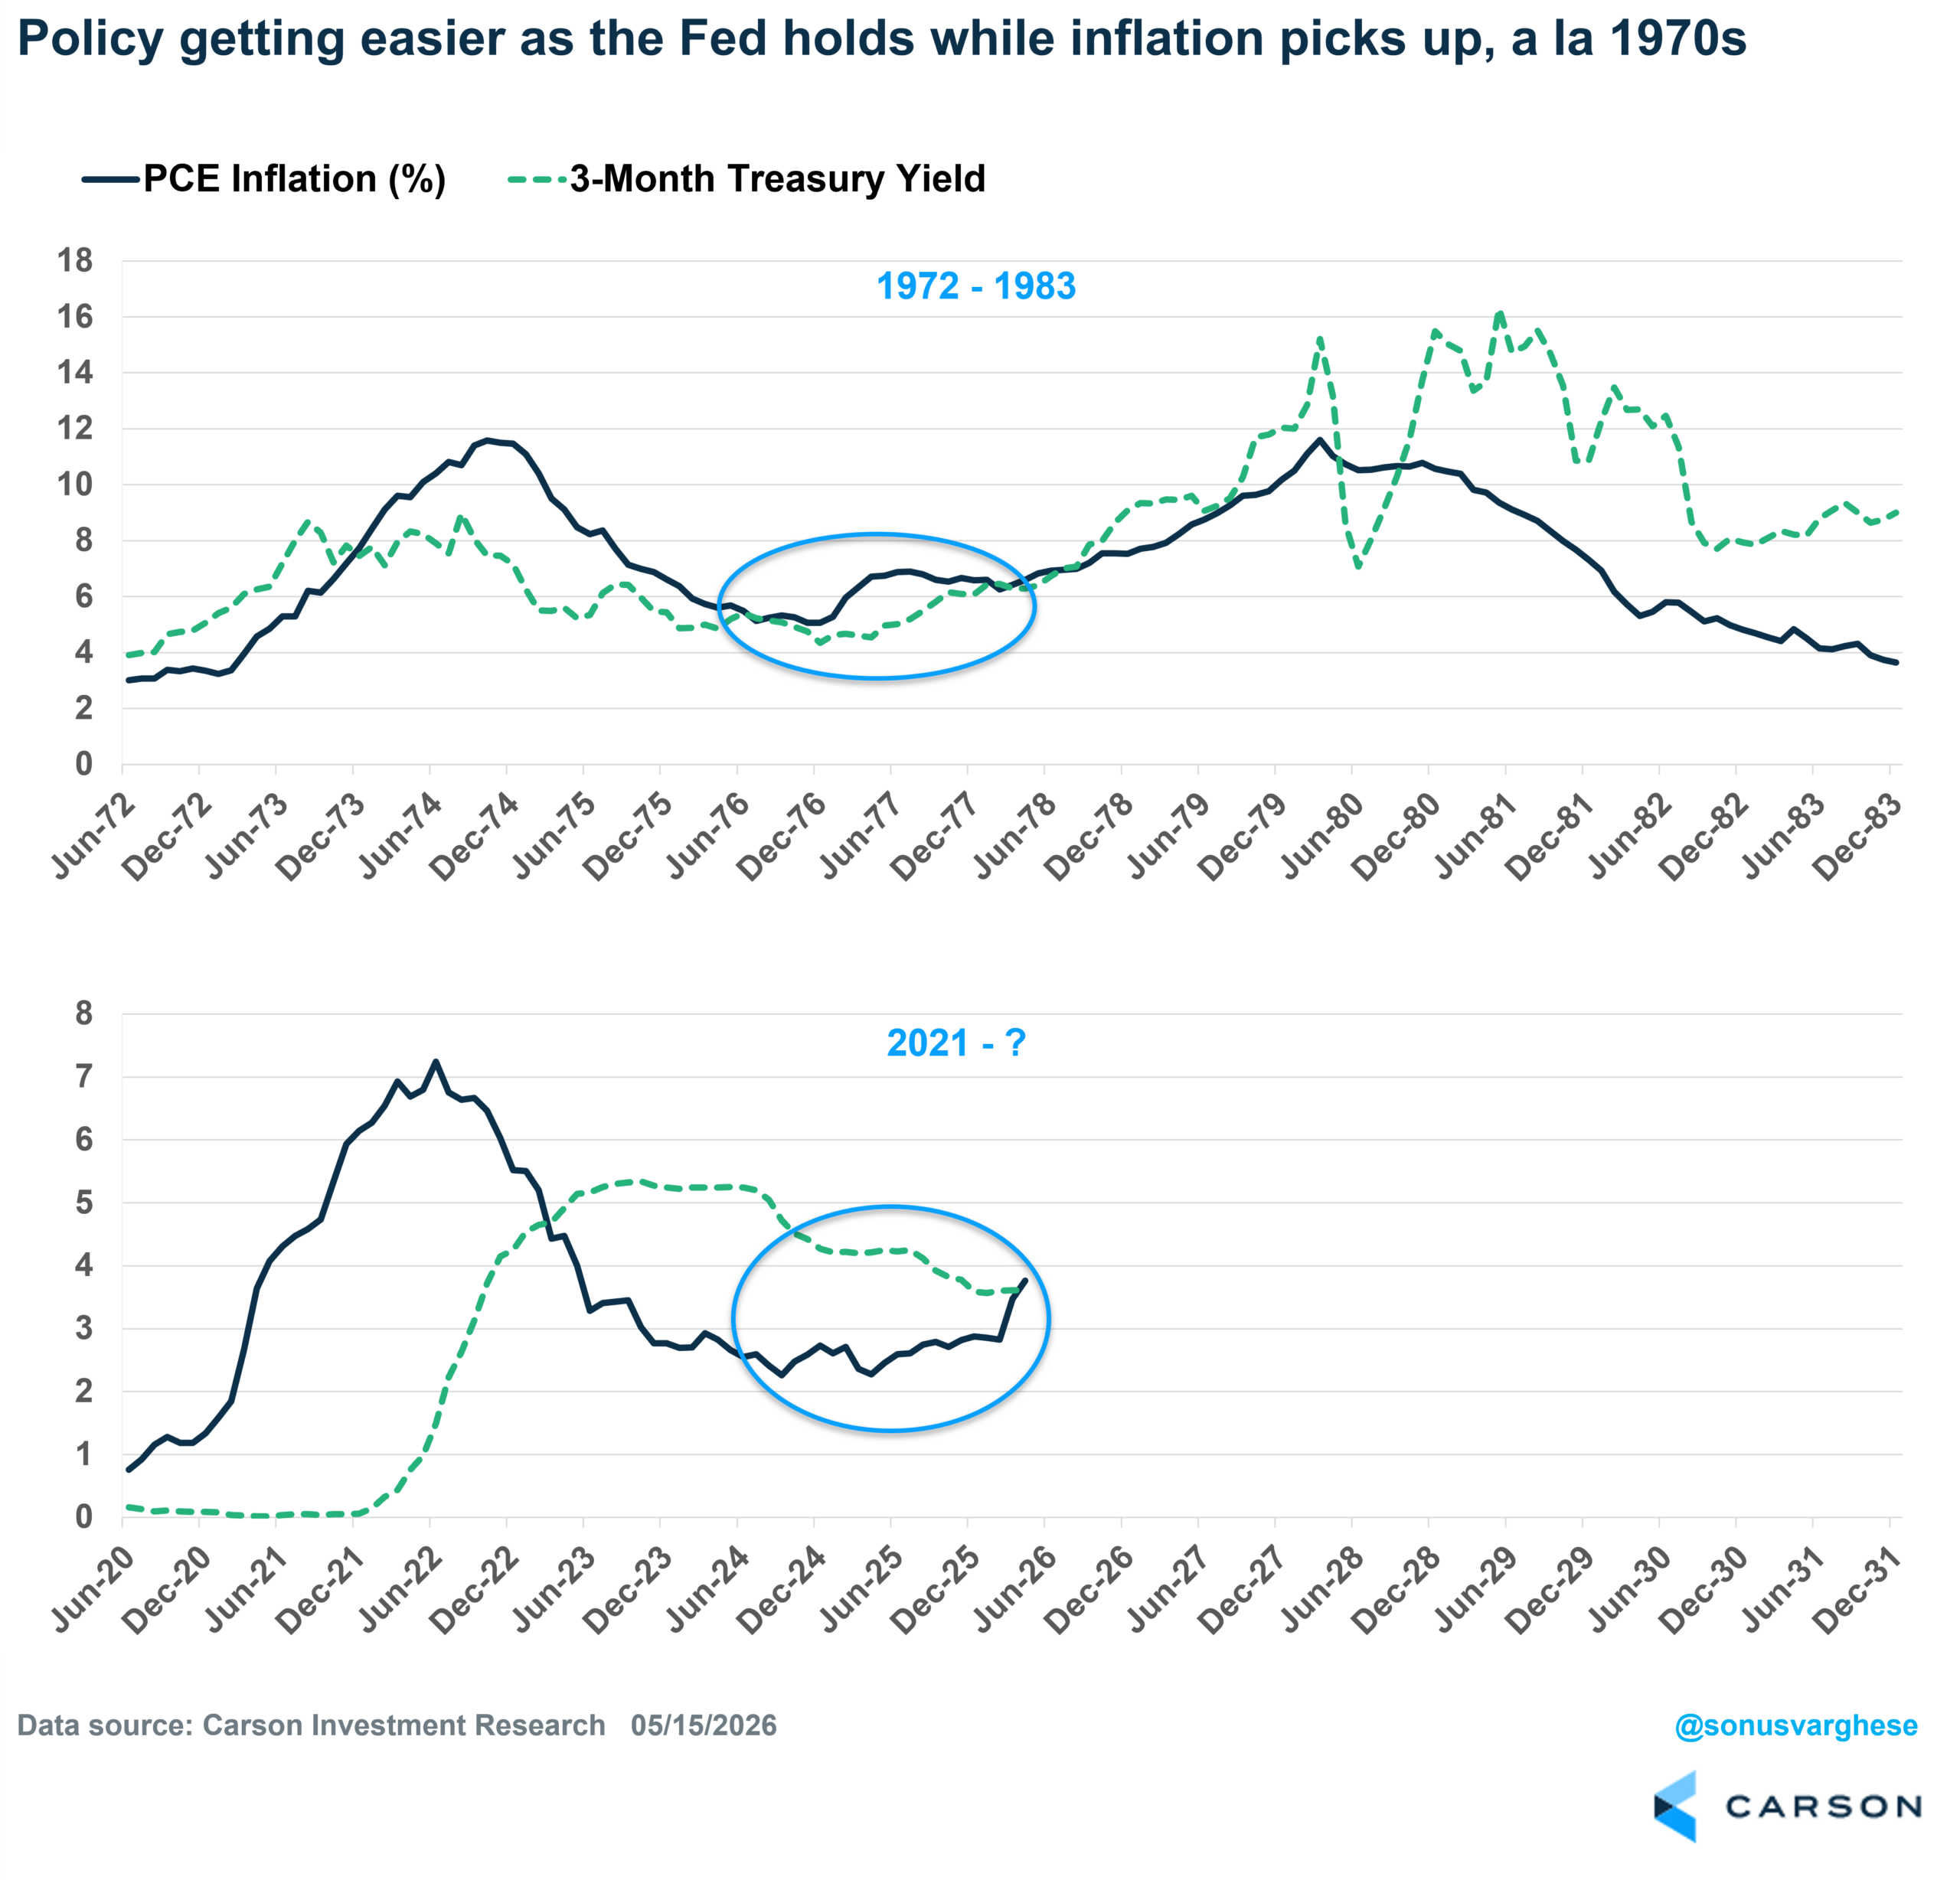
The risk here is quite obvious. At some point, whether it’s a year from now or 2-3 years from now, the Fed will realize that inflation has run too high for too long and will have to be even more aggressive to get inflation back to target. The current episode could end up being similar to what we saw in the 1970s and into the early 1980s. A relatively easy Fed looked past elevated inflation, but then Fed Chair Paul Volcker came in and raised rates to over 15% to ultimately crush inflation, in the process sending the economy into a big recession. That doesn’t imply we’ll see interest rates rise to 10% or more, like in the 1980s, but even raising rates to 5-6% from this point will be quite painful.
The 1970s and 2020s inflation episodes are shown in the chart below (using headline PCE inflation), along with the three-month Treasury yield (using this as a proxy for policy rates). As you can see in the bottom panel, the gap between rates (green dashed line) and inflation (dark blue line) has closed. In other words, the fact that the Fed is standing pat while inflation remains elevated (and is rising) means policy is getting more dovish even if rates stay where they are.
Welcome to The Party, Mr. Warsh
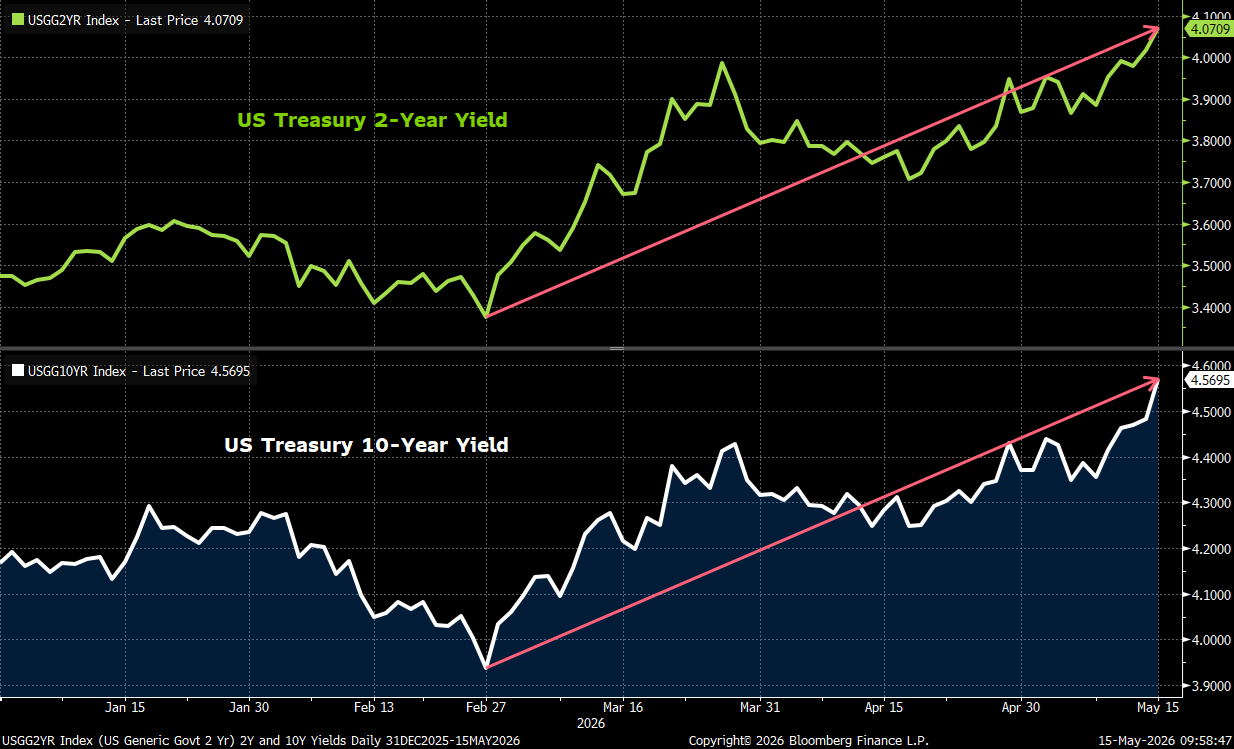
For now, the ultimate beneficiary of a dovish Fed that is willing to let inflation run hot is the stock market (and investors). At the same time, the real cost of higher inflation, and arguably the war in the Middle East, is reflected in the bond market. Short and long-term yields are at the highest levels we’ve seen this year and reflect the real cost of the crisis. Since the eve of the war (February 27th):
- 2-year treasury yields have risen 70 bps to 4.07 – well above the current Fed policy rate of 3.63, implying markets think the Fed will ultimately have to raise rates
- 10-year treasury yields have risen 63 bps to 4.57
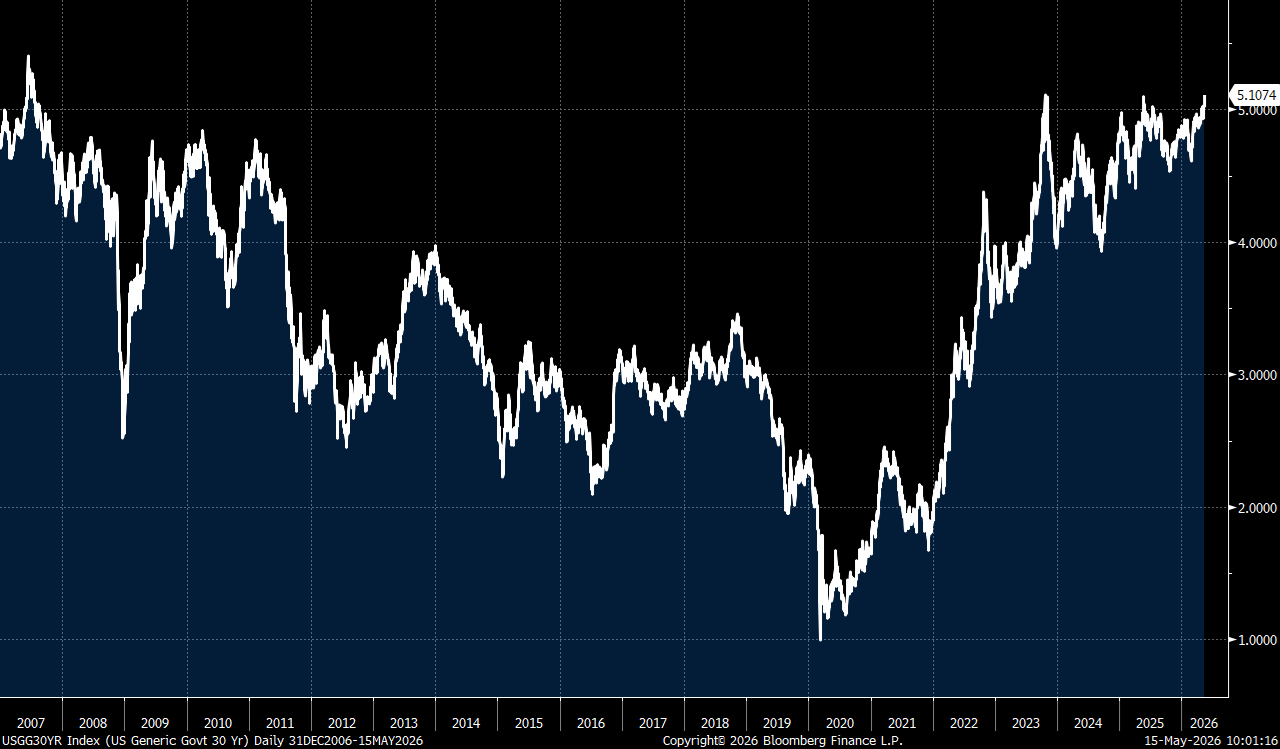
The 30-year treasury yield is now at 5.11, the highest level we’ve seen in recent years.
War is expensive, and in this case, we’re going to have to live with higher borrowing costs (including the government). That’s going to drag on areas of the economy like housing. For now, the AI wave is powerful enough to overcome that, but therein also lies risk – it can hurt once the party ends.
The inflation backdrop and the bond market are giving Kevin Warsh a real test as he begins his tenure. We wish him the best of luck, for all our sakes. He’s going to need it.
We’re Still Riding The Wave, But Looking to Avoid A Wipeout
For our part, we remain overweight equities amid this inflationary growth environment – we have a massive capex boom, fiscal expansion, and easy monetary policy for now. While there are several risks out there – the Fed reversing to a very hawkish position and reversal of the AI-wave – there’s also a right tail risk, i.e., missing out on a boom that could last a while. But we don’t want to be overexposed to the boom and go all in. Which is why we’re diversified across US and international stocks, and even within the US, we have barbell exposure to technology (and related areas) with diversified bets on areas within the industrials sector and even low-volatility stocks, which tend to be more risk-efficient.
Inflationary growth also means bonds are unlikely to diversify your portfolio as well as they did in the 2010s and 2020s. This is why we continue to diversify our diversifiers, with allocations to managed futures (a long/short trend following strategy with exposure to a wide variety of assets, including commodities, via futures markets) and even cash (rather than long-term bonds).
For more content by Sonu Varghese, Chief Macro Strategist, click here.
8931605.1. – 15MAY26A
