
If you’re wondering what I’m talking about, read on, but maybe grab a cup of coffee or your favorite beverage. M2 is a measure of money in the economy, and right now it’s falling, which has led to any number of overhyped worries, including a deflationary recession and/or a stock market crash, as people are perceived to have “less money” to spend or invest.
BUT, the short answer to the question “should we be worried about falling M2” is no.
The long answer should perhaps start with what exactly M2 is. Think of it like a Russian doll, with M2 consisting of something called M1 plus something additional, while M1 consists of something called M0 plus something additional.
- At the first level we have M0 (or monetary base): currency in circulation (cash) + reserves (“bank money”)
- Then we have M1: M0 + checkable deposits + savings deposits
- Above that is M2: M1 + time deposits (like CDs) + retail money market funds

A key part of M2 is “deposits,” and it turns out deposits are falling. Deposits at commercial banks have fallen 2.1% over the year through December, while M2 has fallen 2.3%. Historically, the rate of change of M2 has closely tracked the rate of change of deposits, as you can see in the chart below. The correlation between the two lines is 0.89, and about 0.97 since 2009.
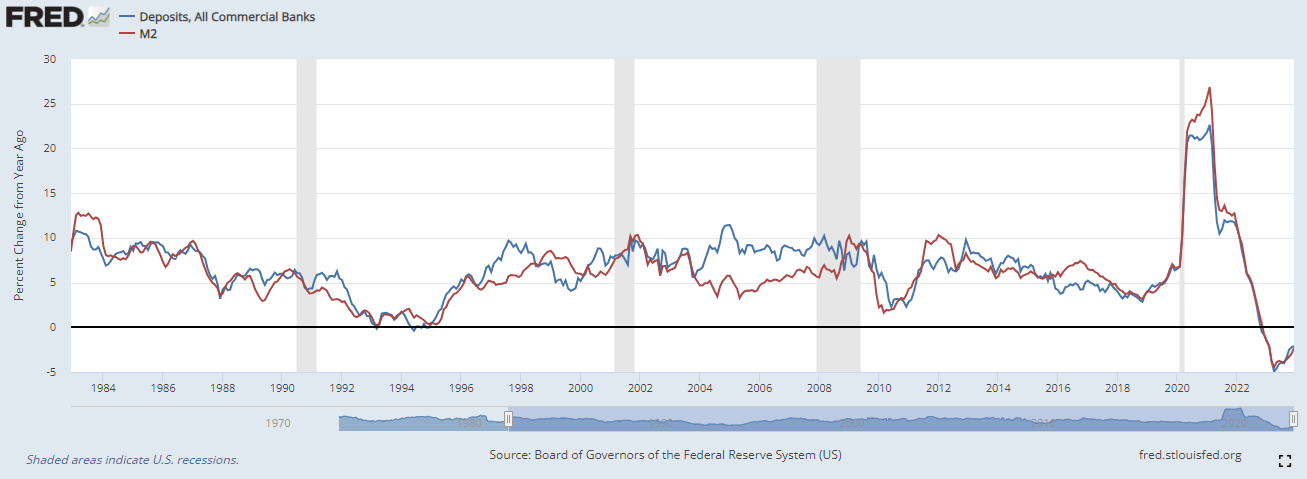
More recently, deposits and M2 surged after the pandemic hit. From February 2020 through December 2020, M2 rose 39%, while deposits rose 34%. Since then, through December 2023, M2 and deposits have fallen 3%. We’ve never actually seen such a steep decline in M2, or deposits.
To get to the question of why M2 is dropping, we need to understand why deposits are falling. But for that, let’s track back to why deposits surged in the first place after the pandemic hit. By May 2021, deposits were up 23% year over year, well above the historical average of about 6%. From February 2020 through December 2021, deposits surged from $13.4 trillion to $17.9 trillion, an increase of $4.5 trillion. Since then, deposits have fallen $0.6 trillion to $17.3 billion.
There were three main reasons why deposits surged after the pandemic. And the reversal of these is what’s leading to a fall in deposits (and thereby, M2).
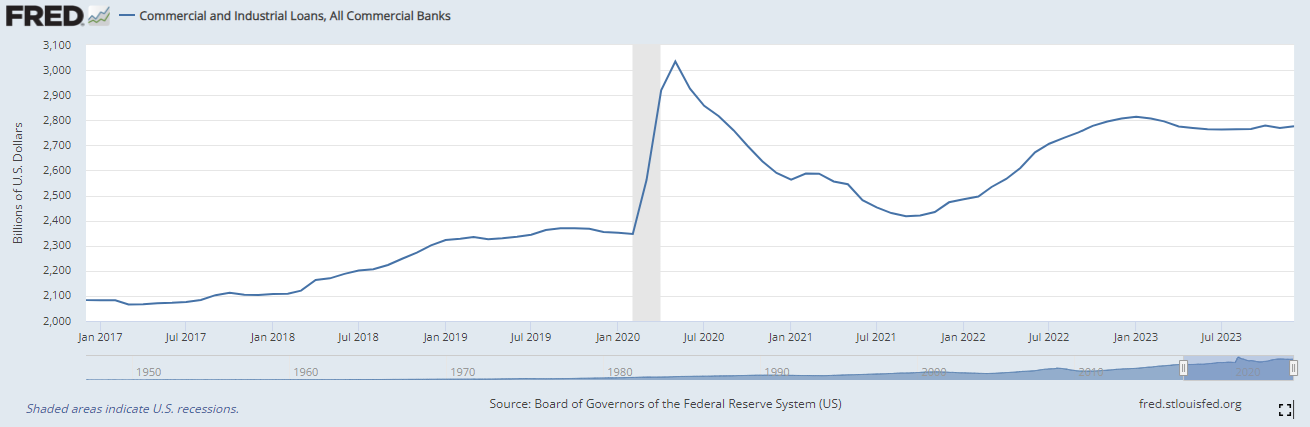
1) There was huge initial spike in commercial and industrial loans
When the pandemic hit, a lot of businesses drew upon their commercial and industrial (C&I) credit lines in order to build cash buffers in the event of a brutal recession. When a business draws upon its credit line, an equivalent amount of money gets deposited in that business’s bank account. Voila! Money is “created out of thin air” by the bank. When a bank makes a loan, it deposits an equivalent amount of money in the borrowers’ bank account. This is a useful reminder that most of the money creation in the economy is done by banks when they make loans, and loans create deposits as opposed to deposits being “lent out.”
C&I loans jumped about $0.7 trillion to just over $3 trillion between March and May 2020. These credit line draws then collapsed over the following year as the economy normalized, and businesses were able to pay back what they borrowed. As you can see below, commercial and industrial loans started to pick up again in late 2021 and early 2022 but plateaued after that as interest rates surged.
2: Deposits surged due to the Fed’s bond purchases, and that’s reversing now
The Federal Reserve (Fed) re-upped their bond-buying program, i.e. Quantitative Easing (QE), in March 2020 after the pandemic hit, and that led to a surge in deposits as well.
Here’s an example to understand why deposits increase when the Fed buys long-term government bonds (and mortgage-backed securities). Say, the Fed buys $1 million of Treasury bonds – but instead of buying them from the Treasury directly, they buy it from a pension fund. However, the Fed did not print $1 million worth of currency and swap it with the pension fund for Treasuries. What it did print was “reserves,” which are bank money that banks use amongst themselves to settle balances. The Fed used banks as an intermediary during QE. In our example, the Fed credited the pension fund’s bank account with a deposit of $1 million – which is a $1 million liability of the bank (as are all deposits), and a $1 million asset for the pension fund. It then credited $1 million reserves with the pension fund’s bank – which is a $1 million asset for the bank and equivalent liability for the Fed. The picture below highlights the process (via the Bank of England). You can see what happens to each entity’s balance sheet:
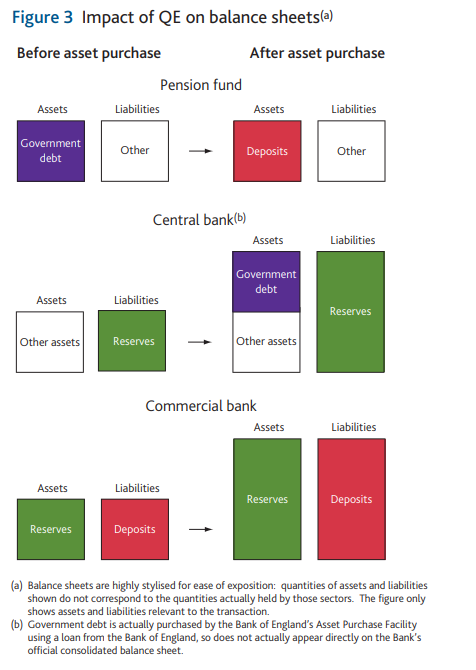
For each entity, here’s what happened:
- Pension fund: It still has a $1 million asset on its books, albeit a short-term deposit instead of a long duration Treasury bond.
- Fed: It “financed” its purchases of the $1 million Treasury bond by creating bank money, i.e. reserves.
- Bank: It added $1 million of assets (reserves) and $1 million of liabilities (deposits). So, there was no overall change in net worth but the bank’s balance sheet expanded.
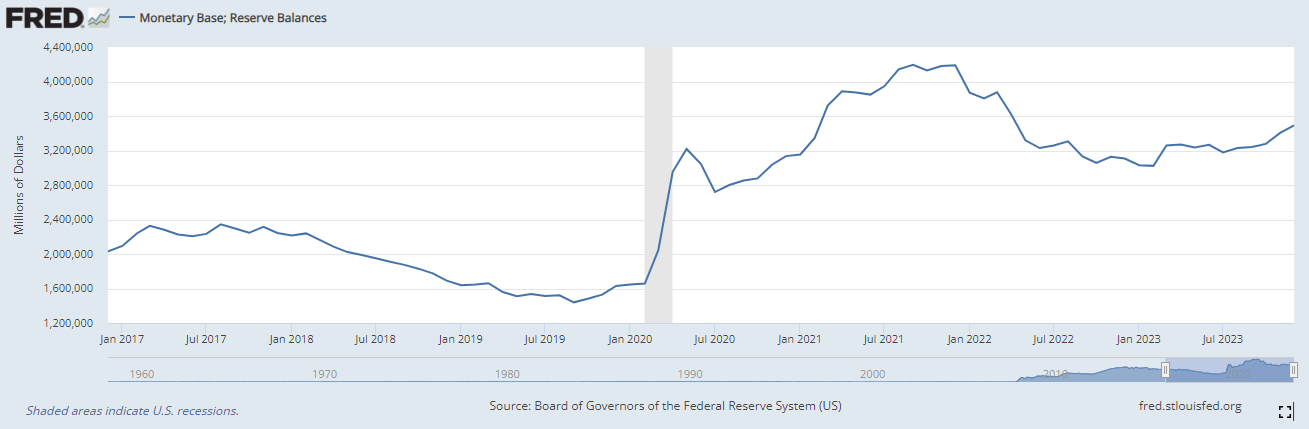
As you can see, reserves weren’t “free money” for the bank, since an equivalent deposit was created at the same time. This is how QE increased deposits in the banking system. Reserve balances surged from $1.7 trillion in February 2020 to $4.2 trillion in December 2021. Since then, the Fed has reversed its bond buying program, and is now engaged in “Quantitative Tightening” – bringing reserves down to $3.2 trillion, driving deposits, and M2, lower in the process (a reversal of what I went through above).
3: Consumers increased liquid savings in 2020/2021 amid the pandemic, and that’s reversed (a bit)
The pandemic saw household bank deposits surge, thanks to…
- Reduced consumption, which sent household savings rates surging
- Covid relief payments in the form of stimulus checks, the child tax credit, and PPP loans
- Covid relief measures such as deferred rental and student loan payments
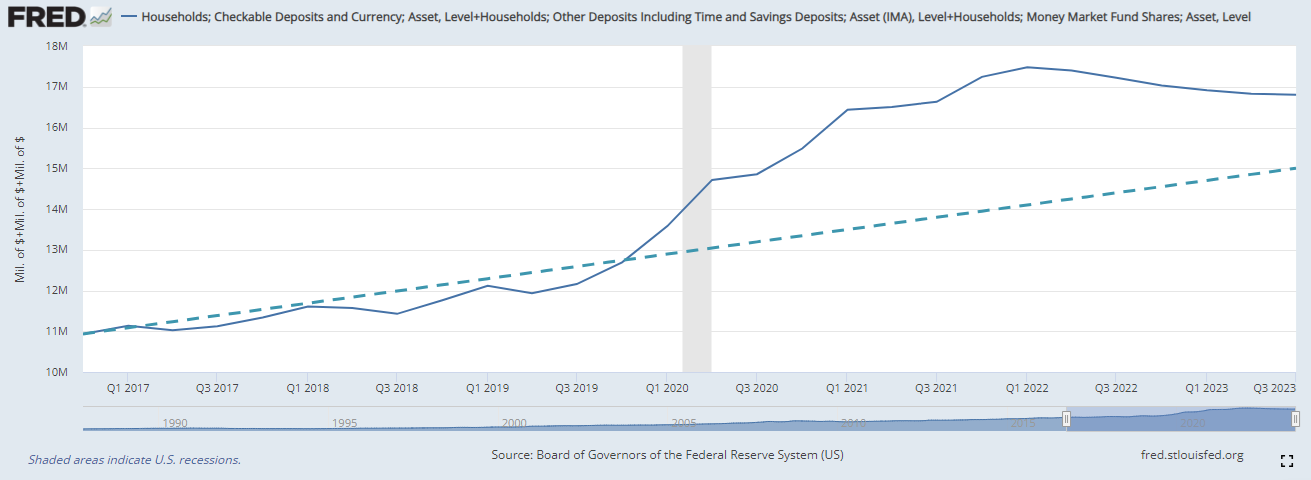
As a result, household deposits (checkable, time, and savings deposits) surged by over $4 trillion between Q4 2019 and Q4 2021. But this has pulled back by about $1.3 trillion since then (through Q3 2023). Now, a chunk of it has migrated to money market funds, which are paying a lot more interest than they did just a couple of years ago. Household assets in money markets have risen by $0.8 trillion since the end of 2021 (note that this is “counted” as part of M2).
Taking all of this into account – checkable, time, savings deposits, and money market fund shares – the drop since 2021 Q4 is about $0.5 trillion. This also means households still have a chunk of liquid assets left, around $1.8 trillion more than you’d have expected based on the pre-pandemic trend (2017-2019).
In summary, M2 is falling because deposits are falling because pandemic era (2020-2021) trends are reversing:
- The Fed has reversed Quantitative Easing, thereby draining deposits (and reserves) in the banking system.
- There is no more fiscal stimulus, or other measures, which is what ballooned household deposits.
- Households are no longer saving as much as they did during the pandemic.
Instead of M2, Look at Bank Lending
Rather than looking at M2 to understand how much money creation, or “destruction,” is happening, a much more straight-forward approach is to look at the entities that create most of the money in the system, i.e. the banks (in addition to fiscal deficits). As I pointed out above, banks create money “out of thin air” when they make a loan. And no, a bank loan officer doesn’t take yours (or my) deposit and lend out some fraction of it. Instead, the act of creating a loan results in a deposit being credited to the borrowers’ bank account.
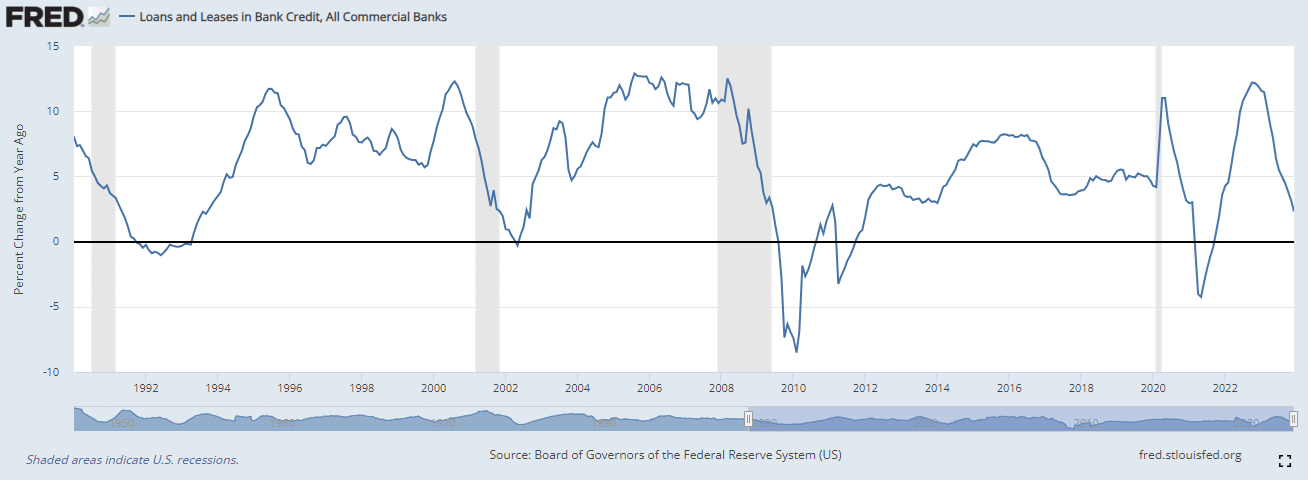
So, let’s look at bank lending.
The good news is that bank lending grew in 2023 by about $250 billion, despite the crisis around the failure of Silicon Valley Bank last March, which created concerns about the banking system. The bad news is that loan growth eased from a 12% year-over-year pace at the end of 2022 to just over 2% at the end of 2023, well below the 1990-2019 average of around 5.5-6%.
At the same time, keep in mind that GDP growth in 2023 is likely to clock in at 2.5-3%, above the prior decade trend. Because of that, the economy didn’t need credit to keep its engines moving. Instead, strong incomes, thanks to a strong labor market, and government spending (including defense and state and local government spending) boosted the economy. As we move into 2024, easing interest rates, and continued demand in the economy, is likely to boost loan growth, which would be a tailwind for economic growth.
All this to say, there’s a lot going on an economy, especially one as dynamic as the US economy, and you have to look at the totality of data rather than just one seemingly simple indicator like M2.
Curious to see what Carson’s Chief Market Strategist, Ryan Detrick and I are up to? Check out our most recent episode of Facts Vs Feelings:
Our newly released can be viewed here: Outlook ’24: Seeing Eye To Eye.
For more of Sonu’s thoughts click here.
02083724-0124-A
