
I believe one of the most powerful and overlooked tools in portfolio construction is the use of factor investing. Factors are characteristics of stocks that help to describe their risk and return, offering another way to classify stocks, similar to sectors and industries. Factors can also replicate some of the things an active manager can do – i.e., allocating to high-quality, undervalued stocks. Factors can get you most of the way there, and a lot of active managers use factors for screening and risk management. As we have written about extensively before, we use factor investing in many ways inside portfolios – for alpha generation, risk reduction, downside protection, and diversification.
We have seen a meaningful amount of volatility and dispersion in factors this year. Through the market lows in late March, value, small caps, and minimum volatility led the charge, trading flat to slightly positive on the year despite the S&P 500 down as much as 7%. Momentum stocks were down nearly 10% at that point, only to come screaming back to be one of the best-performing factors this year, behind small caps, which have maintained their lead. This is visualized in the quilt chart below. It is no surprise that multi-factor strategies that lean towards value, small caps, and use momentum as part of their trading process have done quite well in recent years.
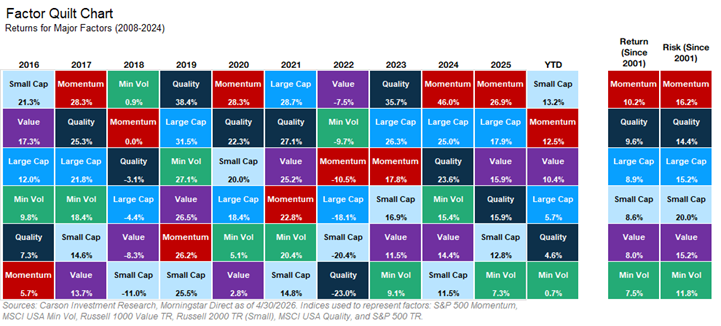
The quilt chart makes it easy to visualize the change in leadership – or lack thereof – year after year. What is more difficult to see is the dispersion between factors. A simple way to measure this is to look at the difference between the best-performing and worst-performing factor, something you can observe annually, or preferably over rolling time frames. Most investors do not invest solely on calendar year time frames, so looking at multiple observations over time gives a better feel for the true experience for investors. This is displayed in one form in the chart below. The difference between the highest- and lowest-performing factors over rolling 24-month periods shows a recent pattern change – factor dispersion has substantially increased in the last couple of years. There are reasons for this change that are beyond the scope of this piece (i.e., is momentum riding a wave or a bubble), but there are meaningful investor implications.
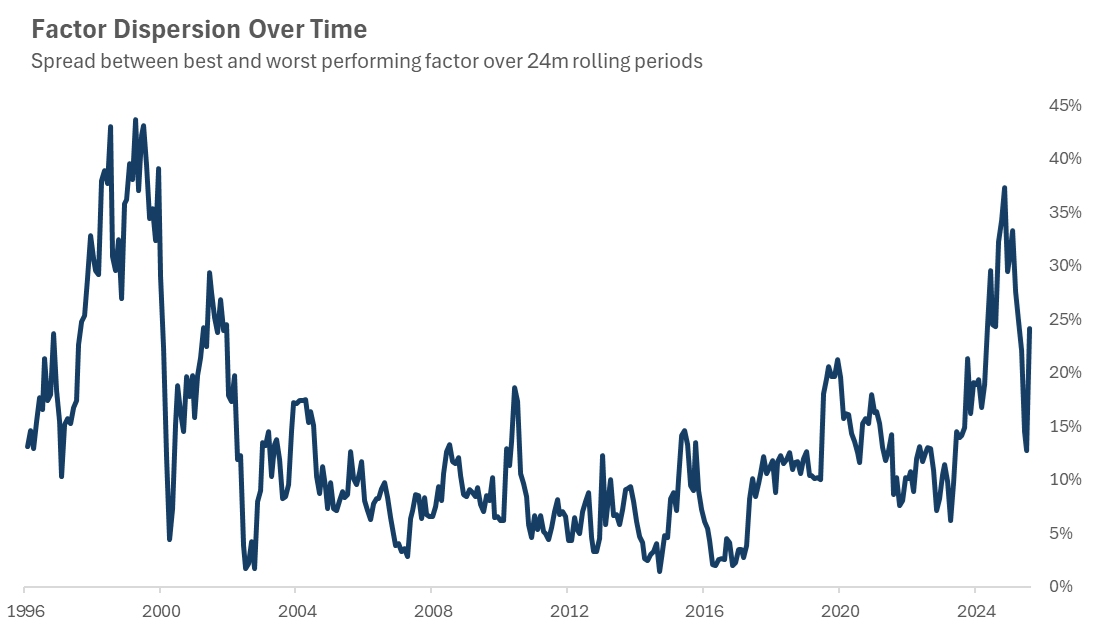
Sources: Carson Investment Research, Morningstar Direct. Factors used are the same as the quilt chart shown above.
When dispersion climbs to these levels, it’s no secret that investing in the right factor – or combination of factors – can yield extraordinary results. We’ve written before on how we believe navigating factor selection and vehicle construction are much more important than many think, and that factors offer a way to invest in stocks without taking single stock risk while still getting the desired exposure. The opposite is also true – being in the wrong factor, set of factors, or expression of a factor can harm portfolios and cause investors to abandon single-factor investing outright. Active, multi-factor investing has been a very smart way to manage portfolios for a long time, and has been expressed both inside ETFs, as well as what we do, managing that exposure at a total portfolio or model level.
Stay on Top of Market Trends
The Carson Investment Research newsletter offers up-to-date market news, analysis and insights. Subscribe today!
"*" indicates required fields
Factors respond to different economic and fundamental variables in different ways. Careful analysis of what drives factor returns and proactively tilting portfolios in anticipation of those dynamics has been a benefit across our strategies over time.
For more content by Grant Engelbart, VP, Investment Strategy and Research, click here.
8916966.1. – 7MAY26A
