
We’re starting to see a bounce in consumer confidence as Americans increasingly recognize the strength of the economy. Keep in mind that the economy grew 3.1% in inflation-adjusted terms last year, well above the 2010-2019 trend of around 2.5%. So, it’s welcome news that the soft sentiment data is catching up to the strong hard data. However, skepticism hasn’t disappeared, and there’s a fear that consumer finances are fragile and a recession is just around the corner. Ryan Detrick, Carson’s Chief Market Strategist took on these “doubting Thomases” in a very important piece, in which he discussed how consumers and households actually appear to be in the best shape in decades.
Stay on Top of Market Trends
The Carson Investment Research newsletter offers up-to-date market news, analysis and insights. Subscribe today!
"*" indicates required fields
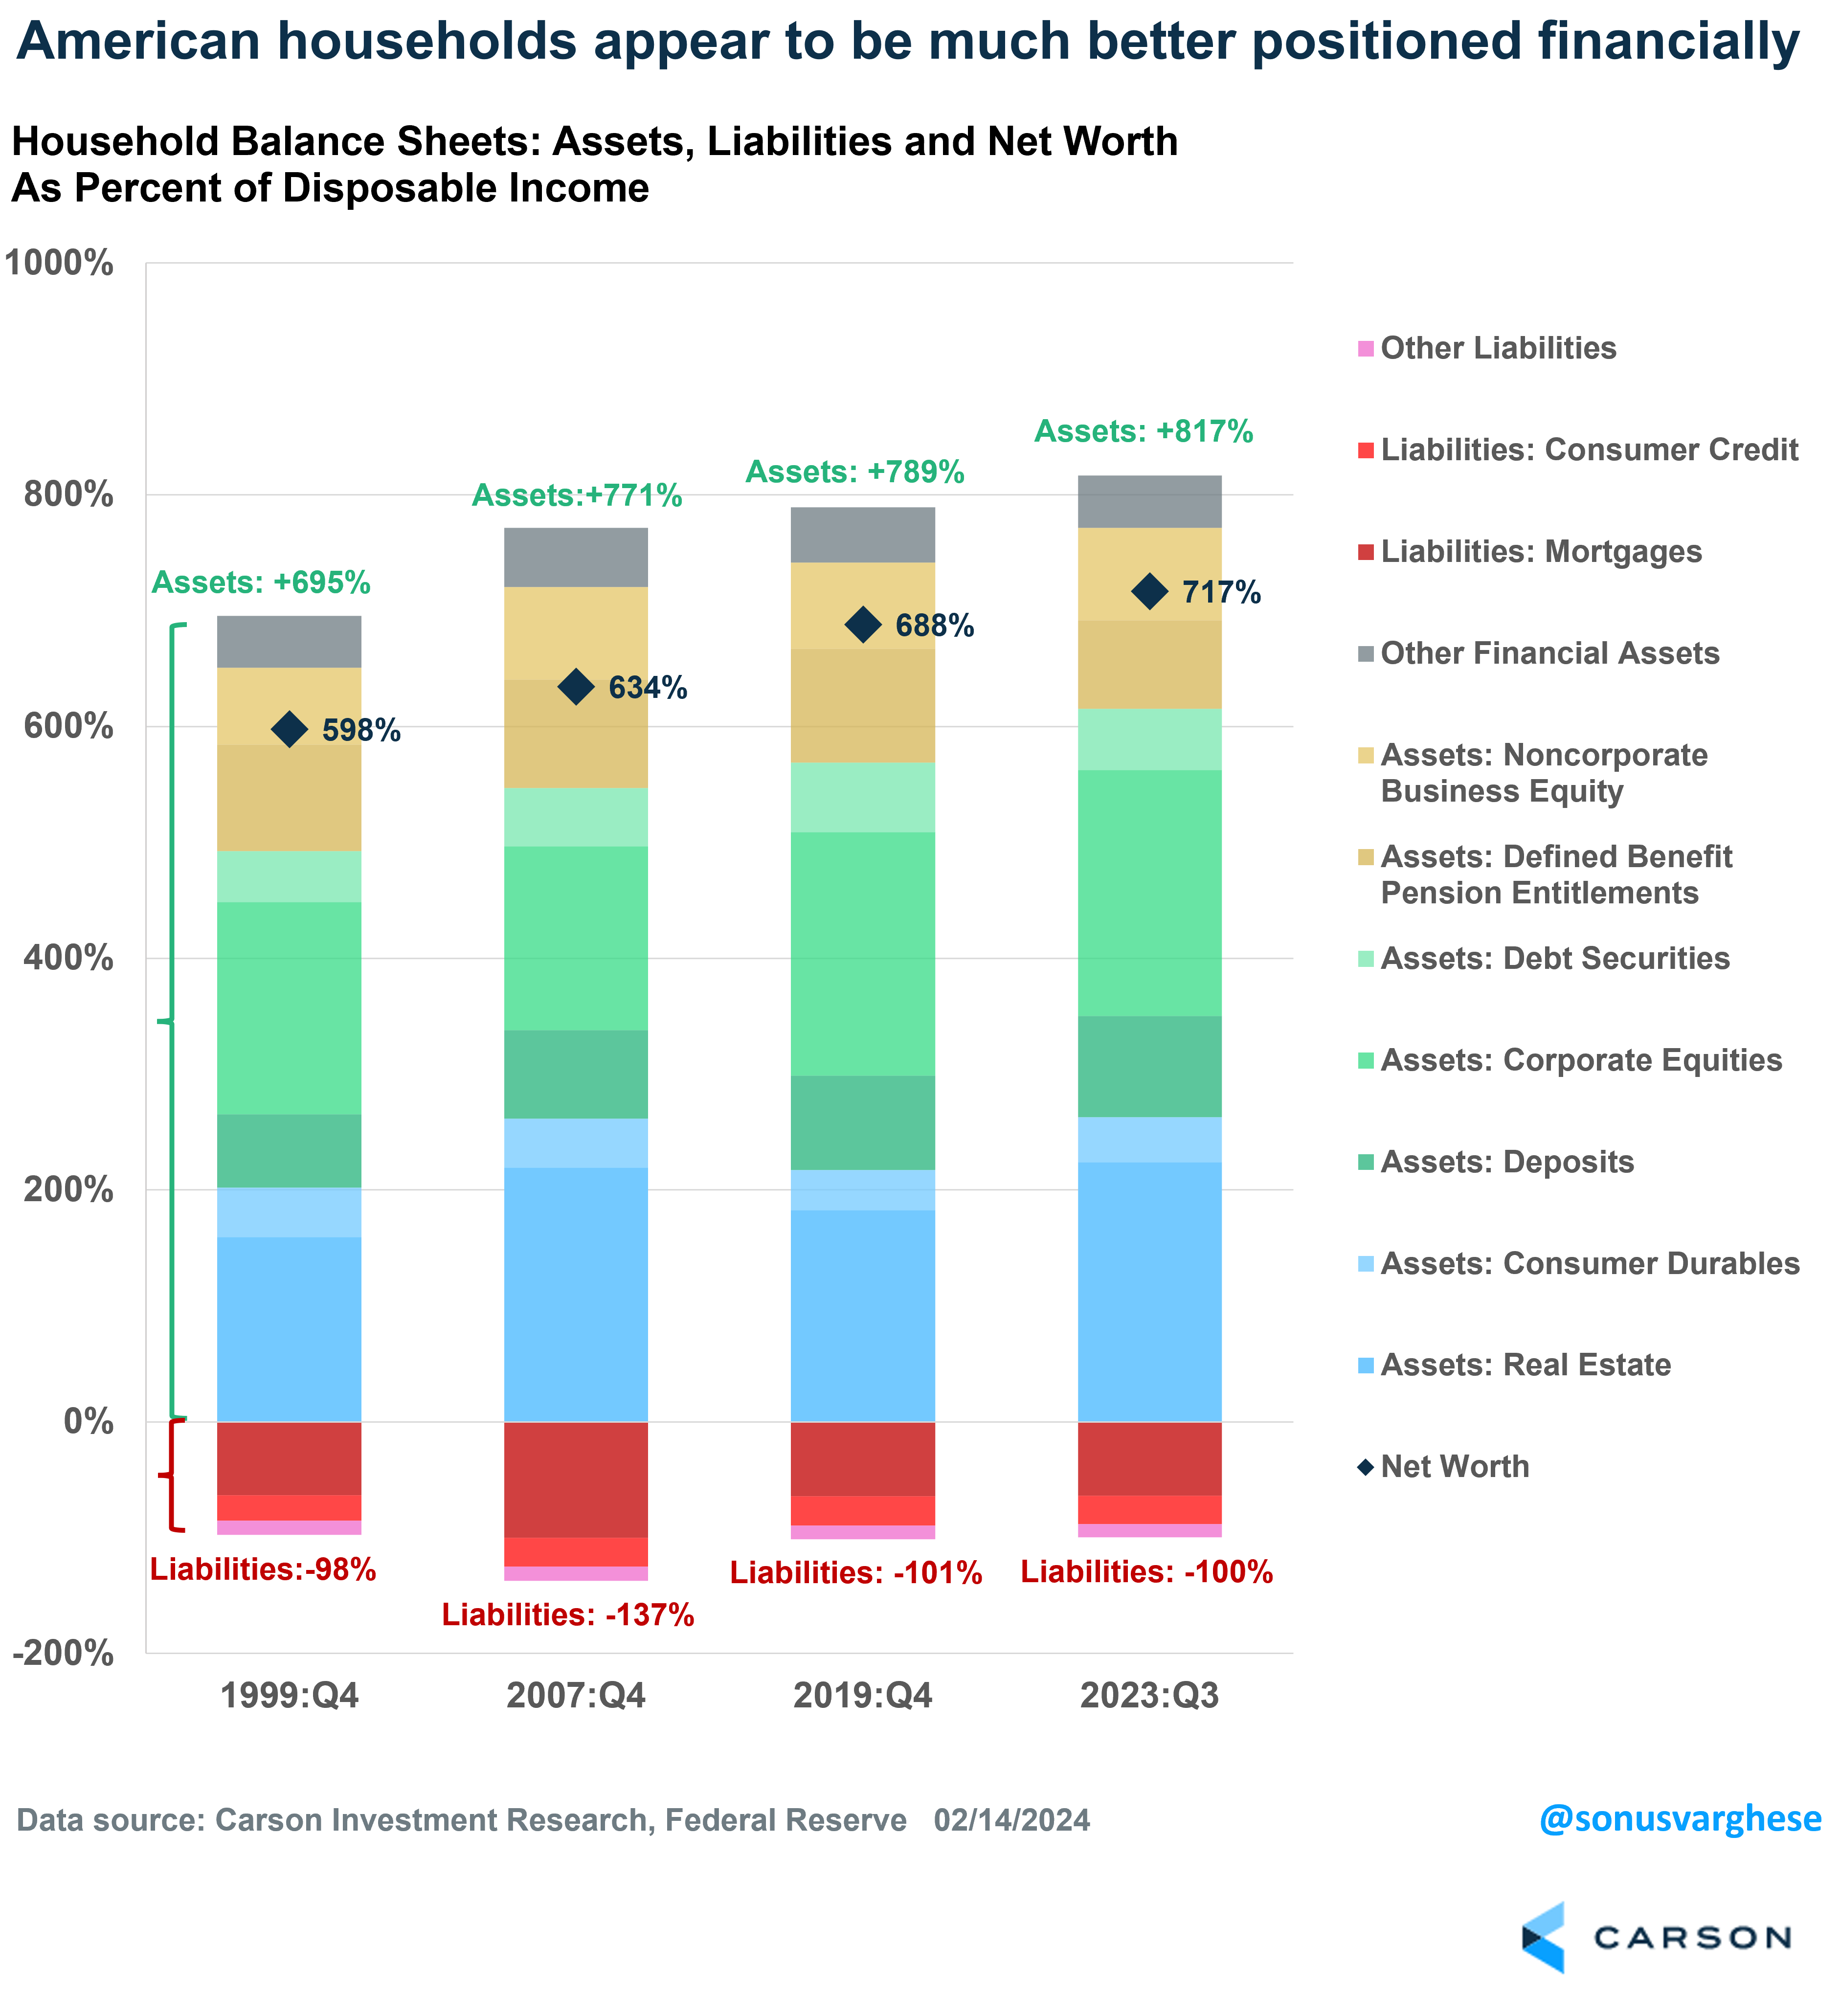
Keep in mind that household consumption accounts for just under 70% of the economy, and so the “state of the consumer” is a very important question. Here’s a chart from his blog, illustrating how net worth is 717% of disposable income as of Q3 2023, which is higher than what it was pre-pandemic (Q4 2019), and well above the late 1990s – two instances when the economy was widely considered strong.
One question we get when we share this chart is “Oh! But all that net worth is in the hands of a few, and lower income people are struggling.” We’re not denying that there’s significant inequality, with a majority of assets in the hands of the wealthiest households. Nor are we denying that a surge in inflation typically hits lower income earners disproportionately.
However, the reality is that lower income groups have seen a significant improvement in their net worth over the last few years.
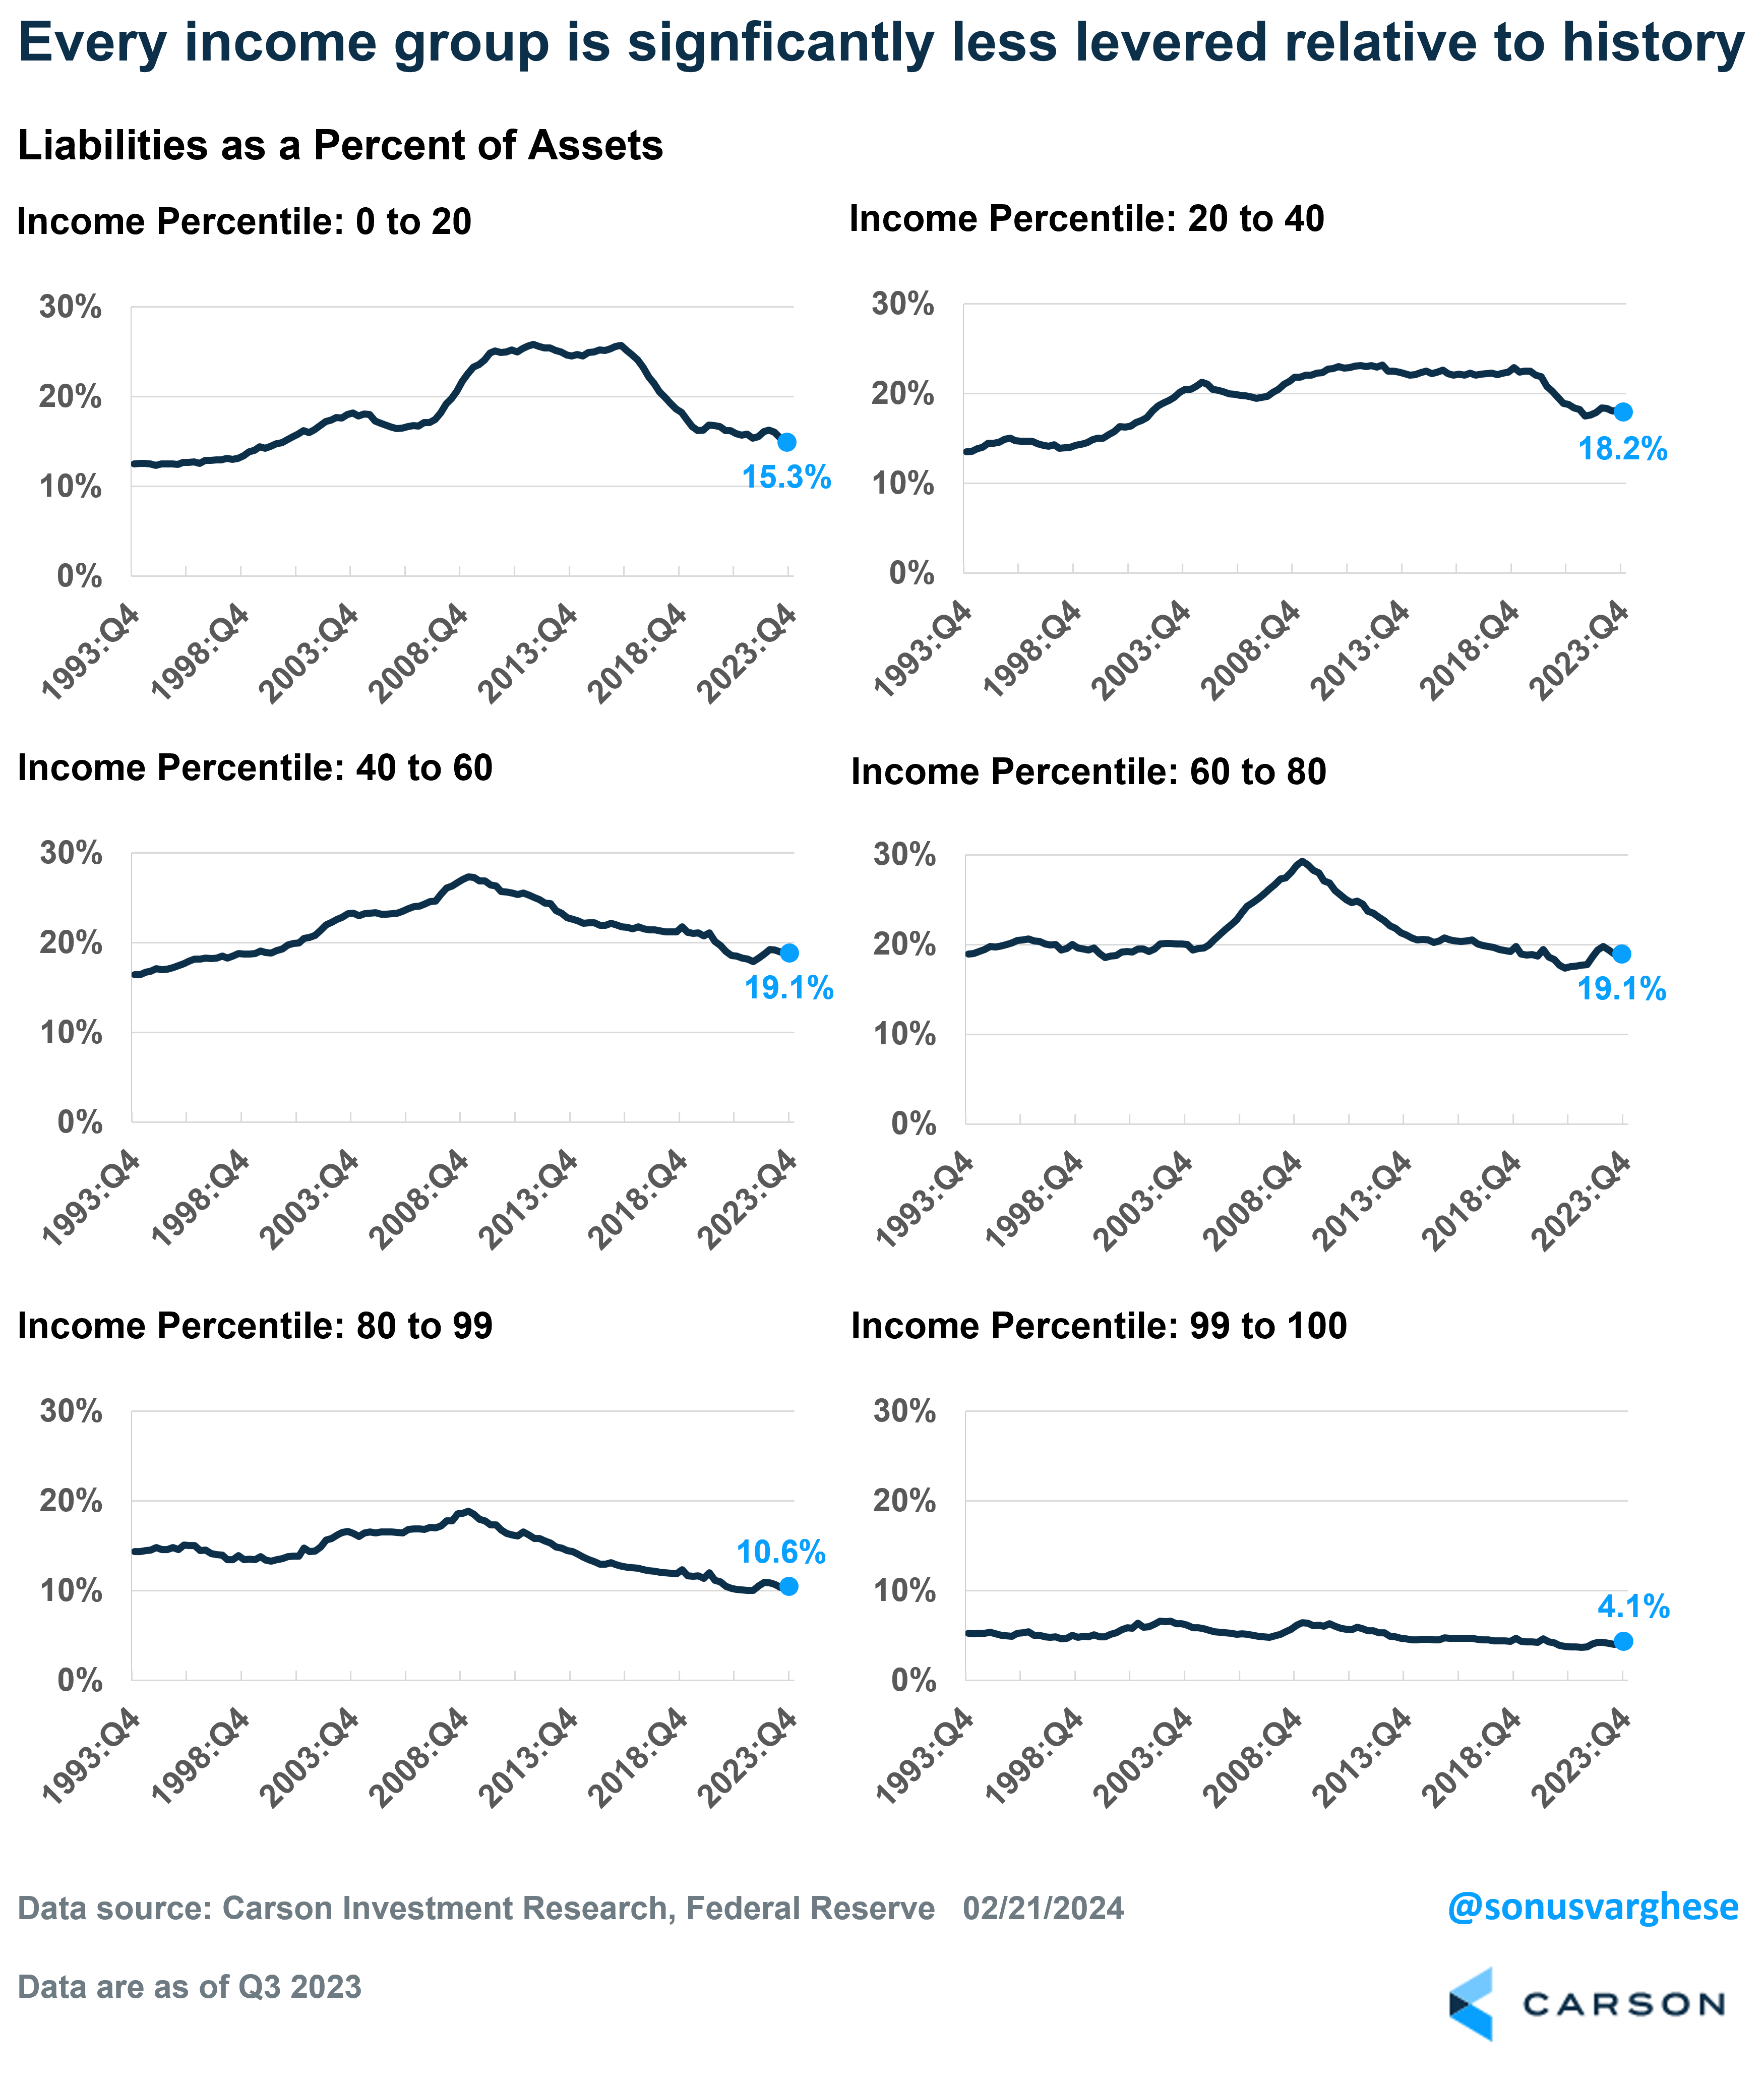
One way to see this is to calculate liabilities as a percent of assets, which is what I did using data from the Federal Reserve. Here’s how it’s changed from Q4 2019 through Q3 2023 (lower numbers are better:
- Fallen from 16.2% to 15.3% for the bottom 20th percentile of income earners
- Fallen from 22.1% to 18.2% for the 20th – 40th percentile of income earners
- Fallen from 20.8% to 19.1% for the 40th – 60th percentile
- Rose from 18.7% to 19.1% for 60th – 80th percentile
- Fallen from 11.4% to 10.6% for 80th – 99th percentile
- Fallen from 4.3% to 4.1% for top 1% of income earners
As you can see, liabilities as a percent of assets have increased across the board over the last four years. The exception are income earners in the 60th to 80th percentile, though even for this group, it isn’t far from where it was in Q4 2009 (19.0%).
Here’s the big picture: every income group is significantly less levered today, with liabilities a much lower percent of assets, than they were a little over a decade ago – when crashing home prices and stock prices after the Great Financial Crisis wreaked havoc on household assets. This was especially devastating for lower income households, who tend to hold a bigger portion of their wealth in real estate. Just looking at the middle income group, i.e. 40-60th percentile, liabilities as a percent of assets hit a peak of 27.3% in 2009. As of Q3 2023, it’s 19.1%, below where it was in 2019 (20.8%) and only slightly higher than where it was in 1999 (18.9%). The blow to household balance sheets after the financial crisis was why the savings rate moved higher over the 2010s, as households were trying to repair balance sheets. The bottom line is that households, across every income group, are in a very different place today.
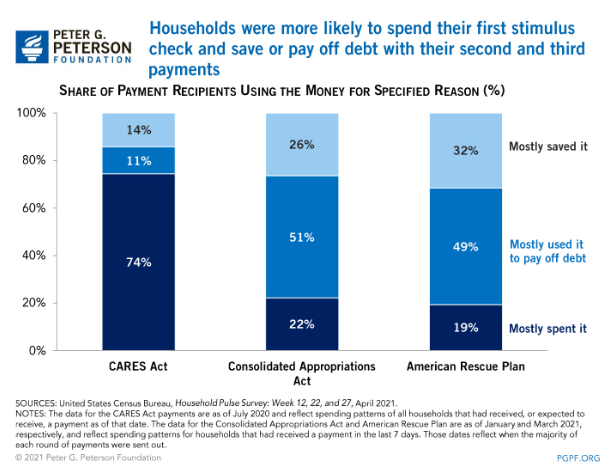
In fact, lower income groups have seen a relatively larger drop in liabilities as a percent of assets. A key factor was the stimulus checks sent out by the government in 2020-2021. It’s common belief that these drove spending, but that was actually true only for the first round of checks in the CARES Act, during the depths of the pandemic crisis in 2020. The second and third round of checks were mostly used to pay down debt or to increase savings. Only about 20% of these checks were used for spending. That’s a big reason why lower income groups have seen a considerable improvement in balance sheets.
Non-managers Have Seen Stronger Wage Growth, Even After Adjusting for Inflation
Along with balance sheet improvement, the reality is that lower income workers have actually seen stronger wage growth since 2020 than higher income workers. The Bureau of Labor Statistics reports average hourly earnings for managers as well as non-managers (“production and non-supervisory workers”). The latter make up about 81% of private workers.
Let’s look at “real” (inflation-adjusted) wage growth for non-managers versus managers. Over the five years prior to the pandemic, real wage growth for managers grew at an annualized pace of 1.2%, and for non-mangers it was 1.3%.
There’s been a stark shift since the pandemic.
From February 2020 through January 2024, non-managers have seen real wages grow 6.1%, translating to an annual rate of 1.5%, which is slightly faster than the pre-pandemic pace of 1.3%. However, real wages for managers have fallen 3.3% over this period, equivalent to an annual rate of -0.9%.
Here’s the non-inflation adjusted data (Feb 2020 – Jan 2024)
- Average hourly earnings for managers rose 12.6%
- Average hourly earnings for non-managers rose 23.5%
- Prices, as measured by the PCE price index, rose 16.5%
As you can see in the chart below, real wage growth for non-managers is running above the pre-pandemic trend (dotted line), whereas it’s well below trend for managers.
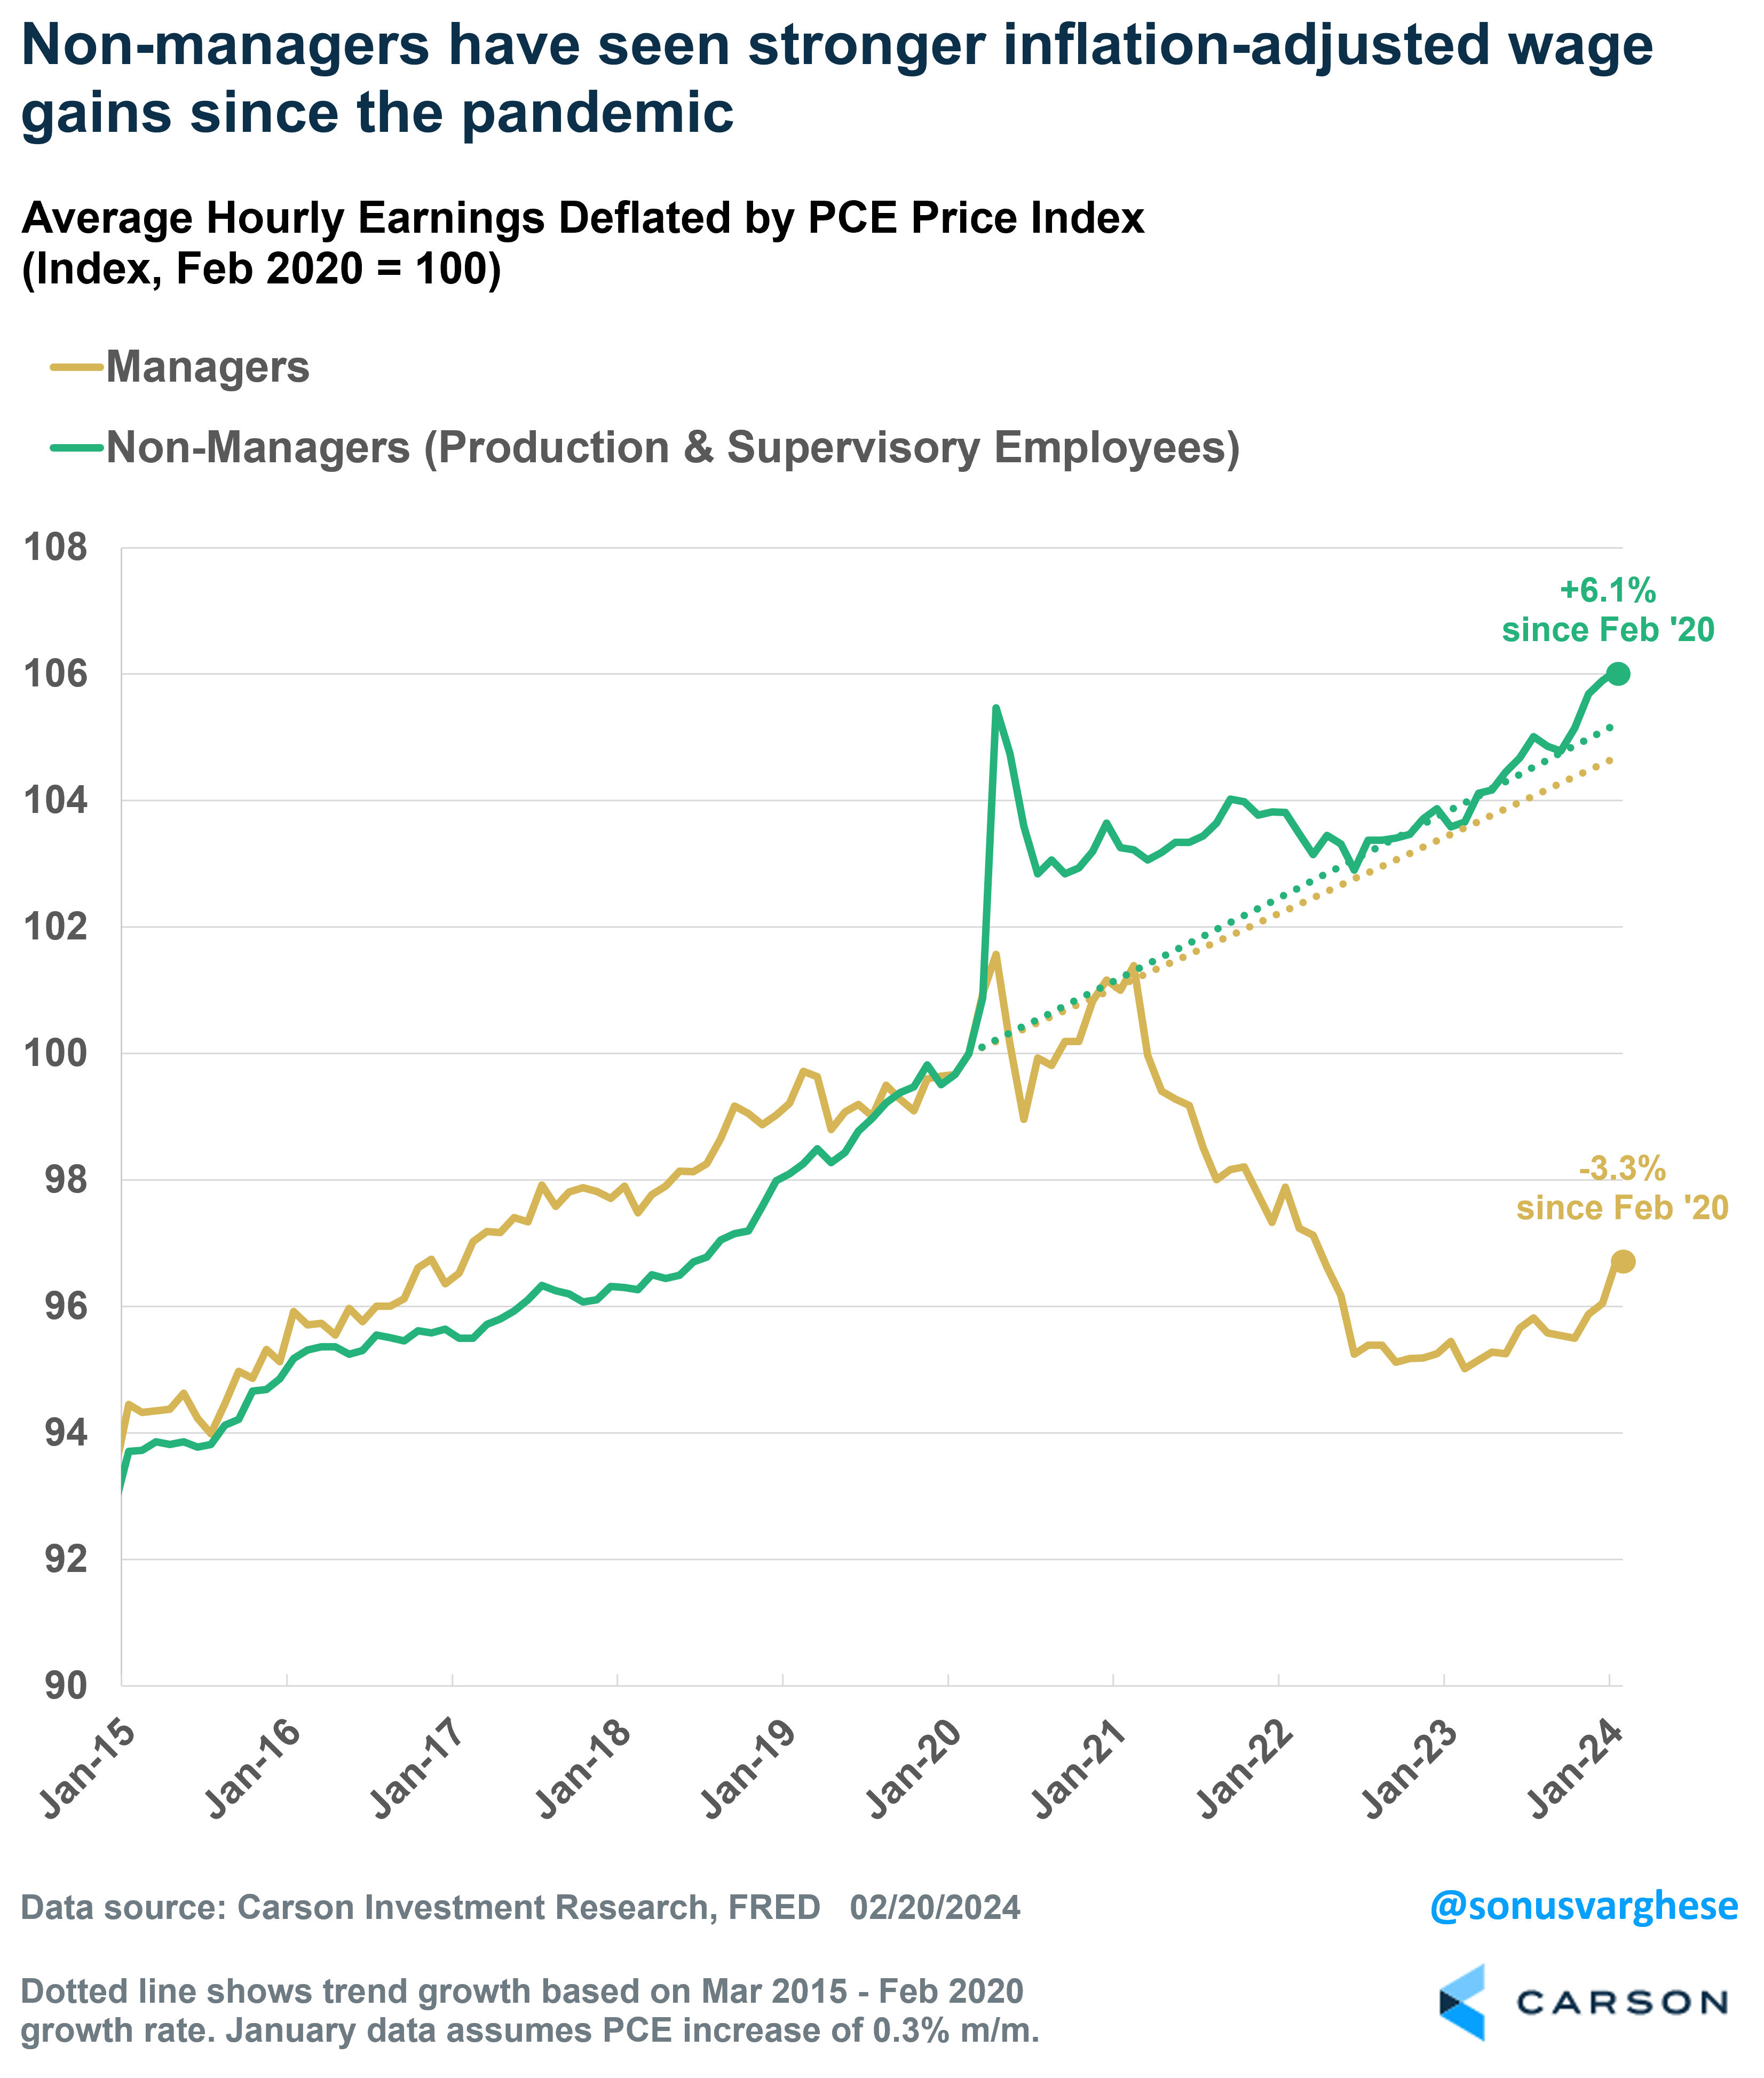
The good news is that both managers and non-managers have recently seen an acceleration in real wage growth (that is, even after adjusting for inflation) – you can see this at the very end of the chart. Over the last three months, real wage growth for managers is running at a 5.1% annual pace, while it’s 3.5% for non-managers. Falling inflation has helped a lot. Combine that with the fact that balance sheets are strong across the board, and we’re looking at consumption continuing to run strong. Which means the economy is likely to run strong.
Ryan and I parsed the latest inflation data, as well as seemingly soft retail sales and industrial production data, in our latest Facts vs Feelings episode. We’re not all that worried, but take a listen to the whole episode to get the full story.
For more of Sonu’s thoughts click here.
2124054-0224-A
