We’ve been getting a lot of questions about the interest rate environment, and especially what might happen to longer-term rates if the Federal Reserve (“Fed”) begins to cut the fed funds rate, even though the short-term increase in rates has been front of mind, but we’ll cover that as well.
I’m going to cut to the chase and share a quick hypothetical and then will look more closely at the numbers. The 10-year Treasury yield is now at about 4.50%. The 3-month Treasury yield is at about 5.38%. Let’s assume the Fed lowers the fed funds rate by 0.25 percentage every three months starting three months from now. Your short-term Treasuries would have about a 5.0% return over the next year. The same pace over the following year, if things went that far, would take about another 1% off that.
Historically, the 10-year Treasury yield declines at about half the rate of the three-month. If that held as a decent estimate, a 10-year Treasury held for a one-year period would have a total return of about 8.5%. You would get less just from the coupon, but the price of a 10-year Treasury is sensitive to rates and even a modest decline can add meaningfully to the return. Of course, if rates rise you get the opposite, offset somewhat by the now more attractive yield, but that’s not the scenario we’re looking at.
Stay on Top of Market Trends
The Carson Investment Research newsletter offers up-to-date market news, analysis and insights. Subscribe today!
"*" indicates required fields
That’s the basic takeaway: The 10-year yield declines at about half the rate of the 3-month yield, but the return of the 10-year Treasury nicely outpaces the 3-month because of its added interest rate sensitivity.
We’ll get back to that, but let’s take a look at near-term concerns. Recently, uncertainty about rates has increased and made many investors nervous after the challenges bonds have faced in recent years. But we think it’s more important to think about 2023 than 2022. 2023 was a wild year for rates, but if you just look at the beginning and end, the 10-year yield didn’t move at all. The 10-year started the year at 3.88%, declined to around 3.40%, and then ran up close to 5% in mid-October, before finally ending the year exactly where it started at 3.88%. 2024 has seen the 10-year yield climbing again, currently near 4.50%. Accompanying bond losses, while fairly mild, are echoing 2022 for some.
We were aggressively positioned for rising rates in 2022 but have been slowly legging into more-rate sensitive bonds and now have a similar level of sensitivity as the Bloomberg US Aggregate Bond Index. While monitoring what’s going on, we think the odds of mean reversion lower in rates are fairly high.
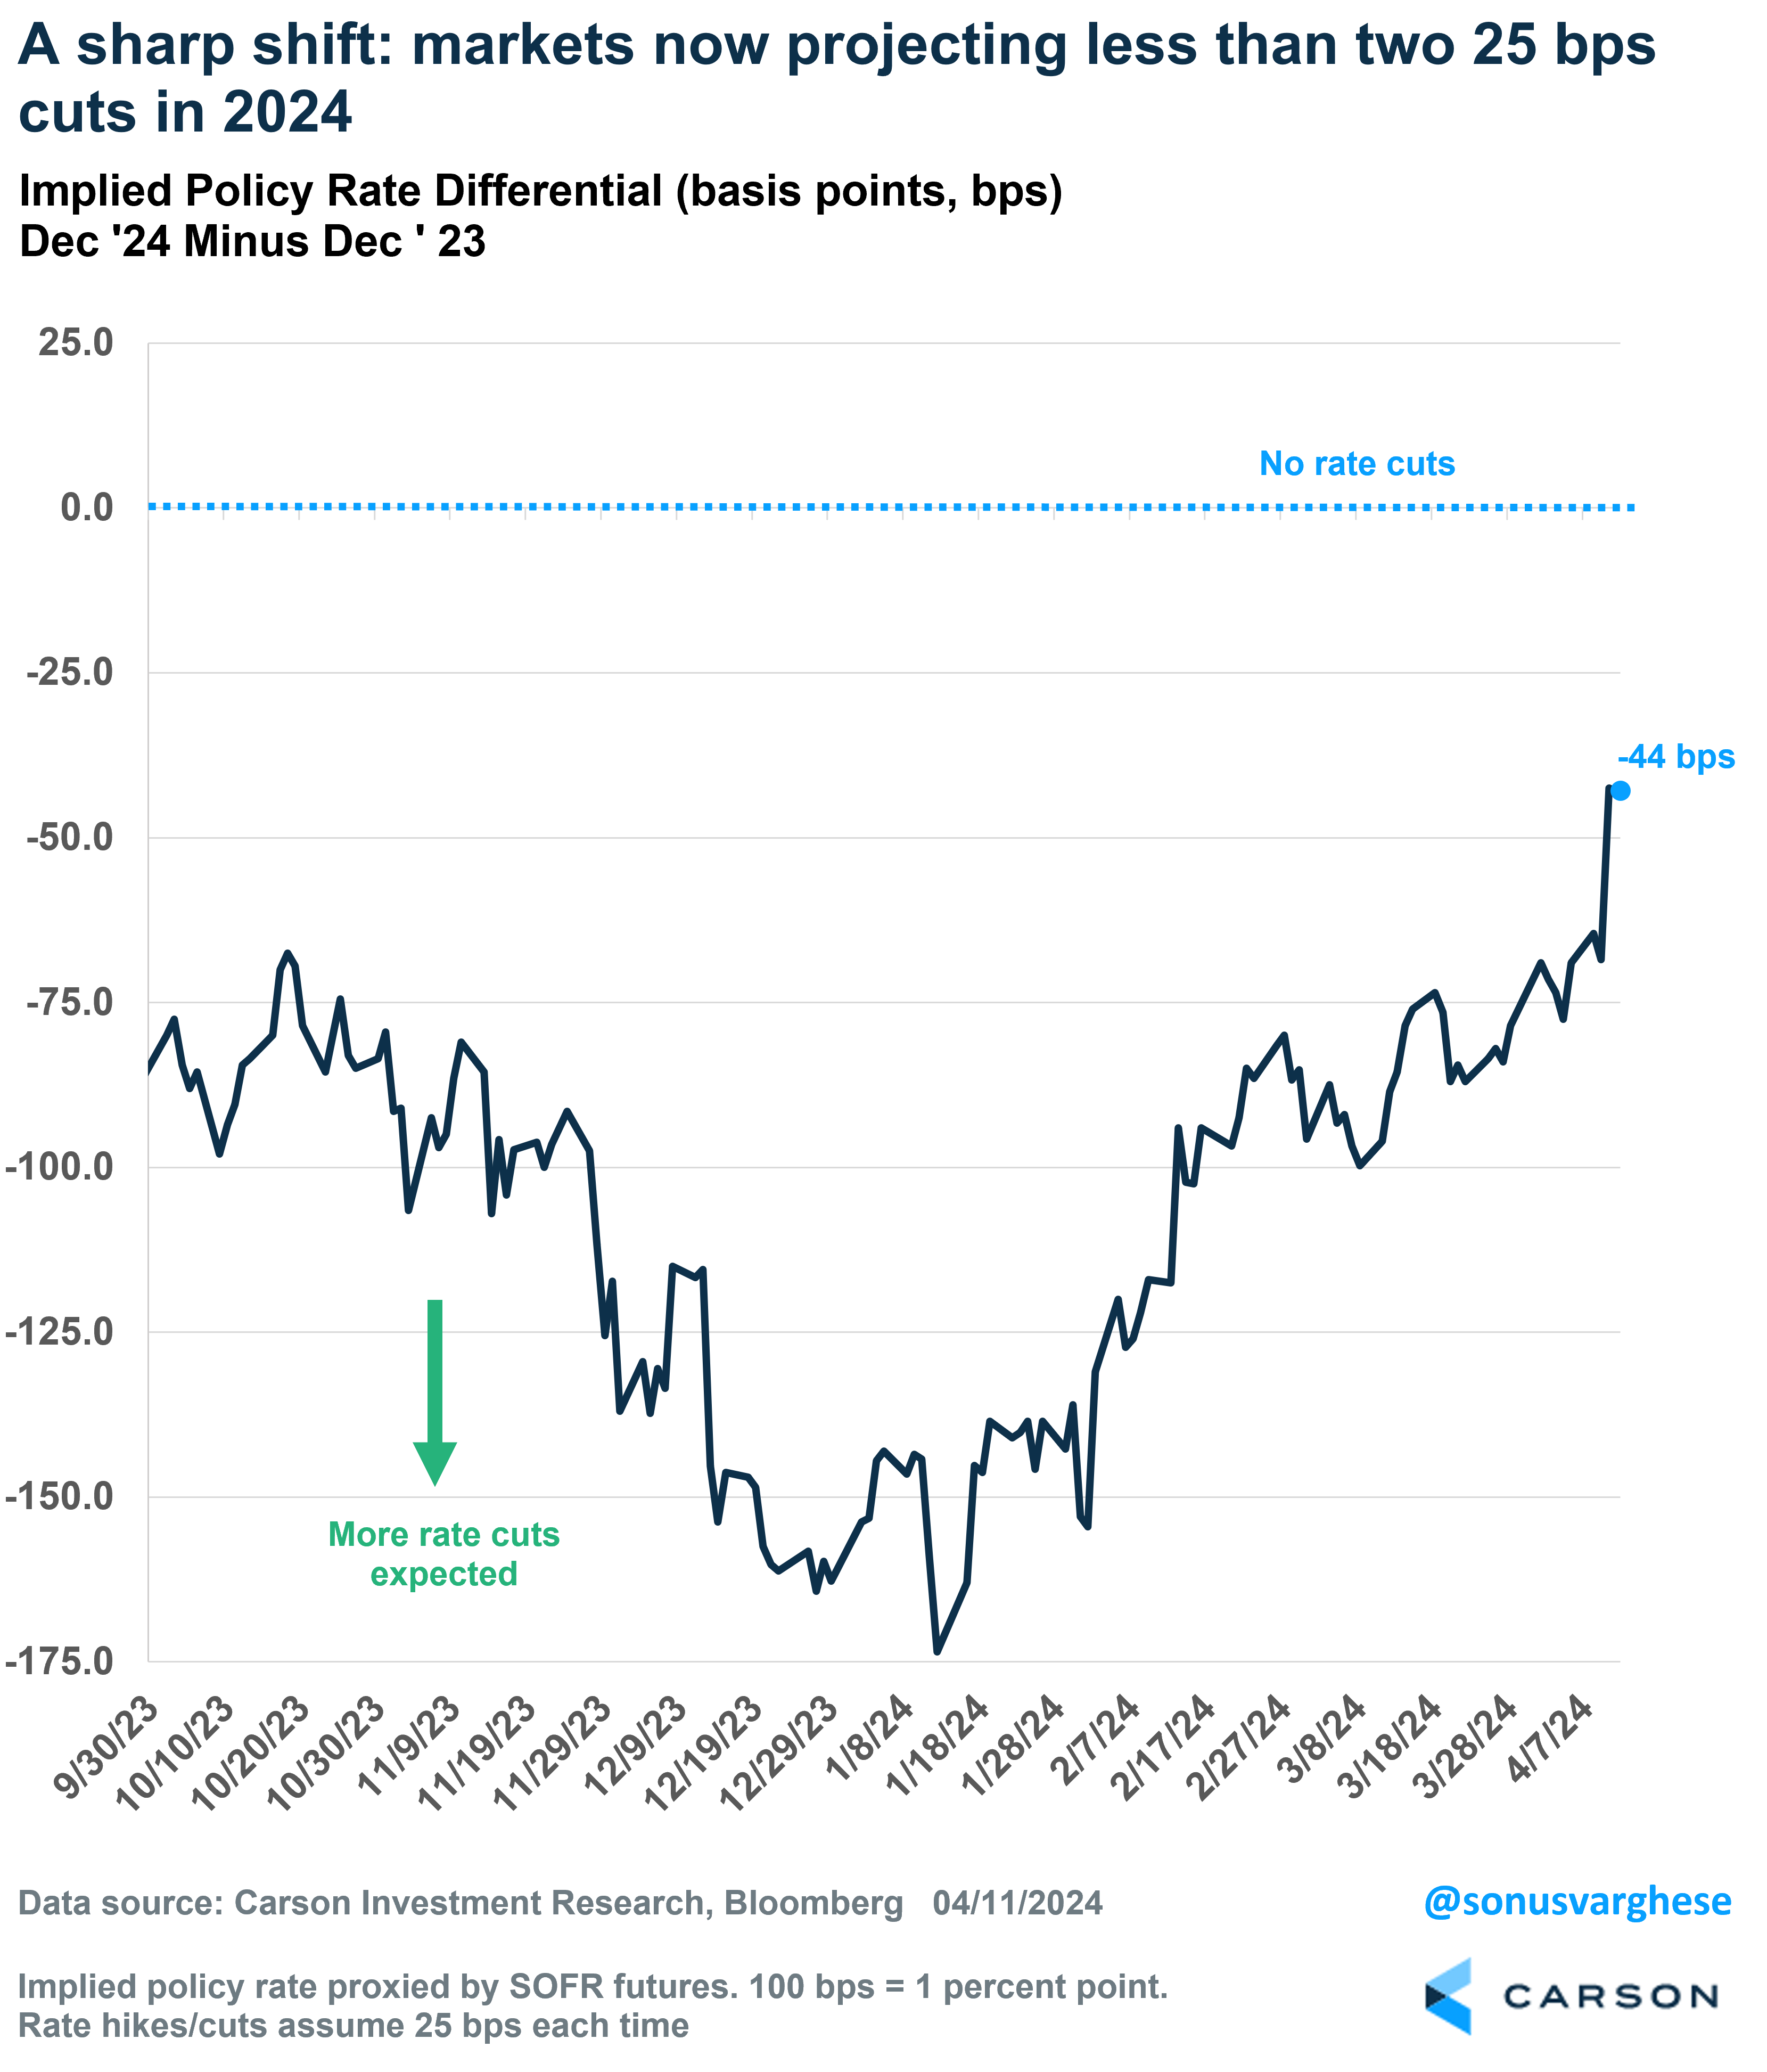
We have written before on why the environment now is very different from 2022. Despite some disappointing inflation data, none of that has changed. Basically all we’ve seen is markets coming back to where the Fed has been all along. In the “dot plots” released following the Fed’s latest policy meeting, the Fed still had a median expectation of three rate cuts in 2023 and another three in 2024.
Of course, the Fed is no oracle and they’ve made their share of big mistakes. (Remember “transitory”?) But while the Fed has been a steady hand at the wheel of late, the market-implied view of rate cuts has swung wildly, going from three expected 0.25 percentage point cuts in in the fall of 2023, to as many as seven early this year, and now sitting at about two for the year.
When it comes to our outlook, we’ll hold roughly with the Fed for now. We still view the downward trend for inflation as broadly intact amidst an economy that is not overheating with recent surprises driven by some unusual factors within the data. (See my colleague Sonu Varghese’s, VP, Global Macro Strategist, insightful analysis of the most recent inflation numbers here.) The labor market remains solid but wage growth is moderating. Markets have some reason to be cautious but we believe they are overreacting.
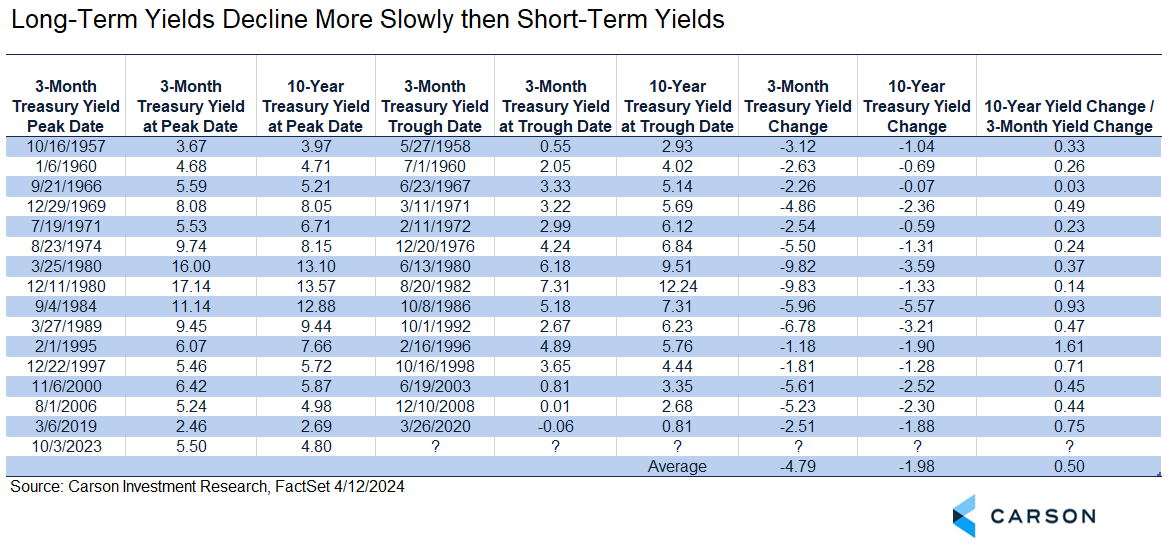
If the Fed is able to follow through on its expectations, what can we expect for longer-term yields? Instead of looking at the fed funds rate, we took a look at major declines in the 3-month Treasury yield and what’s correspondingly happened to the 10-year yield over 15 rate cute cycles below. The Fed only started regularly announcing policy decisions following its meetings in 1994 and over the years has emphasized different policy tools. Focusing on the 3-month Treasury yield gave us the best apples to apples comparison.
We did look at the peak in the 3-month Treasury relative to the first cut where data was available. On average, the market has been pretty good. The fed funds rate is very short-term (overnight) so you would expect the peak for the 3-month Treasury yield to happen about three months before the first cut. In the periods of declines below for which we have data, the peak in the three-month Treasury yield happened a median of 88 days before the first cut.
Starting with the big picture, the easiest thing to notice is that short-term yields are much more volatile than long-term yields, although both generally move in the same direction. Sort-term yields are primarily influenced by Fed policy. Long-term yields are influenced by Fed policy, but are also heavily driven by growth and inflation expectations. (The Fed is also influenced by growth and inflation expectations, so it’s all a little circular.) Fed policy can turn on a dime. Longer-term expectations change more slowly.
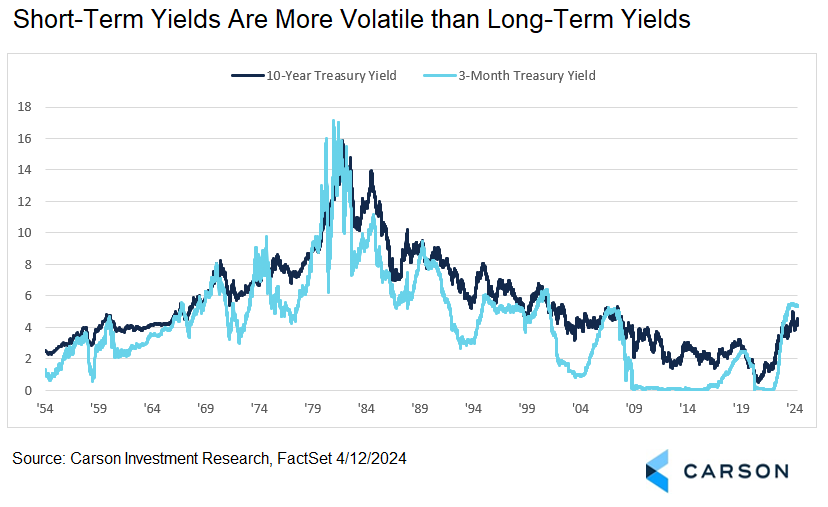
Here are major declines in the 3-month Treasury yield, from start to end. You can eyeball how they correspond to the chart above.
The major takeaways:
- Cutting cycles from start to end vary a lot in duration. We wanted to give a shorter-term perspective, but on average these periods of key yield declines, using the three-month yield as a gauge, typically last 1-2 year. But that doesn’t take into account how long yields stay low.
- 1995 is probably the best comparison for a “soft landing” scenario, since most of the other major cutting cycles occur around recessions. (2019 was also a soft landing scenario but is tied into the pandemic-related decline.) The pace of the decline was about 1.20 percentage points over 380 days, so a pace of a little over four cuts per year.
- It’s interesting that 1995 was the only case where the 10-year fell faster than the 3-month. But in general, the 10-year falls more slowly.
- The pace of 10-year declines can vary quite a lot and 1995 is throwing off the data a little. Excluding 1995, the 10-year decline averages 42% of the 3-month decline.
Our aim is to always be good “market listeners” and be aware of what the market is telling us that we don’t already know, but markets also have a tendency to be reactive, which can create opportunities. For the current market, we think the reaction to recent inflation data has now become an overreaction, but we are always monitoring the possibility that we are wrong and position for that possibility. Especially with the recent rise in yields, we are more focused right now on what is likely to happen if rates decline than if they rise further.
For our current take on inflation, the Fed, and markets, give a listen to Ryan and Sonu in our latest Facts vs Feeling podcast.
For more content by Barry Gilbert, VP, Asset Allocation Strategist click here.
02199864-0424-A