
“There is no such thing as average when it comes to the stock market or investing.” -Ryan Detrick
You might have heard by now, but the CBOE Volatility Index (better known as the VIX) made a new 52-week low earlier this week and closed beneath 14 for the first time in more than three years. This has many in the financial media clamoring that ‘the VIX is low and this is bearish’.
They have been telling us (incorrectly) that only five stocks have been going up and this was bearish, that a recession was right around the corner, that the yield curve being inverted was bearish, that M2 money supply YoY tanking was bearish, and now we have the VIX being low is bearish. We’ve disagreed with all of these worries and now we take issue with a low VIX as being bearish.
What exactly is the VIX you ask? I’d suggest reading this summary from Investopedia for a full explanation, but it is simply how much option players are willing to pay up for potential volatility over the coming 30 days. If they sense volatility, they will pay up for insurance. What you might know is that when the VIX is high (say above 30), that means the market tends to be more volatile and likely in a bearish phase. Versus a low VIX (say sub 15) historically has lead to some really nice bull markets and small amounts of volatility.
Back to your regularly scheduled blog now.
The last time the VIX went this long above 14 was for more than five years, ending in August 2012. You know what happened next that time? The S&P 500 added more than 18% the following 12 months. Yes, this is a sample size of one, but I think it shows that a VIX sub 14 by itself isn’t the end of the world.
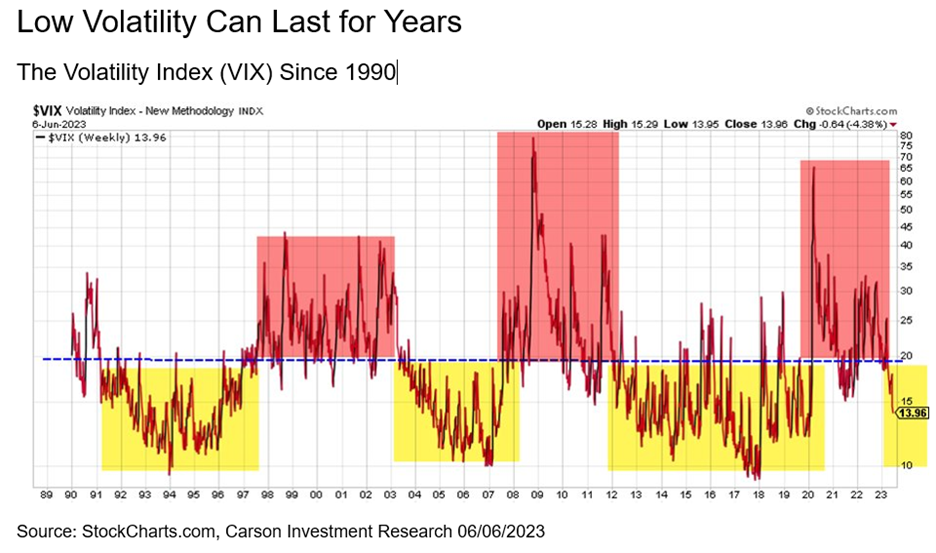
One of the key concepts around volatility is trends can last for years. What I mean by this is for years the VIX can be high and for years it can be low. Since 1990, the average VIX was 19.7, but it rarely trades around that average. Take another look at the quote I’ve used many times above, as averages aren’t so average.
Stay on Top of Market Trends
The Carson Investment Research newsletter offers up-to-date market news, analysis and insights. Subscribe today!
"*" indicates required fields
This chart is one I’ve used for years now and I think we could be on the cusp of another low volatility regime. The red areas are times the VIX was consistently above 20, while the yellow were beneath 20. What you also need to know is those red periods usually took place during bear markets and very volatile markets, while the yellow periods were hallmarked by low volatility and higher equity prices. Are we about to enter a new period of lower volatility? No one of course knows, but if this is about to happen (which is my vote), it is another reason to think that higher equity prices (our base case as we remain overweight equities in our Carson House Views) will be coming.
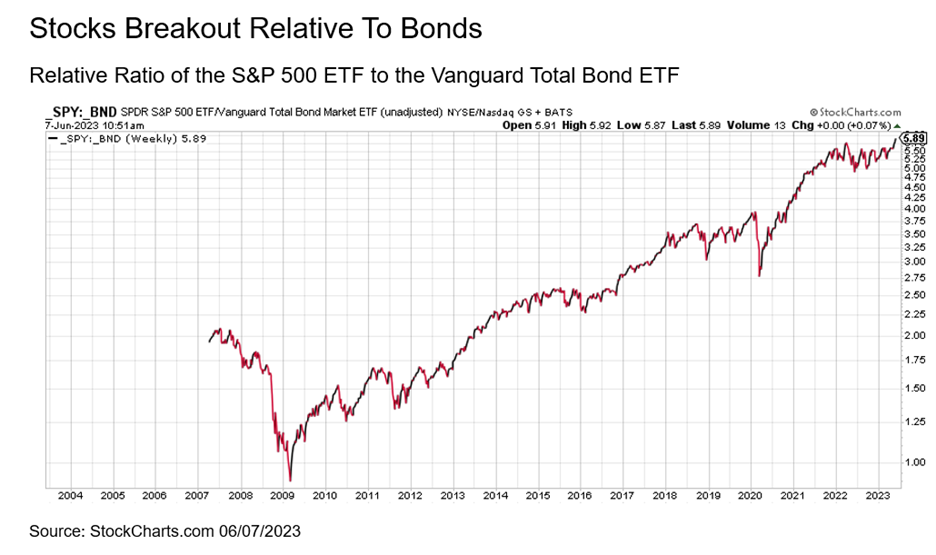
Lastly, I’ll leave you on this potentially bullish point. We like to use relative ratios to get a feel for how one asset is going versus to another. We always want to be in assets or sectors that are showing relative strength, while avoiding areas that are weak.
Well, stocks just broke out to new highs relative to bonds once again. After a period of consolidation during the bear market last year, now we have stocks firmly in the driver seat relative to bonds. This is another reason we remain overweight stocks currently and continue to expect stocks to do better than bonds going forward.
For more of our views on why both stocks and the economy are on better footing than you likely keep hearing on tv, please be sure to listen to our latest Facts vs Feelings podcast. Sonu and I have so much fun doing these and this week was another good time. Enjoy!