
It may be a little early to do a post-mortem on the February 19 – April 8, 2025 near-bear market, but maybe it’s not too early to find perspective that we didn’t have “in the moment.” Despite the unusual driver of this particular near-bear market, really just a single actor (who also gets credit for the rebound if he gets blamed for the downturn), the market itself has acted fairly predictably, and maybe that’s the main takeaway. Every downturn has its own character and will not simply hew to history, but knowing and understanding market history, especially in the heat of the moment, is a powerful tool.
Diversifiers Work, Especially If You Diversify Them
I’ve shared the table below a few times now. It shows which diversifiers worked (or didn’t) in major drawdowns since 1998’s 19.2% S&P 500 decline. What’s worked best has depended on the market environment. Most generally, bonds have fared well and commodities have fared poorly in downturns, but sometimes it’s been dramatically different. (It makes sense that commodities have underperformed — stock downturns often happen during periods of economic weakness, when lower demand weighs on commodity prices.)
If the most recent near-bear market is indeed in the books, then intermediate Treasuries will win best diversifier this time around for the limited number of assets in the chart. Intermediate Treasuries generally work fairly well when long Treasuries do, but long Treasuries’ higher rate sensitivity usually makes them the more attractive diversifier. This time, being in quality (Treasuries) was a good idea — Treasuries outperformed both investment-grade and high yield-corporates as well as mortgage-backed securities. But being in long maturity Treasuries was not the top idea due to only an incremental rate move at the long end of the yield curve. Better to be in intermediate Treasuries. Also note that long bonds, short maturity Treasuries, and gold could have all added a little ballast to a portfolio as well. But broad commodities (which is 30% energy) lagged.

From a portfolio perspective, the takeaways are that diversification is important, but it’s not enough to rely on a single source of diversification in a portfolio all the time. It’s important to understand what environment you’re in, and if the environment is uncertain, as we think the current one is, having exposure to different kinds of diversifiers can be beneficial.
Pay Attention to Sentiment
If you follow this space, you know that Ryan Detrick, Carson’s Chief Market Strategist, has been providing an on-going commentary on market sentiment throughout the downturn. As Ryan’s colleague for a little under a decade, I’ve learned that whatever else I’m thinking or feeling, I need to check it against the data that Ryan provides. Here’s some of the real-time analysis from Ryan’s blogs along with a few charts.
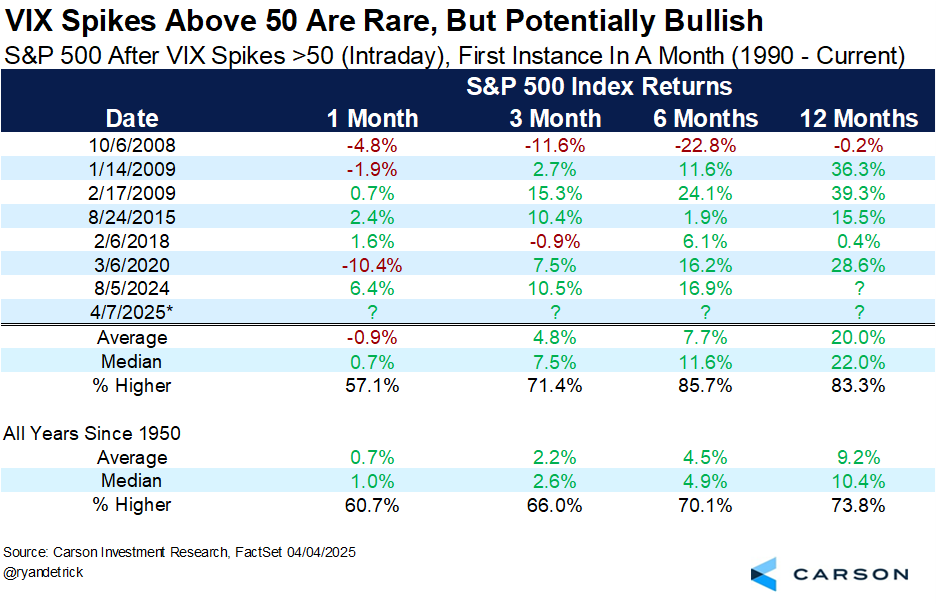
April 8: “The VIX soared to above 60 yesterday morning, hitting levels that historically have marked major bottoms for stocks. We’ll keep this simple, but when the VIX hits 50 for the first time in a month it has probably been preceded by poor performance driven by panic, likely suggesting better times are coming. In fact, the S&P 500 has gained more than 20% on average a year later after the VIX spikes above 50.”
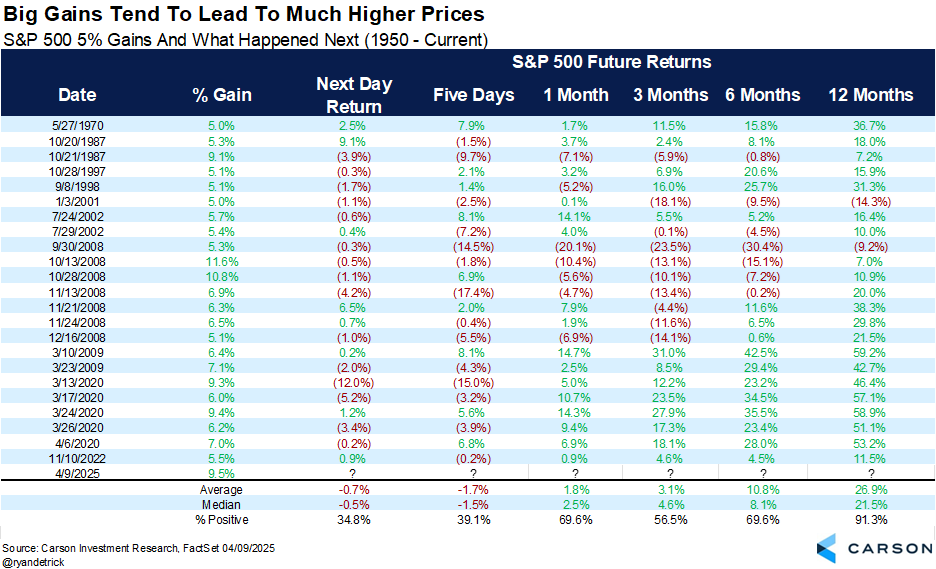
April 16: “Stocks were flirting with a bear market until President Trump put a pause on all reciprocal tariffs (excluding China) for 90 days on Wednesday, April 9. The S&P 500 responded by gaining 9.5% in one day, the third best single day since World War II. Like a beach ball under the water, once it gets some momentum, it can really start moving. In fact, we found 23 other times (since 1950) the S&P 500 gained more than 5% in one day and the future returns were quite impressive longer term, with stocks up a year later more than 91% of the time and up nearly 27% on average.”
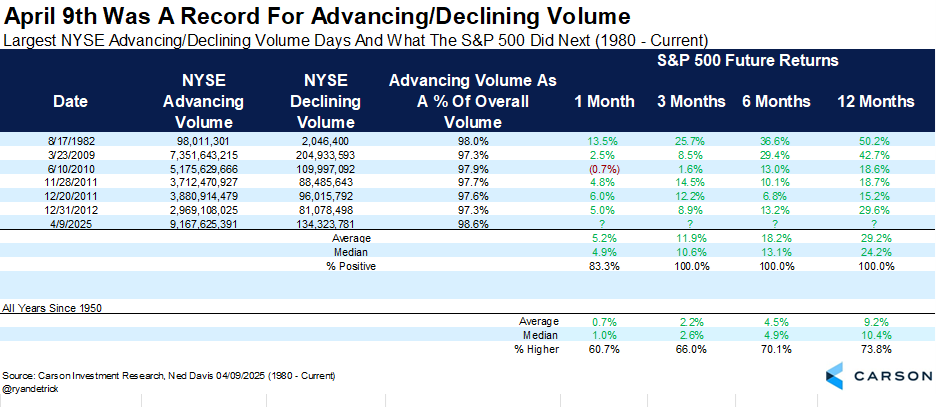
April 16: “It wasn’t just that last Wednesday saw huge gains. Nearly all the volume on the NYSE was for stocks moving higher as well (something we call a buying thrust). In fact, advancing volume was 98.6% of the total volume, the most in history (using reliable data back to 1980). We found six other times that had extreme levels and the S&P 500 was higher 3-, 6-, and 12-months later every single time. Check out some of those dates. August 1982 and March 2009 really stand out as some historic buying opportunities. This could be another clue that the sellers scared by currently known risks have exhausted themselves and higher prices over the intermediate term could be possible.”
April 22: “The recently released Bank of America Global Fund Manager Survey showed a record number of participants who intend to cut US exposure, as shown in the chart below. The survey also showed the largest two-month jump in cash since April 2020 and the 4th highest recession expectations ever. Given this survey looks at managers who manage actual portfolios, this is a very solid potential contrarian indicator.”

All I can say is Ryan, my friend, I hope I haven’t marked the turning point in sentiment by highlighting your calls. And for our readers, Ryan, Carson VP Global Macro Strategist Sonu Varghese, and the rest of the Carson team will continue to share our thoughts and analysis throughout the year. We won’t always be right, we won’t always be wrong, but you’ll always know what we’re thinking and why and it will be based on facts, not feelings.
Historically, Losers on the Way Down Are Often Winners on the Way Up
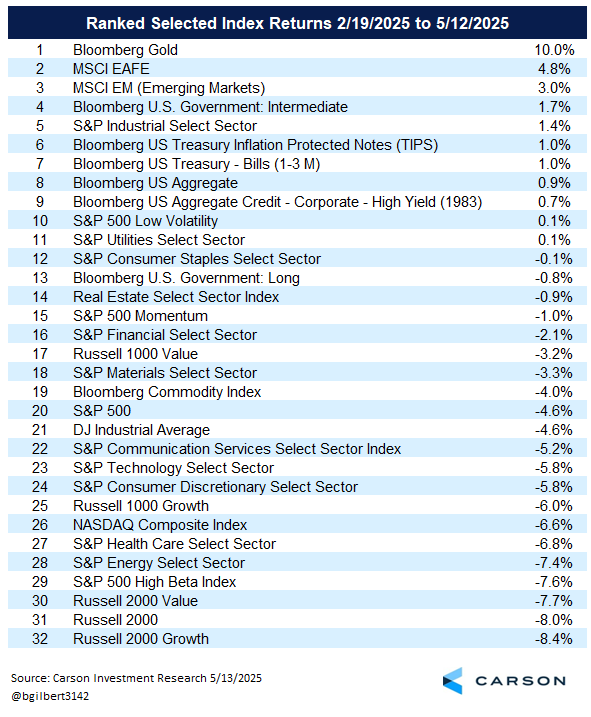
This is more a short-term observation. It took a long time for tech to come back from the tech bubble bursting and for financials to come back from the Great Financial Crisis. But during the immediate rebound from a selloff, the losers in the selloff can often be the winners in the rebound. Below are charts ranking 32 major indexes during the sell-off and the rebound as of Monday. It includes broad stock indexes as well as stock size, sector, style, and region; a few bond indexes; and a couple of commodity indexes.
It’s easy to see that many of the losers in the sell-off have flipped to winners in the rebound. In fact, the bottom five in the downturn are all in the top six for the reversal. Part of that is just “beta,” the inherent sensitivity of some of these indexes to market ups and downs, but that’s not the whole story.
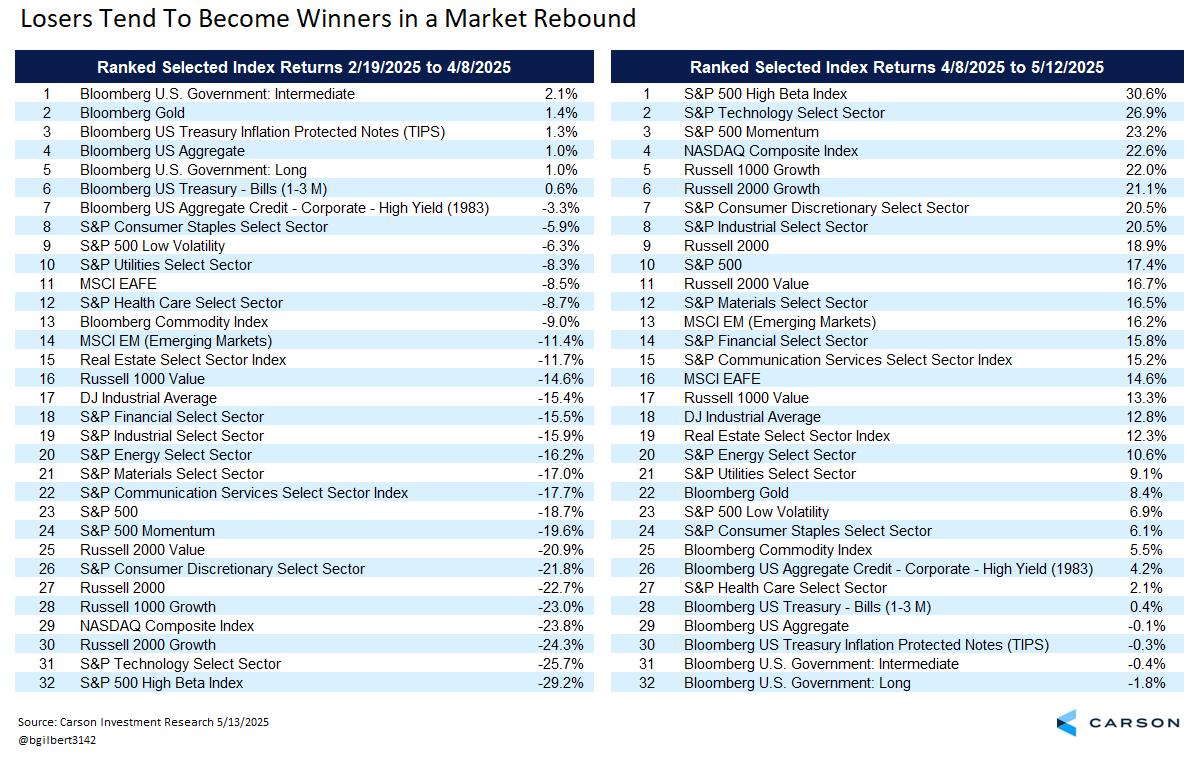
Keep in mind that larger decliners need to make up extra ground on the way up. Something that is down 10% only needs to climb 11% to get back to flat. But down 20% has to go up 25% and down 50% has to go up 100%. As a result, as seen below, the net winners among equities have more in common with the first chart above than with the second, although we’re not all the way back yet.
For me, one of the grand takeaways from all of this is just reinforcement of the basic lesson that investing takes patience. Being “risk tolerant” doesn’t mean that you’re not going to feel bad when markets are down. It means that you know downturns are going to occur, you know you’re going to feel bad, and you are prepared to ride out the emotions. That may be the most important lesson for being an effective long-term investor. I can almost promise you (but you know with compliance reading this I can’t make a full promise) that when we have the next major decline, whether tomorrow, in a month, year, or longer, it’s going to feel like the downturn is different from every other and that the normal rules don’t apply. It always does — that’s just the way volatility works. But as Ryan likes to say, volatility is the toll we pay to invest.
7961647.1. – 5/14/25 A
For more content by Barry Gilbert, VP, Asset Allocation Strategist click here.
