Consumer sentiment has collapsed irrespective of which metric you look at. The University of Michigan consumer sentiment index just crashed to the lowest level in the survey’s history – even below what we saw during the depths of the Great Financial Crisis in 2008-2009, Covid in April-May 2020, and even the stagflationary 1970s. Surely things aren’t that bad? We’re nowhere close to a recession, and the stock market just made a new all-time high. Hiring is weak, but layoffs are running really low – yes, it’s a tough job market if you’re unemployed and looking for a job, but you’re probably OK if you have a job.
The confidence index from the Conference Board doesn’t look as bad, but only relatively speaking – it’s also fallen close to the Covid lows. Historically, the Conference Board measure tends to be more correlated with the labor market (hence the massive collapse in 2008-2009).
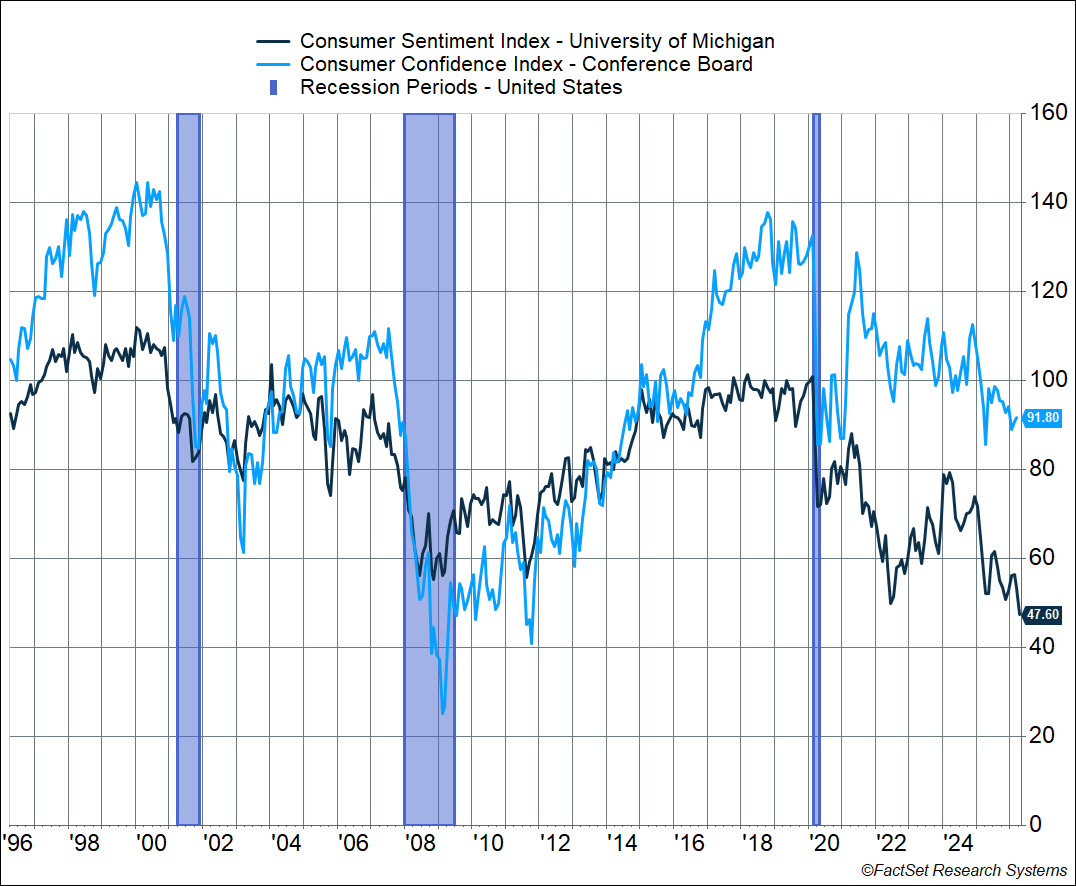
Usually, sentiment takes a hit when gas prices rise (I’ve written about this in the past), but that typically tends to be short-lived (since gas prices usually head back down). But the current collapse in sentiment goes beyond that.
What’s interesting, if you look back at the previous chart, is that sentiment collapsed during the Covid months in 2020 but recovered quickly after. In fact, the Conference Board’s index recovered to pre-Covid levels by June 2021. The Michigan Index didn’t quite recover to that point, but this index tends to be more colored by politics, and we got a new president in January 2021 (which is why it’s useful to look at more than one measure).
However, sentiment collapsed from mid-2021 all the way through mid-2022. What happened? Inflation.
Inflation picked up in 2021 and peaked in mid-2022. Sentiment recovered over the next couple of years but took another leg down in 2025 amid the tariff chaos (more inflationary pressures) and yet another leg lower recently amidst the energy shock from the US/Israel-Iran war.
Stay on Top of Market Trends
The Carson Investment Research newsletter offers up-to-date market news, analysis and insights. Subscribe today!
"*" indicates required fields
Inflation is a tax on wages
Consumers don’t like inflation, which acts as a tax on wages. I looked at average hourly earnings growth from February 2020 onwards (just prior to the pandemic), but these sorts of analyses always run into some version of this criticism: “That’s just the aggregate. Lower-income workers are worse off.”
I separated average hourly earnings for managers from non-managers (“production and non-supervisory workers” as the Bureau of Labor Statistics calls them) and then adjusted these for inflation using the personal consumption expenditures (PCE) inflation index. I used PCE because it’s a broader measure of inflation than CPI. CPI has a third of the basket allocated to rents versus 16% in the PCE basket. Keep in mind that 2/3rds of American households own homes, and most of them own one with a very low mortgage rate that was purchased pre-2022 – rents matter, but perhaps not to the extent captured in CPI.
Here’s the non-inflation-adjusted “nominal” data. From February 2020 through March 2026:
- Average hourly earnings for managers rose 23%
- Average hourly earnings for non-managers rose 34%
- Prices, as measured by the PCE price index, rose 25%
What’s interesting is that wage growth for non-managers has exceeded the pace of inflation over the entire period, while that for managers has lagged. One big reason is that a lot of the Covid-related stimulus checks benefited lower-income earners more, and the other reason is the tight labor market of 2022-2023 that boosted wage growth above trend (lower-income workers tend to do better amid a tight labor market).
The chart below shows inflation-adjusted or “real” wage growth for managers and non-managers, relative to the pre-pandemic trend (2015 March through 2020 February). Real wage growth for non-managers (green line) got a big boost from the Covid-stimulus and proceeded along the pre-pandemic trend. On the other hand, real wage growth for managers (yellow line) collapsed well below trend when inflation picked up in 2021 and only started recovering from 2023 (as the labor market started cooling). However, real wage growth for managers has run below trend over the past year, and for non-managers it’s fallen. As of March 2026:
- Managers: +0.5% year-over-year versus 1.1% pre-pandemic
- Non-mangers: -0.1% year-over-year versus 1.3% pre-pandemic
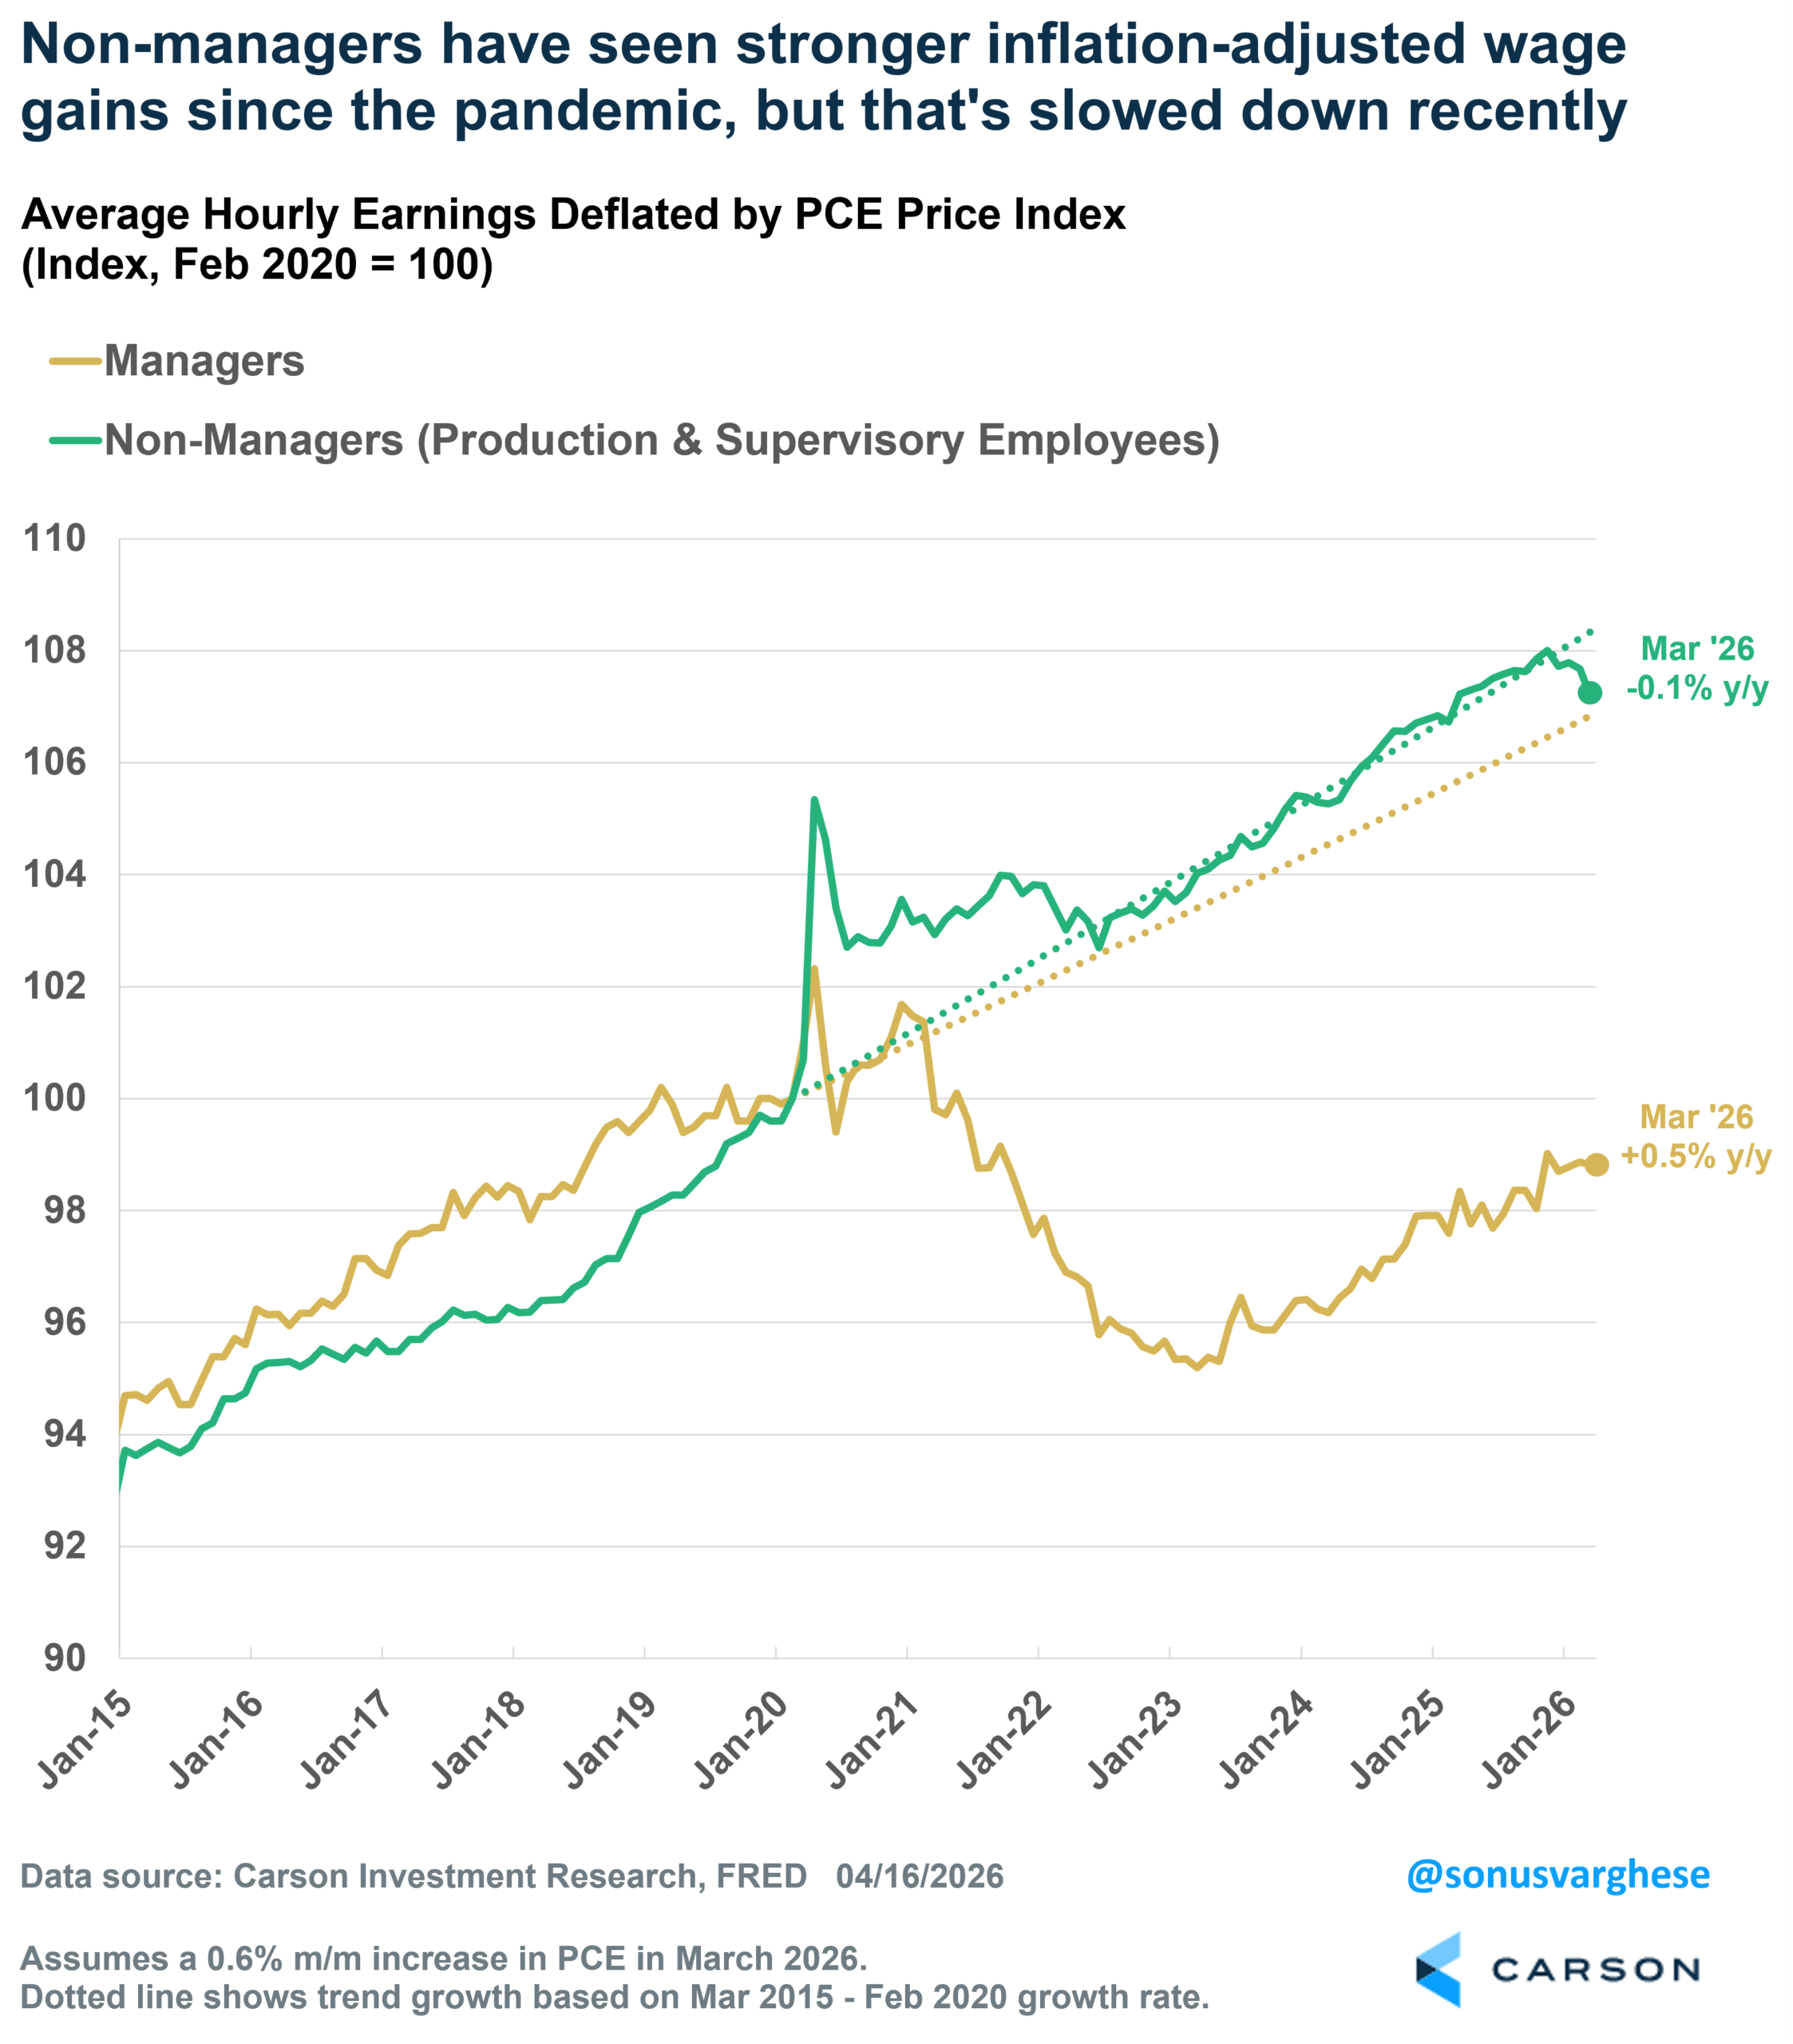
Let’s look at just the past year. Nominal wage growth has been relatively strong, especially relative to the five years before the pandemic hit:
- Managers: +4.0% versus 2.7% pre-pandemic
- Non-managers: +3.4% versus 2.9% pre-pandemic
The problem is that inflation averaged 1.5% pre-pandemic, resulting in fairly strong real wage growth. But over the past year, inflation’s run at a 3.5% pace, erasing most of the wage gains.
As one can imagine, workers are likely to give themselves a pat on the back for strong wage growth, but are likely to blame someone else for high inflation. And inflation eating away at wages is a recipe for poor sentiment.
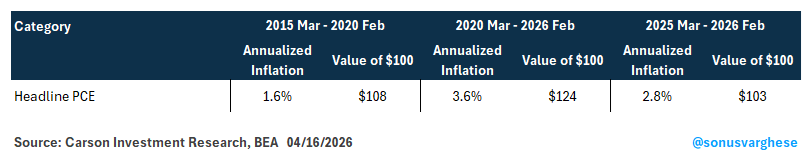
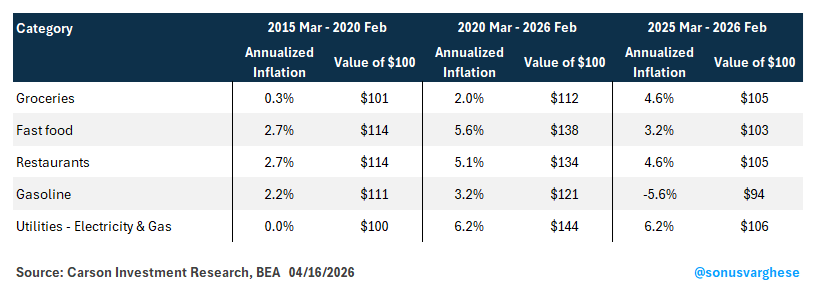
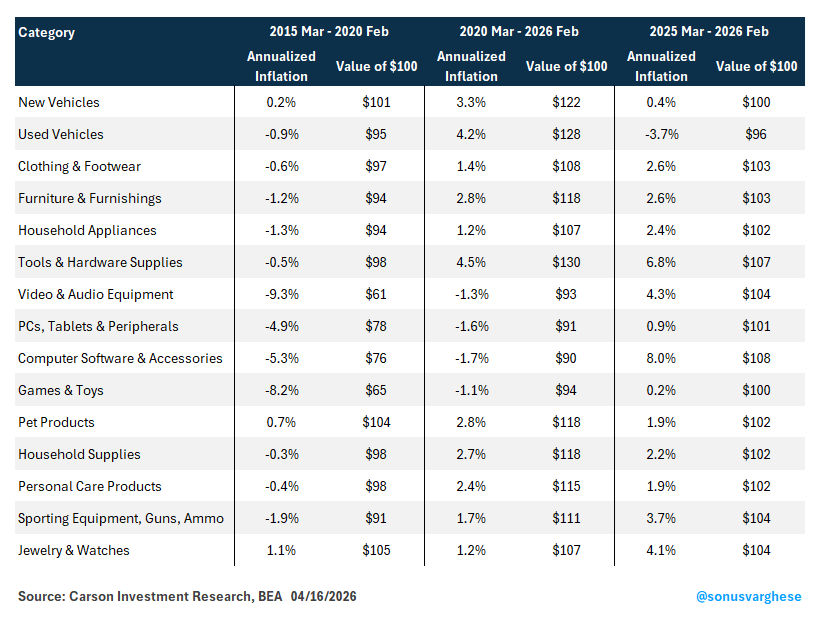
What’s important here is that higher inflation is not just about gasoline prices. There’s broad-based inflation across goods and services. I thought it’d be interesting to look at a few major categories and compare inflation rates across three periods:
- 5-years pre-pandemic: 2015 Mar – 2020 Feb
- Last 6 years: 2020 Mar – 2026 Feb
- Last 1 year: 2025 Feb – 2026 Feb
The pre-pandemic period is important because consumers are likely to contrast their current experience of inflation with what happened 5-10 years ago.
I’m going to separate the tables into 3 broad categories: food and energy, other goods, and services. To help clarify the impact of inflation and show how the price level has moved, I also show how much $100 worth of the item at the start of the period would have increased.
Here’s headline inflation, though, as we’ll go on to see below, this hides the impact we all feel from higher prices on very salient everyday items.
Next up: food and energy. You’re probably not surprised to see that a restaurant meal that cost $100 in early 2020 now costs $143, i.e., a 43% increase. In contrast, a restaurant meal that cost $100 in March 2015 would have increased to $112 in February 2020. The recent increase is much more perceptible and salient than what happened pre-pandemic.
On the energy front, gasoline prices fell over the year through February (before the recent surge), but this was more than offset by higher utility bills (electricity and gas). Utilities are an underrated source of pressure – over the five years pre-pandemic, it barely moved, but over the past six years, a $100 utility bill in February 2020 would’ve turned into $155 (a 55% increase). The last year alone saw a 6% increase.
Here’s a look at several goods. Almost all of them saw prices fall pre-pandemic, i.e., deflation. That’s reversed since the pandemic hit, except for a few categories that still saw deflation. But over the past year, every category listed below except for used cars has seen prices pick up by an average of about 3%, thanks to tariffs.
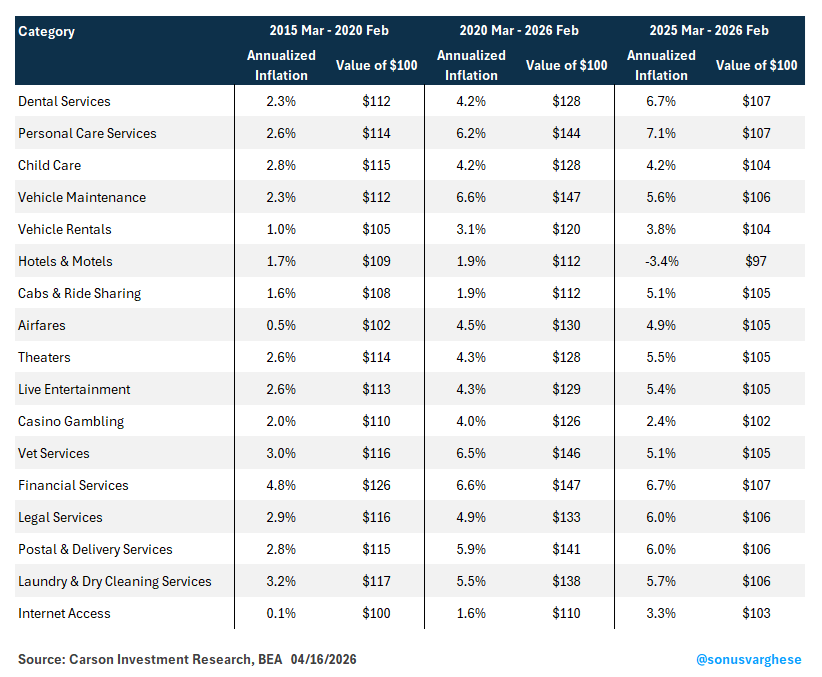
Finally, services (other than housing) are where a lot of households spend a big chunk of their wallets. Almost across the board, you can see how inflation has run at about double the pre-pandemic pace (much more so for airfares and internet access). And in most cases, inflation has picked up over the past year, exacerbating the problem.
Take something as mundane as laundry and dry-cleaning: $100 worth of laundry and dry-cleaning in early 2015 would’ve been equivalent to $117 pre-pandemic. However, $100 worth in February 2020 would be equivalent to $138 six years later. Just over the past year, inflation for this category has run at 6%!
Obviously, I “cherry-picked” a lot of the items listed in the tables above. I ignored large categories like shelter (rents), health care, including physician and hospital services, and drugs. However, as I noted above, the items listed in the tables above are salient for most households, and together they all make up close to 40% of the PCE basket.
The big picture is that prices for most goods and services we use every day are increasing at a pace much faster than what we saw pre-pandemic, and wage growth is barely keeping up with that. In other words, there’s nothing extra, i.e., real wage growth. Perhaps it shouldn’t be a surprise that consumer sentiment is in the dumps.
For more content by Sonu Varghese, Chief Macro Strategist, click here.
8882170.1. – 17APR26A