Home prices and stock prices have risen to record levels, and as Ryan just wrote about, consumer balance sheets are in really good shape. Yet the title of this blog is likely quite controversial, especially since we just had the highest inflationary episode in over 40+ years and consumer sentiment suggests people aren’t happy about it. In fact, a recent Axios piece took this even further, suggesting that the word “inflation” doesn’t mean what it used to. People now use it simply mean “high prices,” i.e. “I’m paying more than I used to.” But inflation is the rate at which prices are currently changing.
Consider an example: As I noted a couple of weeks ago, inflation of full-service meals (seated restaurants) is running at a 3.4% year-over-year pace as of April, i.e. prices are up 3.4% from a year ago. Inflation was running at 9% year-over-year a year and half ago (November 2022). In other words, inflation’s fallen a lot, but prices are still rising. For perspective, inflation of full-service meals was 3.4% in February 2020, just before the pandemic hit. So, we’re back to that pre-pandemic pace. Still, prices are by a cumulative 25% since February 2020. Overall headline inflation, as measured by the Fed’s preferred personal consumption expenditures (PCE) metric, is up about 18% since February 2020.
Stay on Top of Market Trends
The Carson Investment Research newsletter offers up-to-date market news, analysis and insights. Subscribe today!
"*" indicates required fields
Those are massive price increases on a cumulative basis over the past 4+ years.
But here’s the thing. Disposable income has increased over 25% since February 2020. Now, disposable income includes a lot of things in addition to wages, like social security, interest and dividend income, business income, checks from the government, etc. Isolating just the wages piece of it, overall employee compensation is also up 25%.
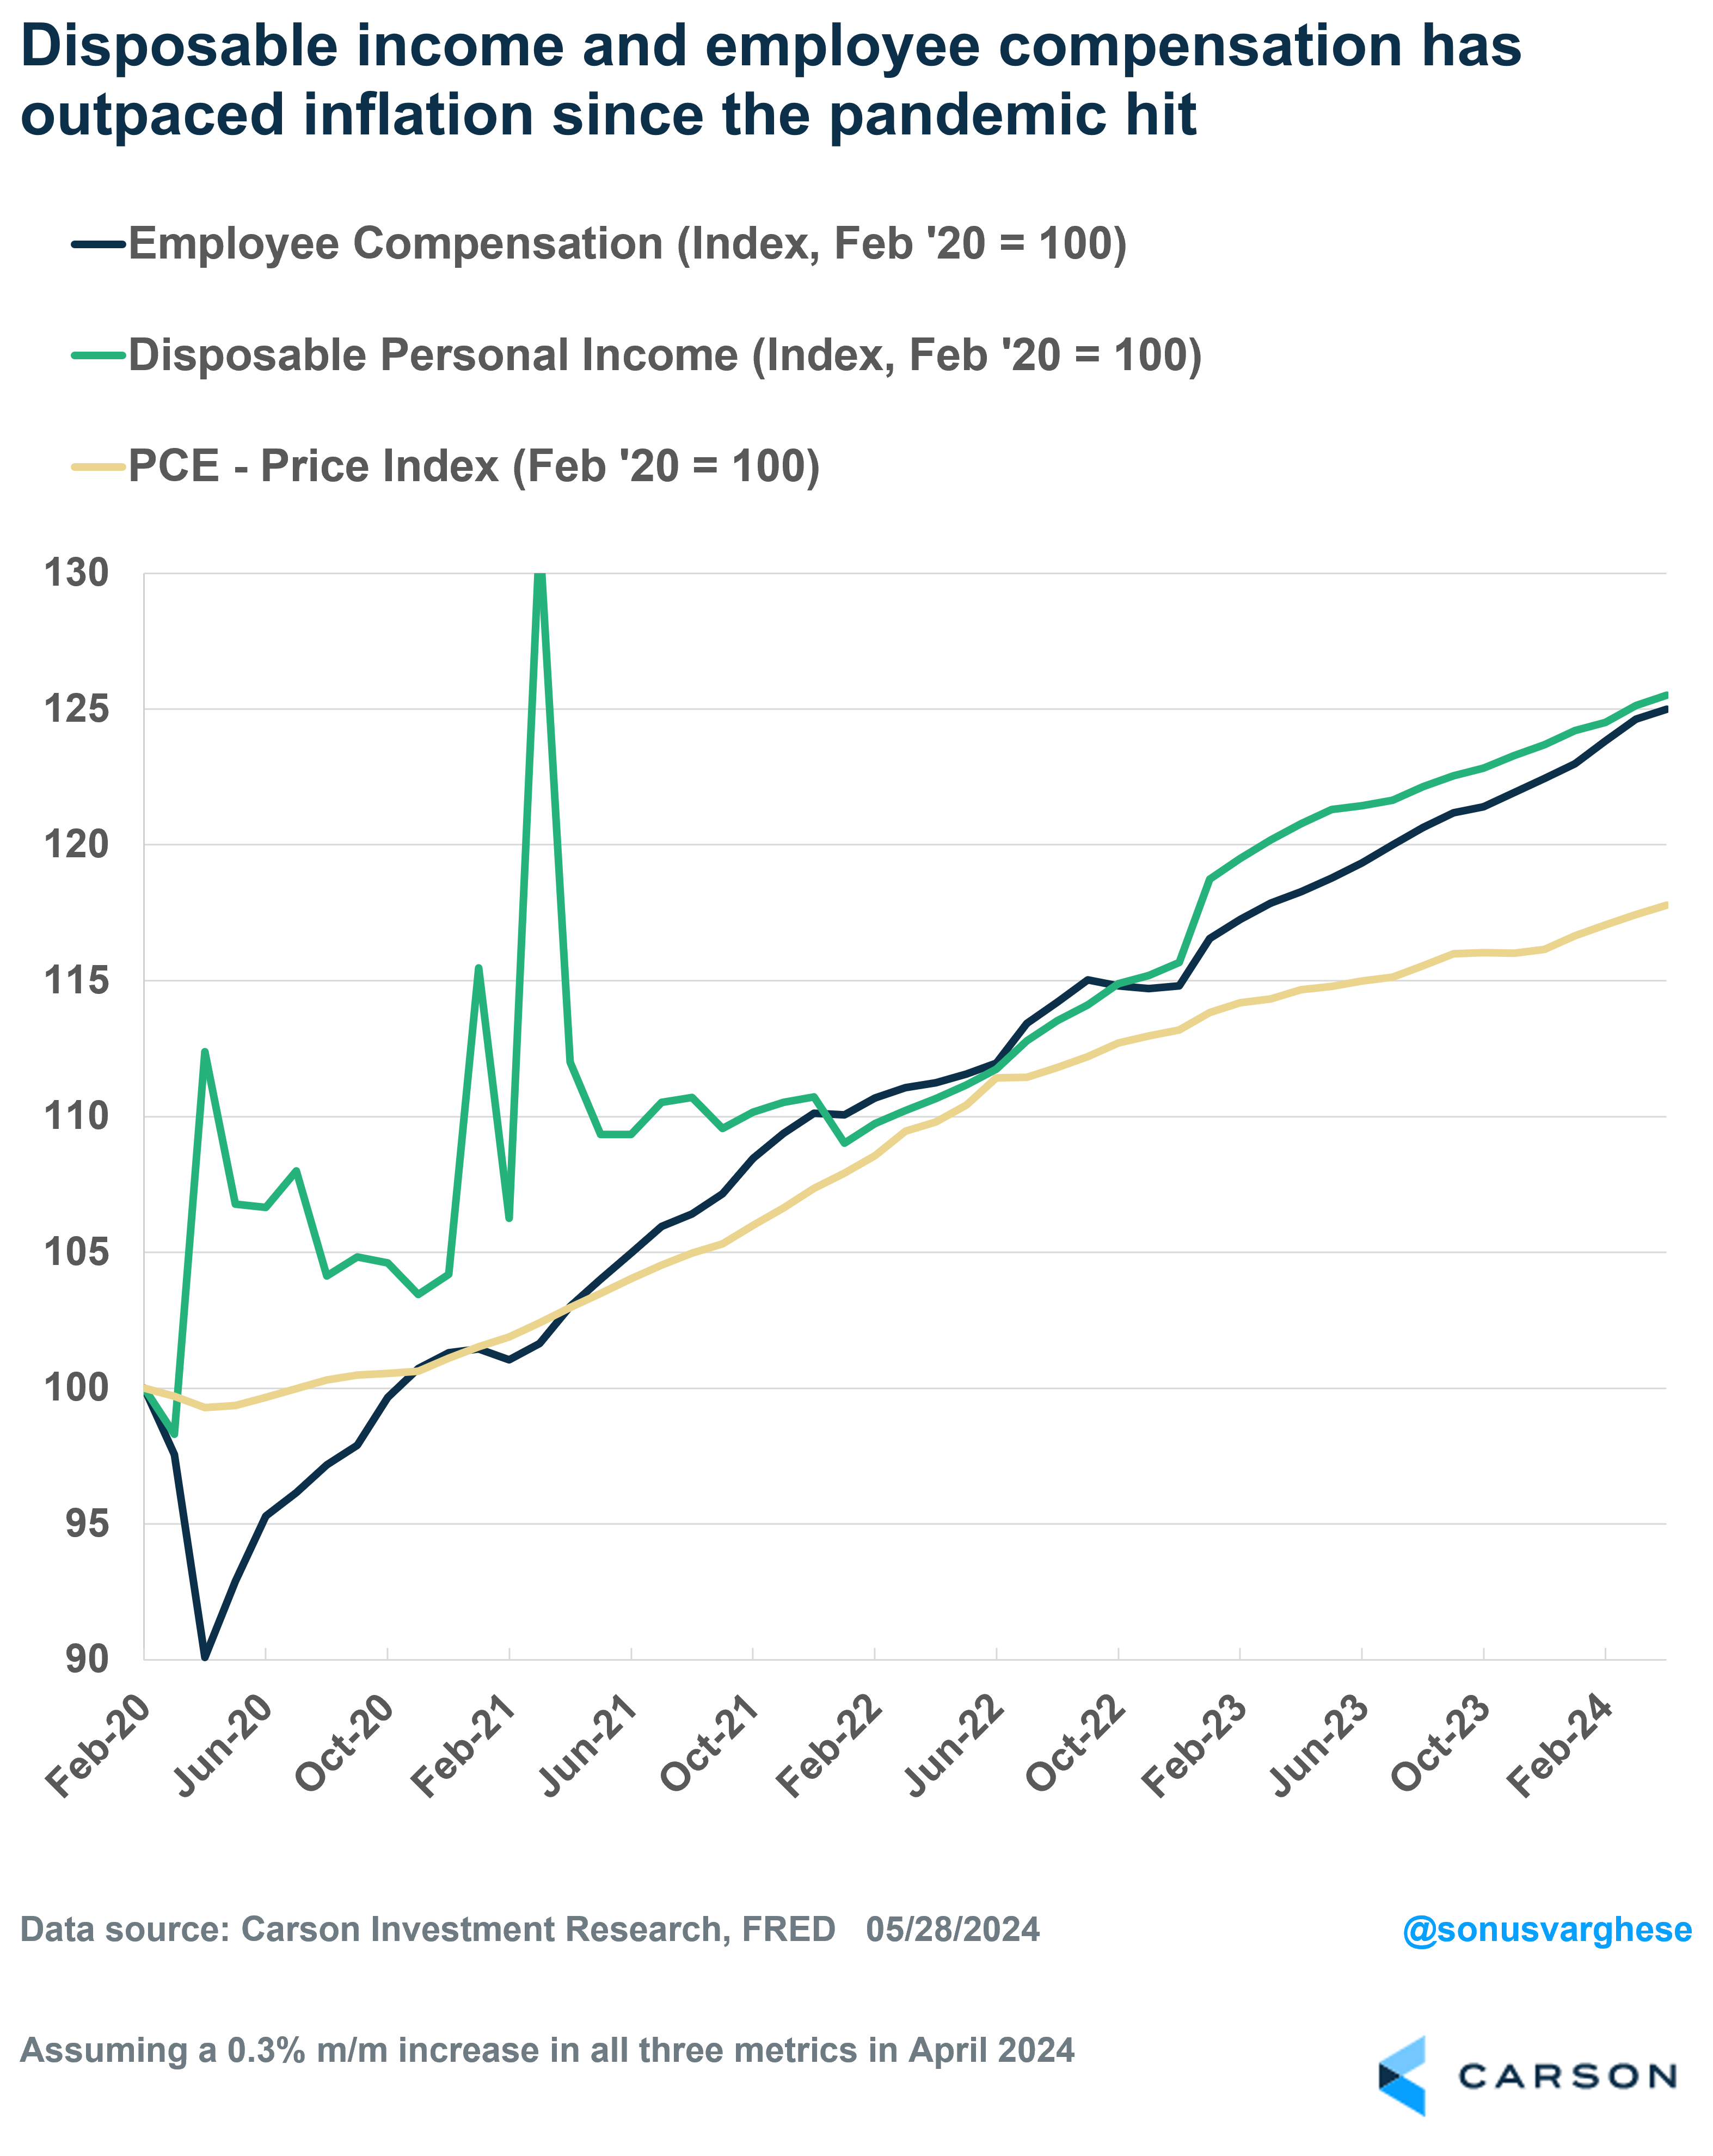
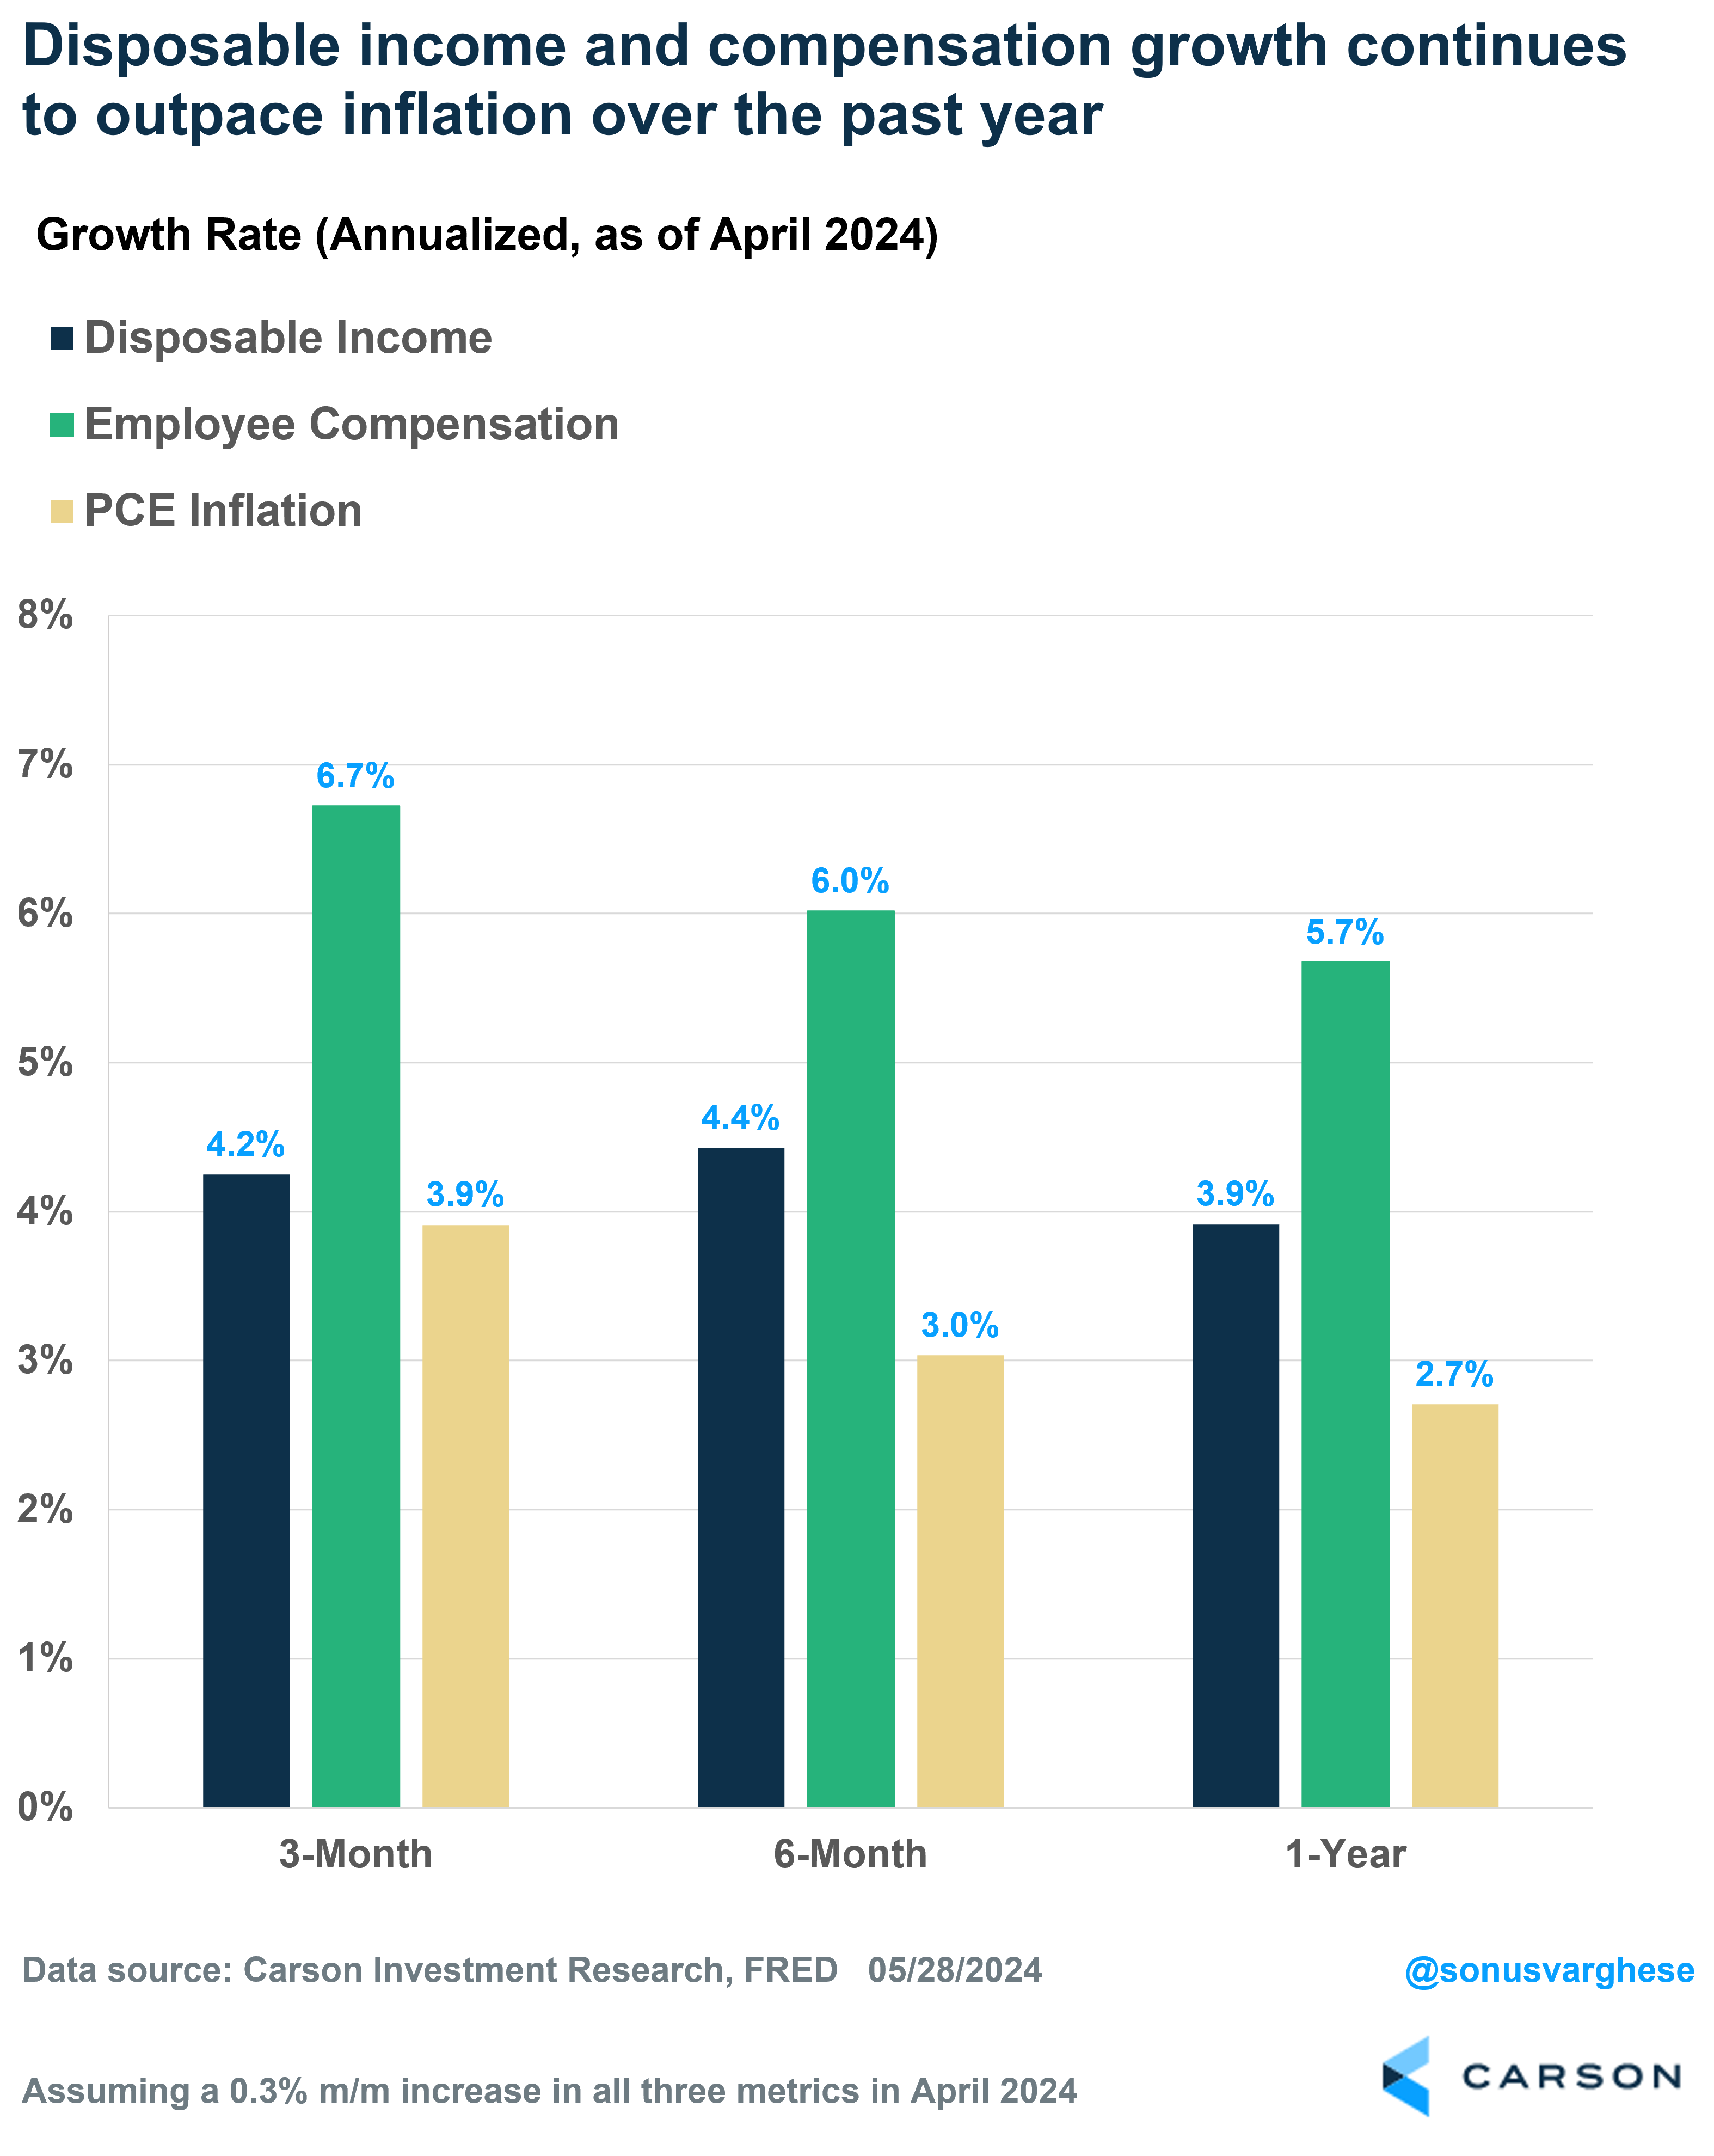
Even better, income growth has been outpacing inflation by quite a bit over the past year. Headline PCE inflation is up 2.7% over the past year. Yet, disposable income is up 3.9% and employee compensation is up 5.7% over the past year. Those are “real” income gains in every sense. This also explains why consumer spending continues to run above trend.
You could make a fair argument that the numbers I cited above are in aggregate, across everyone in the economy, and that hides the fact that there is a lot of inequality. What about people lower down the income spectrum, perhaps outside of the top 1% or even top 20%? Well, as Ryan discussed in his blog, every income group is significantly less levered relative to history, with liabilities as a percent of assets running below historical averages. In fact, households below the 40th percentile of income have seen some of the biggest improvements, especially relative to the 20-years through 1989.
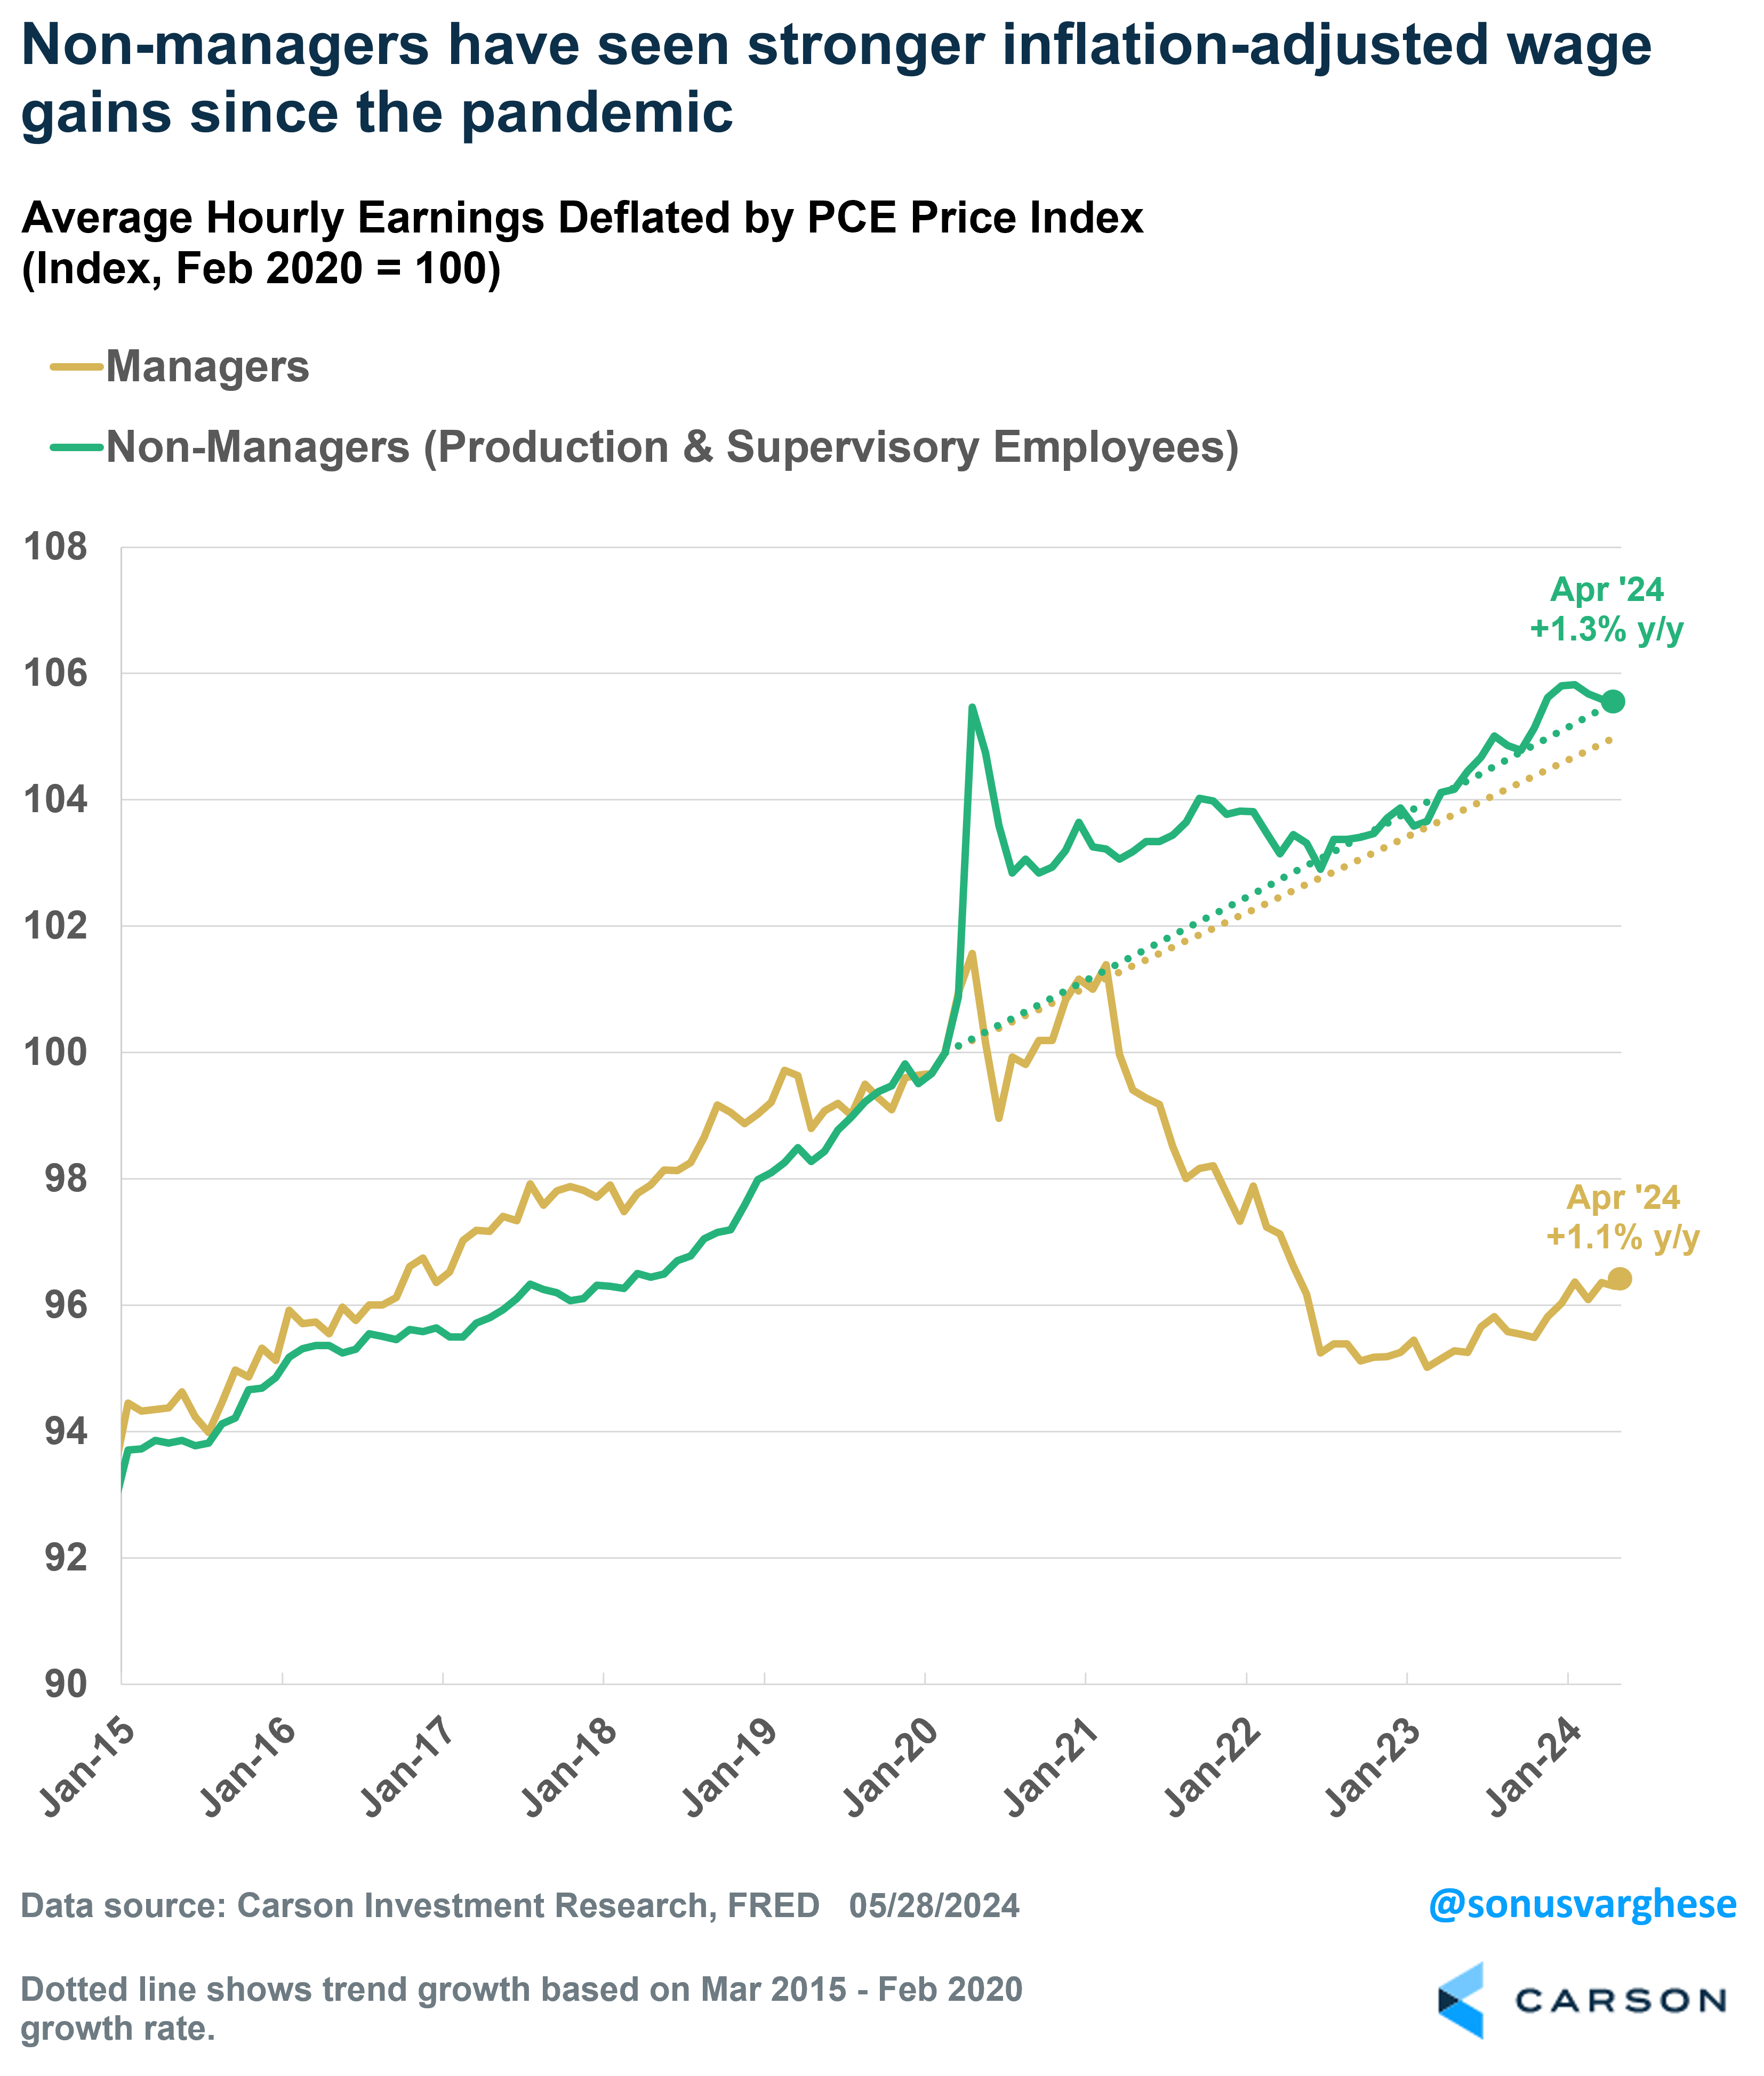
The above is true even if you consider wage growth, as opposed to net wealth (assets and liabilities). Inflation-adjusted hourly wages are growing even when you look at the average worker, especially non-managers. Since the pandemic started, average wages for non-managers (usually lower income compared to managers) have kept up with the pre-pandemic trend, after adjusting for inflation (green line in the chart below). Over the past year, it’s up 1.3%, matching the pre-pandemic trend. Interestingly, wage growth for managers has fallen behind inflation since the pandemic, but the good news is that it’s been picking up recently. Over the last year, inflation-adjusted wage growth for managers is up 1.1%, close to the pre-pandemic trend.
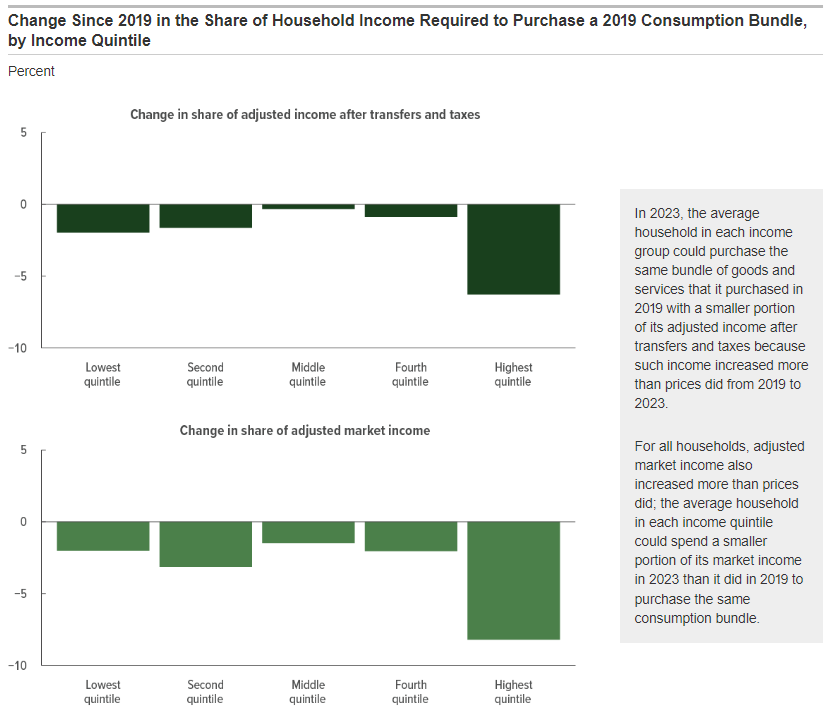
Once again, perhaps you can argue that even “non-managers” hides a lot under the surface. Well, the Congressional Budget Office (CBO) published some interesting research recently. They looked at how households in different income quintiles have fared in the face of inflation. Specifically, they looked at the share of household income required to purchase a 2019 consumption bundle (the same basket of goods as in 2019). And they did this for different income quintiles (0-20th percentile by income, 20th-40th, etc.).
Long story short: For all income groups, incomes rose more than inflation. Adjusted income, i.e. after accounting for government transfers like social security, as well as taxes, grew more than the price of the consumption bundle from 2019 through 2023. For households in the lowest quintile, the share of income required to buy the 2019 consumption bundle fell by 2%. Households in the top quintile did fare better, as their share of income required to buy the same bundle fell by 6.3%.
This was not because of government checks. The results were mostly similar even when they looked at just “market income” (which excludes cash from the government, like social security and unemployment benefits).
Data Source: Congressional Budget Office
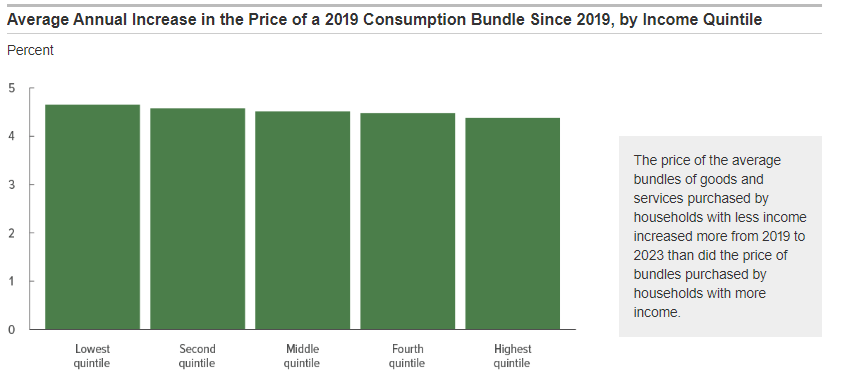
Note that CBO did account for differences in the composition of the various groups’ consumption bundles. For example, energy and food account for larger shares of lower-income households’ total consumption, relative to higher income households. The prices for these items rose a lot more. Whereas prices for “other services” (like personal care, recreational services, etc.) rose by relatively smaller amounts, and these account for smaller shares of lower income households’ consumption. Despite this, lower income households came out just ahead of inflation.
Data Source: Congressional Budget Office
All this is not to say every household has come out ahead of inflation. There certainly are households that are experiencing the pain of inflation a lot more than what the aggregate picture shows. Still, the aggregate picture is important perspective to keep in mind, especially as far as the overall economy is concerned.
For more on our thoughts on the economy, and markets (including new highs for stocks), take a listen to the latest Facts vs Feelings episode from Chief Market Strategist Ryan Detrick and myself.
For more content by Sonu Varghese, VP, Global Macro Strategist click here.
02256709-0524-A
