
A very common question we get these days is whether we’re concerned about the massive increase in consumer debt.
Short answer: No. Well, not yet anyway. But let’s walk through it in 6 charts.
The New York Federal Reserve (NY Fed) releases a quarterly report on household debt and credit, and the latest one that was released last week came with the headline:
“Household Debt Hits $17.05 Trillion in First Quarter.”
Stay on Top of Market Trends
The Carson Investment Research newsletter offers up-to-date market news, analysis and insights. Subscribe today!
"*" indicates required fields
But let’s look at the details. Household debt increased by $148 billion in Q1. That translates to a 0.9% increase, which is the slowest quarterly increase in two years. Most of the increase in debt was from mortgage originations ($121 billion) – mortgage debt makes up $12 trillion of the total $17 trillion in debt. The rest was auto loan and student loan balances.
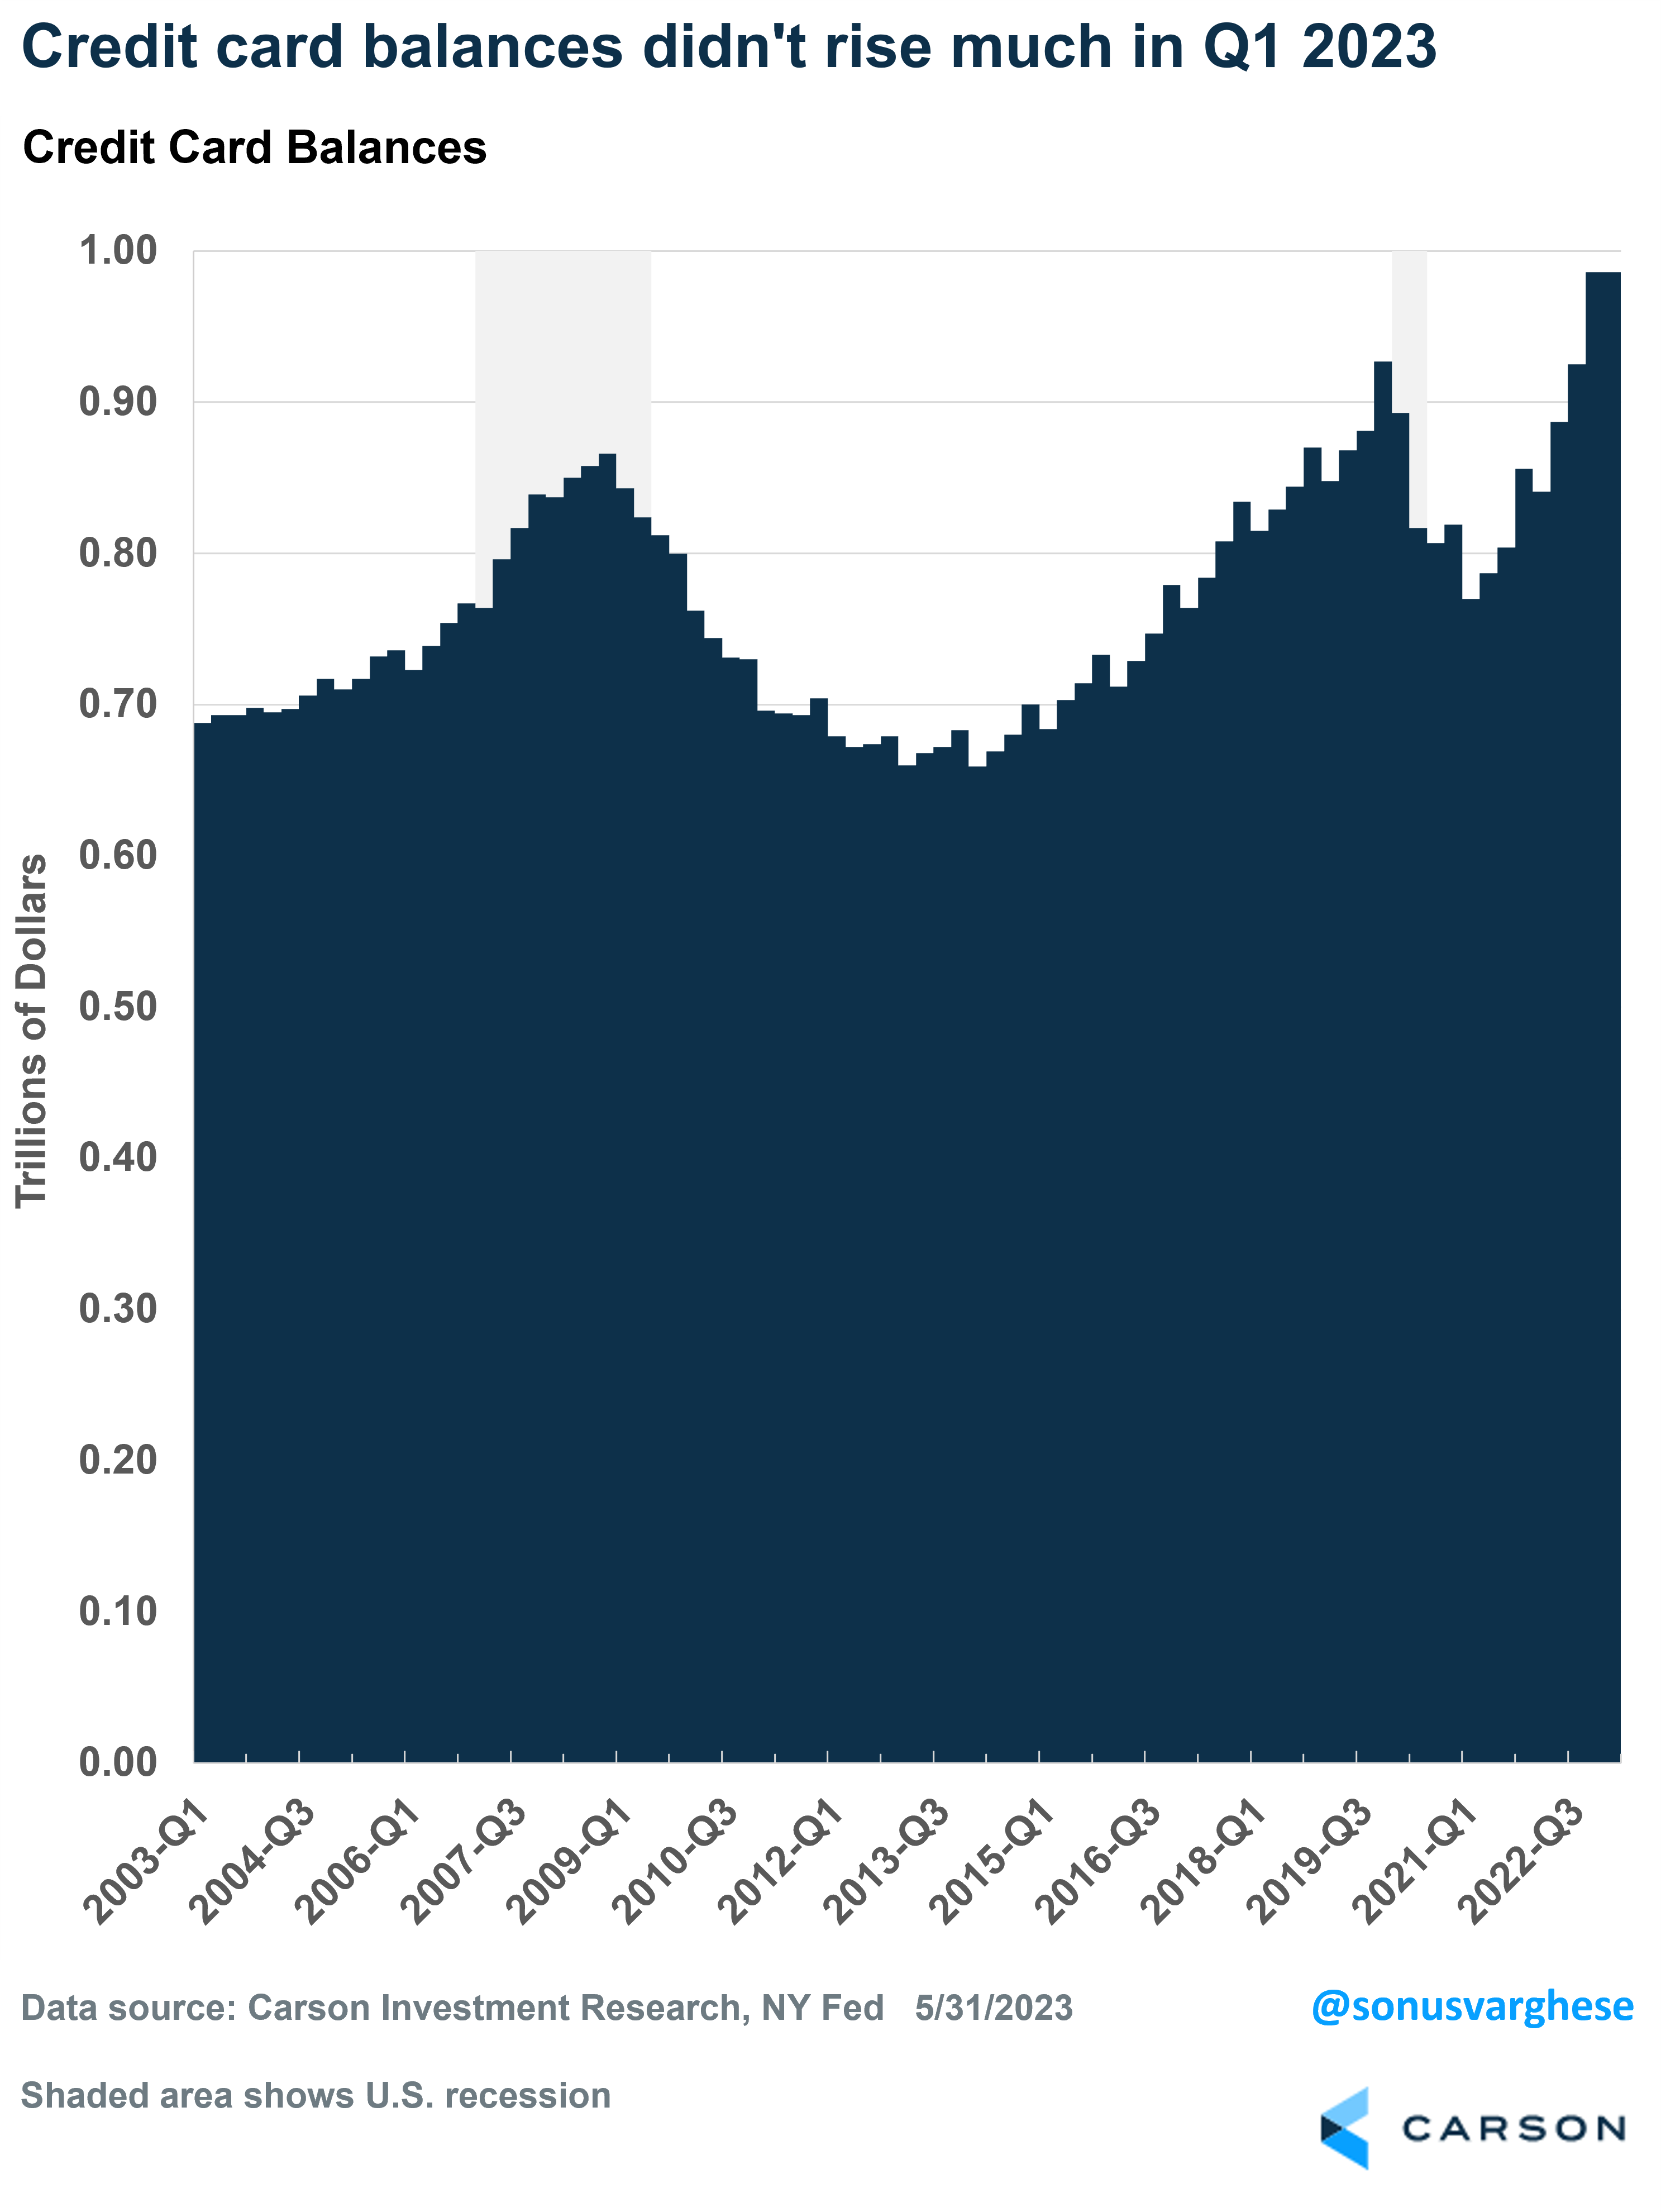
Here’s something interesting: credit card balances were flat in Q1, at $986 billion. The fact that overall balances are higher than where they were in 2019 ($927 billion) should not be surprising given we just experienced a lot of inflation. Prices rose at the fastest pace in 40 years, and so you should expect card balances to increase. However, incomes rose as well.
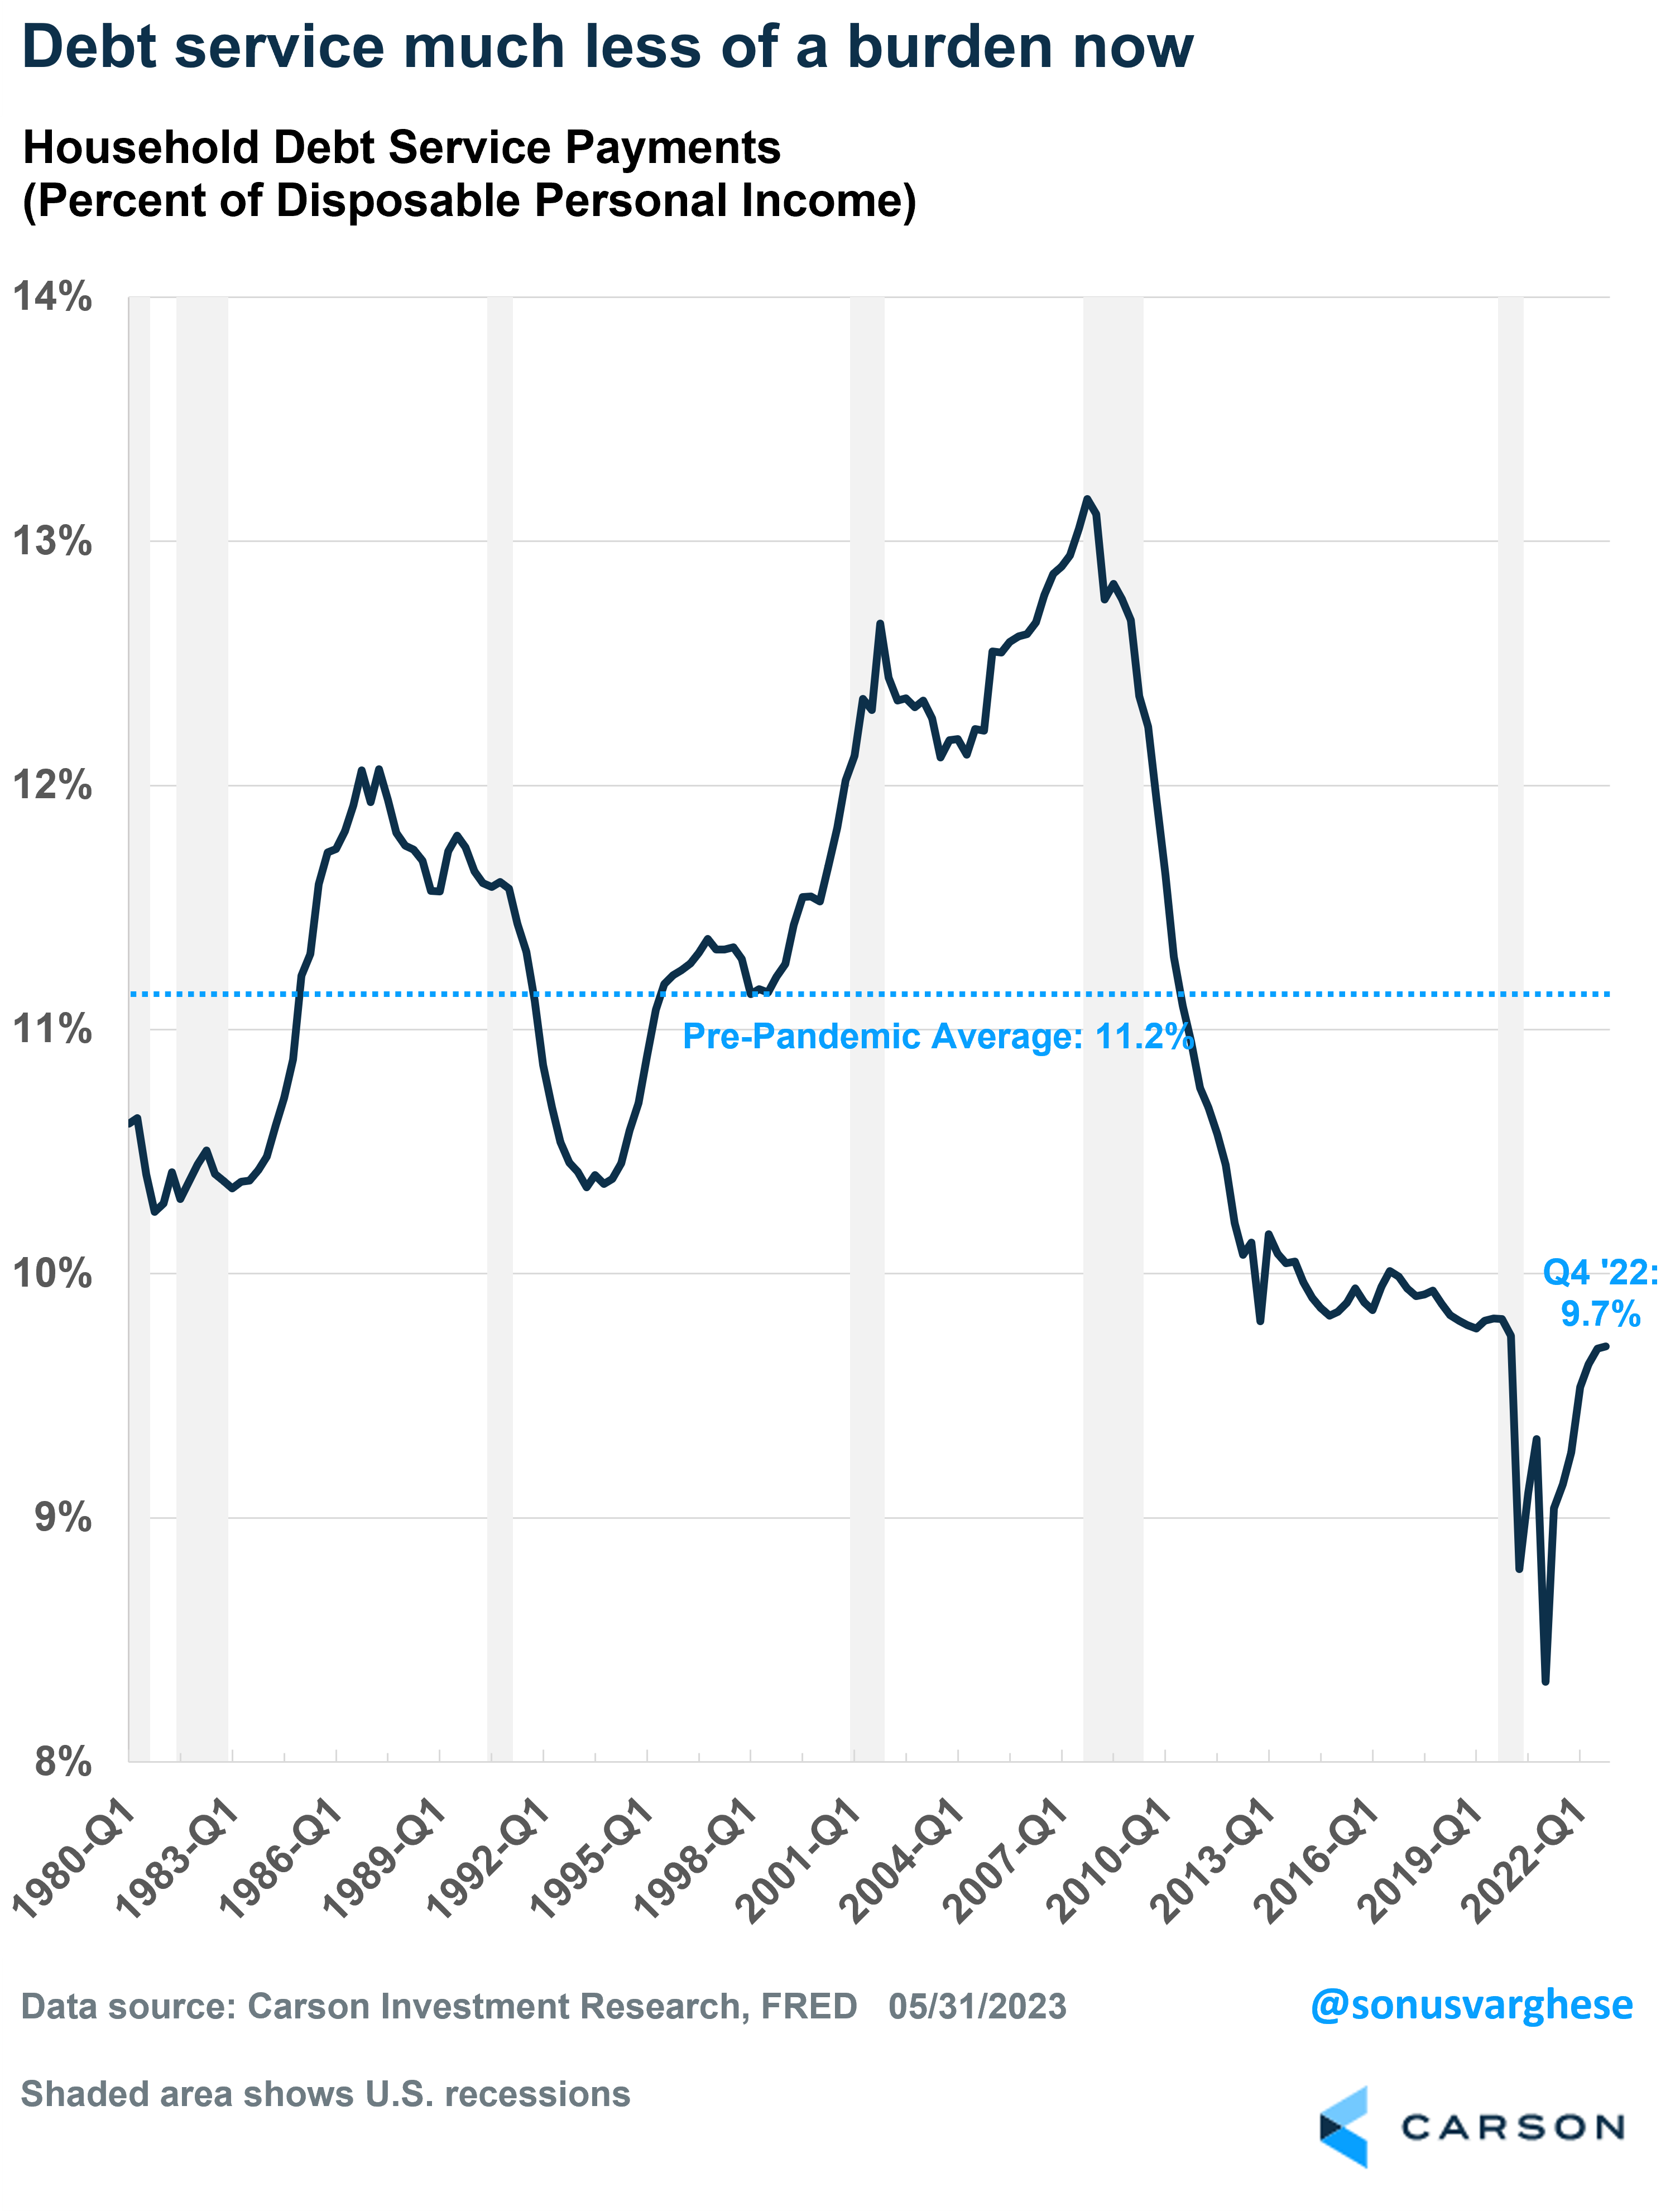
When you think debt, the key question is whether households are able to service that debt. A good measure of that is to look at debt service costs as a percent of disposable income. As of Q4 2022, that’s at 9.7%, slightly lower than what it was before the pandemic and well below the historical average.
There’s even better news: disposable income grew 2.9% in the first quarter of 2023. Significantly higher than the 0.9% increase in total household debt, let alone interest costs!
Part of that includes the large boost to social security income due to inflation adjustments in January. Also, tax brackets were adjusted higher, resulting in more money in household wallets.
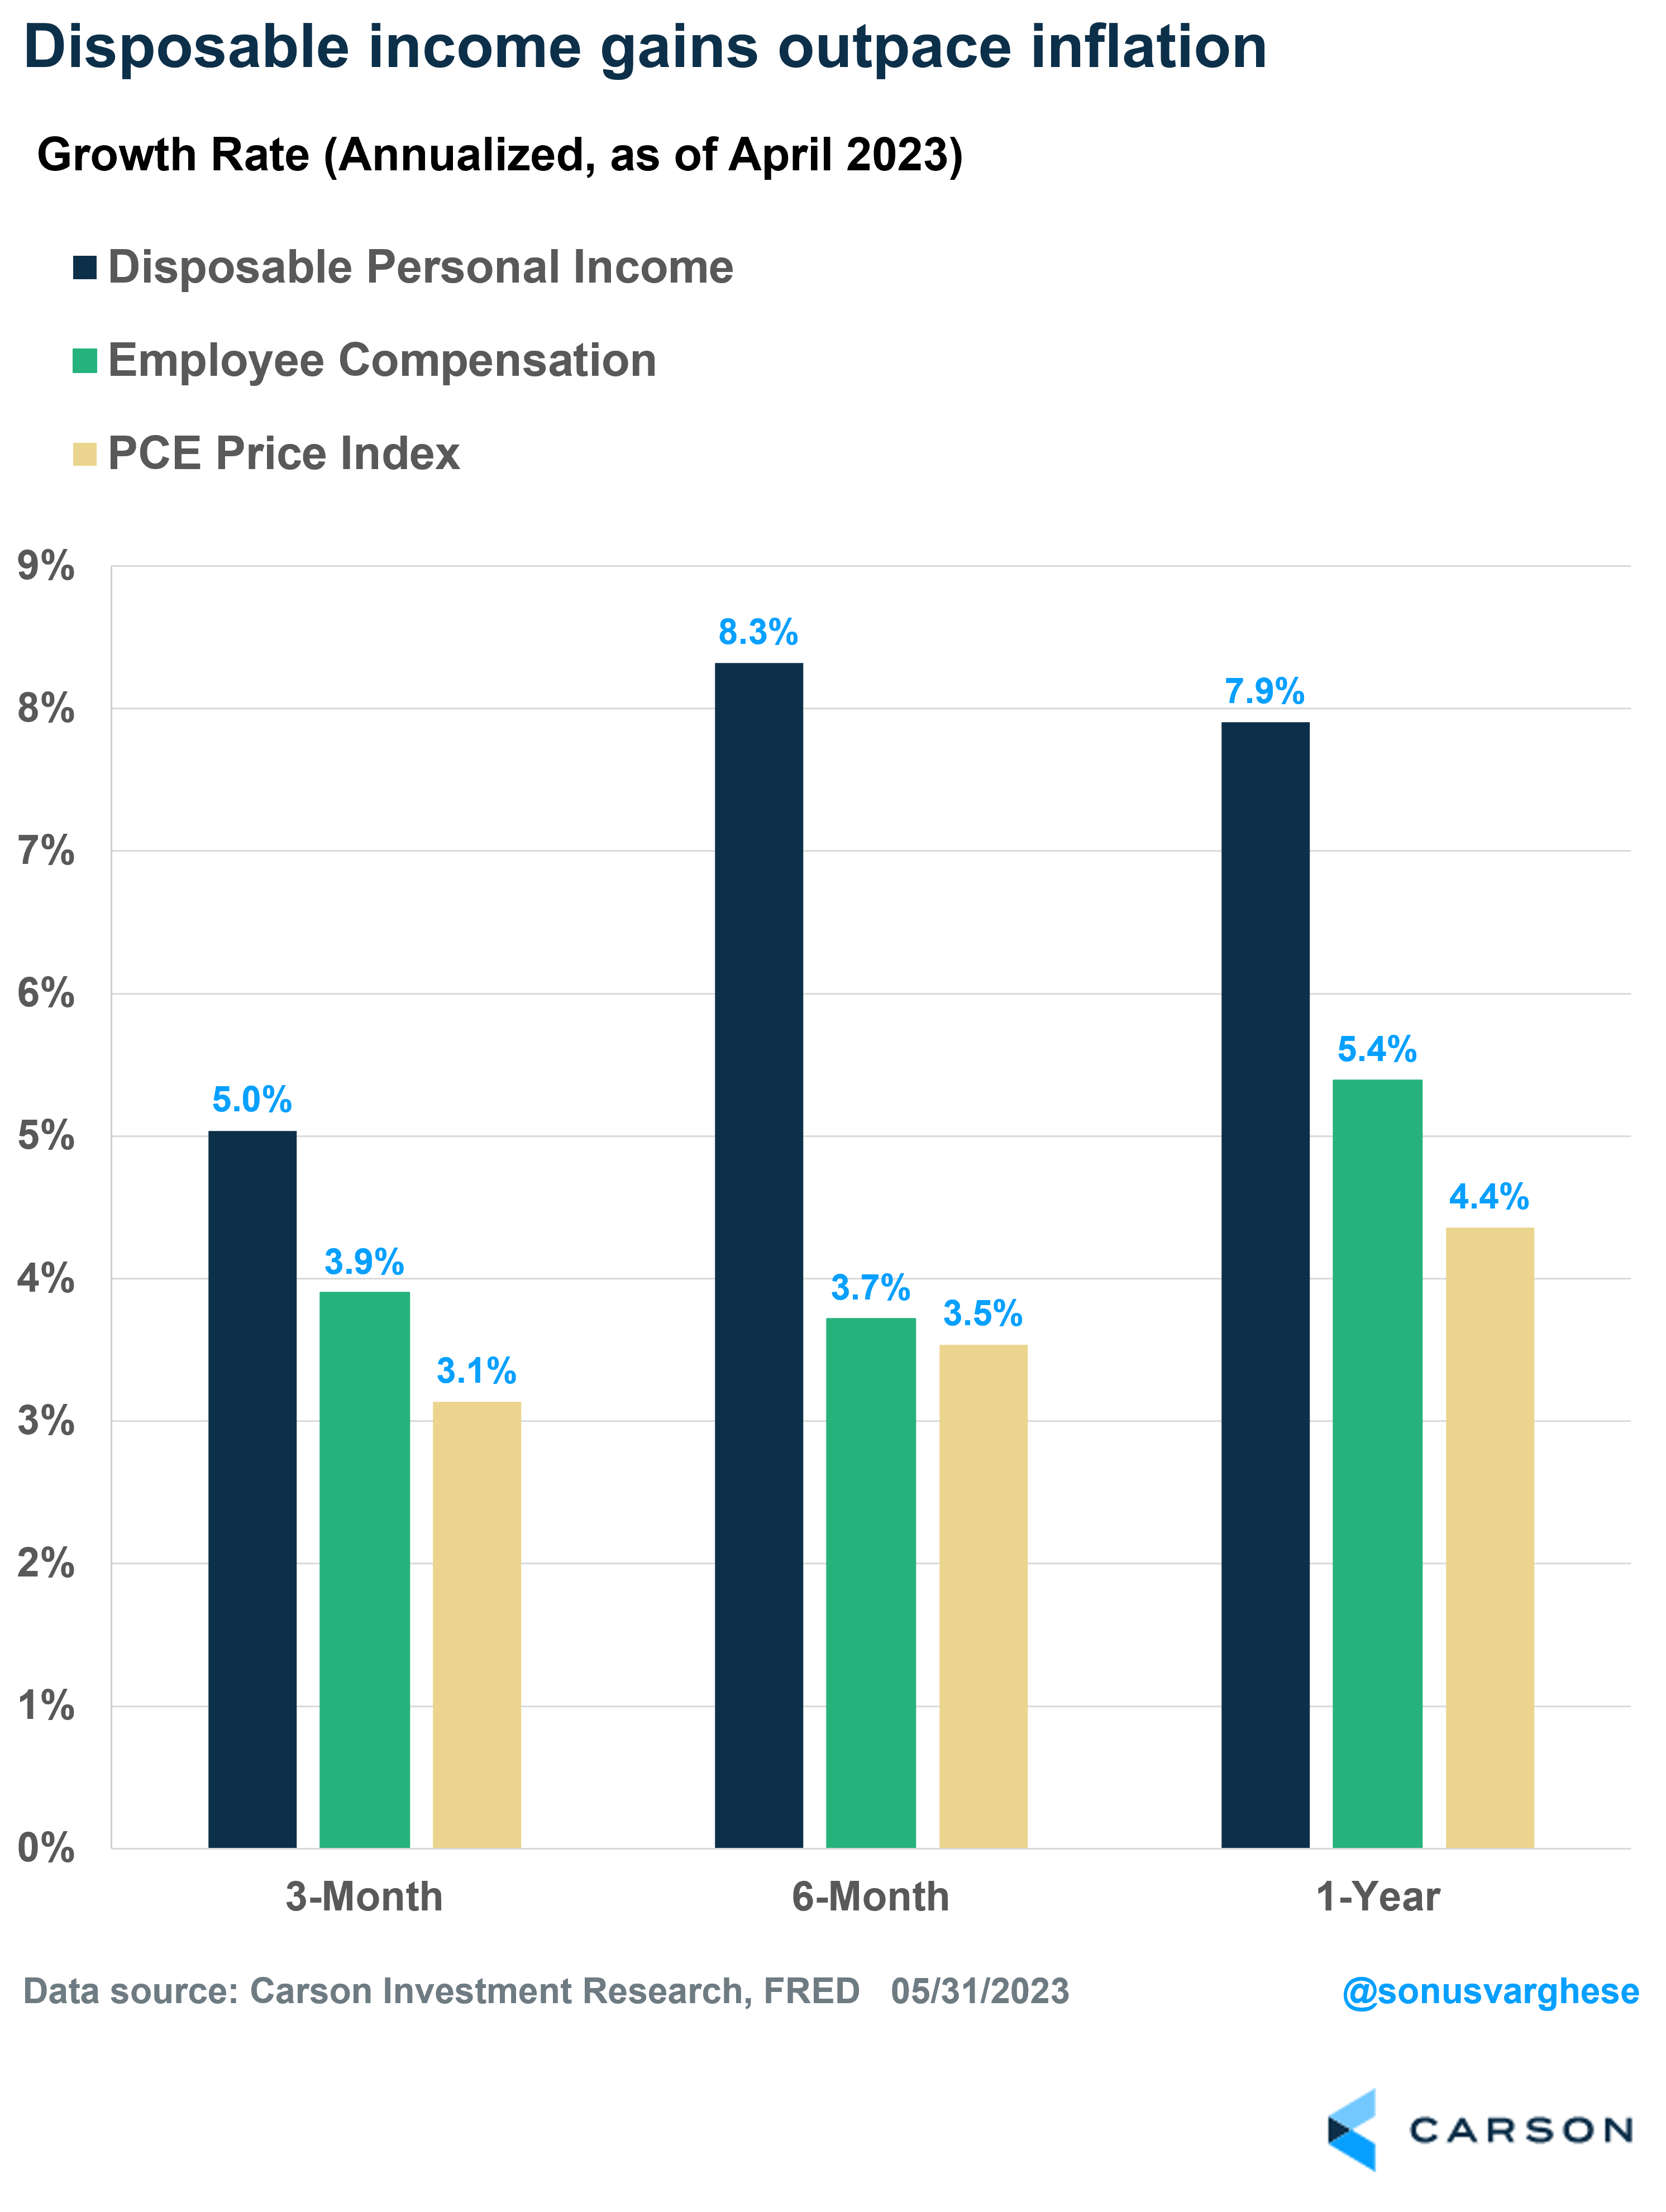
But even if you exclude these one-off increases, disposable income growth has been strong between February and April, rising at a 5% annualized pace. In fact, employee compensation by itself has risen at a 3.9% annualized pace over the past three months. Meanwhile, inflation is running just about 3% – which means households are seeing real income gains (adjusted for inflation).
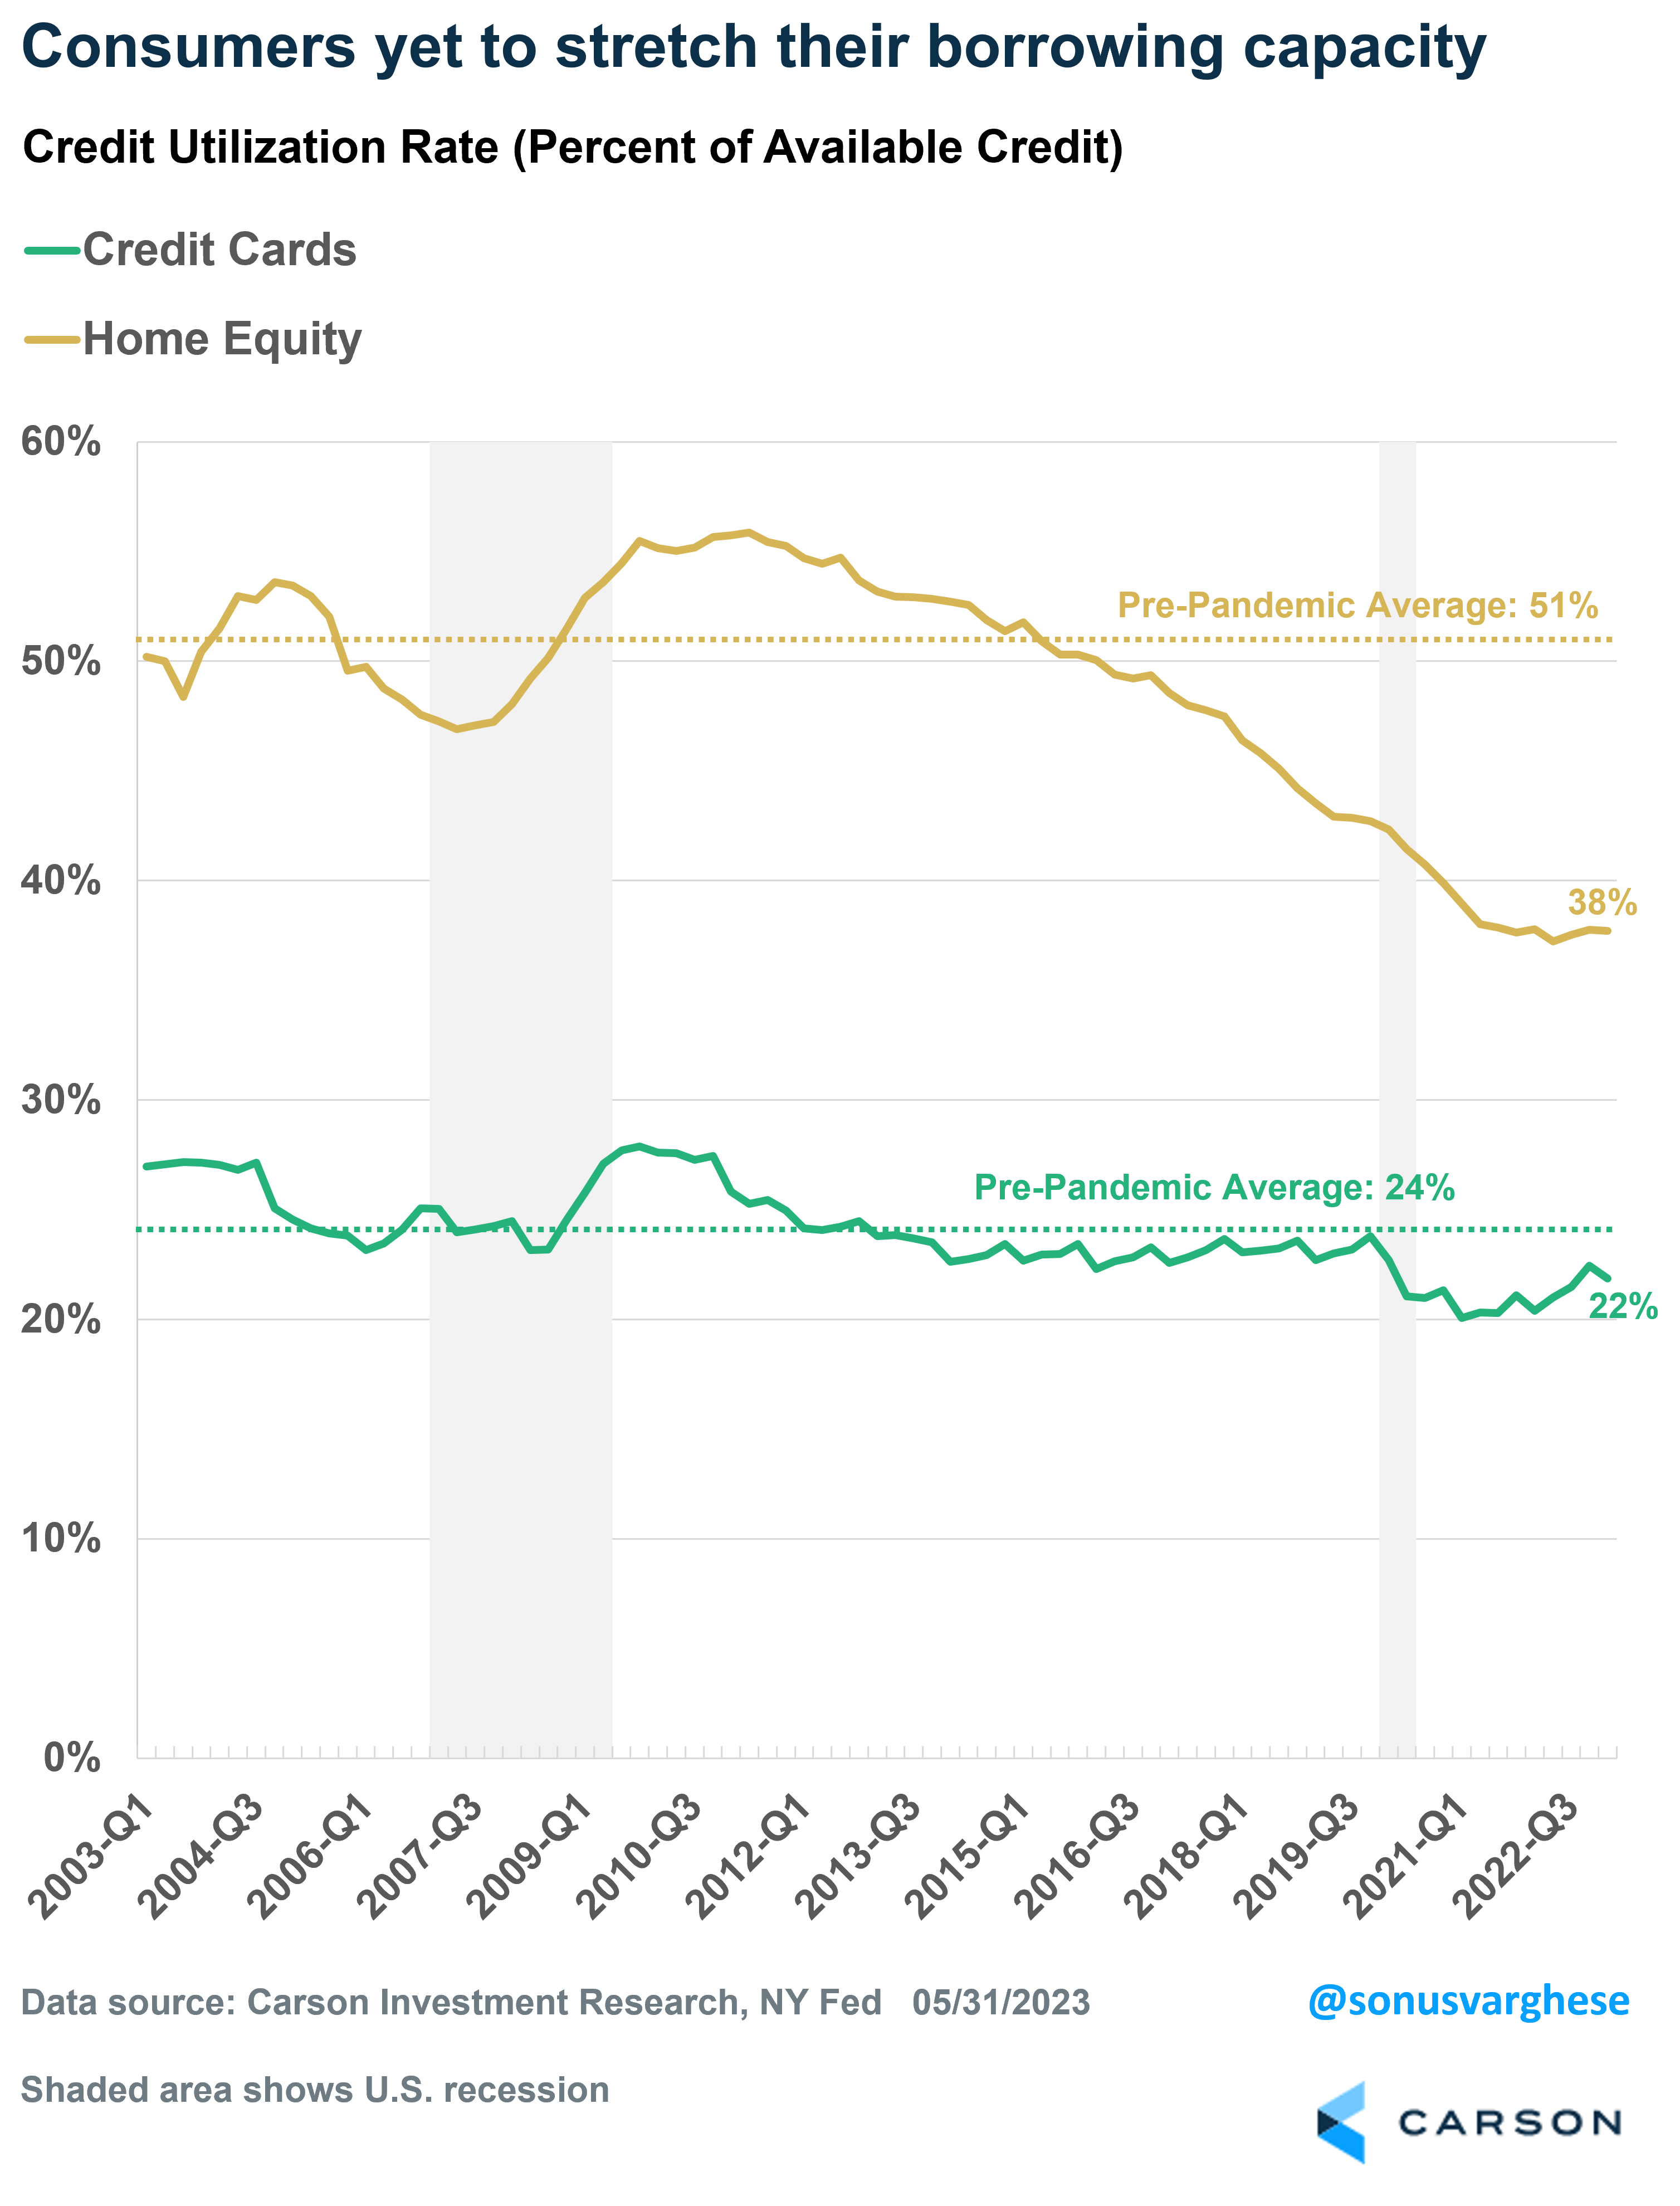
This is why consumers don’t feel the need to borrow to the extent they did before the pandemic. Credit utilization rates measure credit card balances as a percent of available credit. As you can see in the following chart, utilization rates for both credit cards and home equity lines of credit are well below pre-pandemic averages.
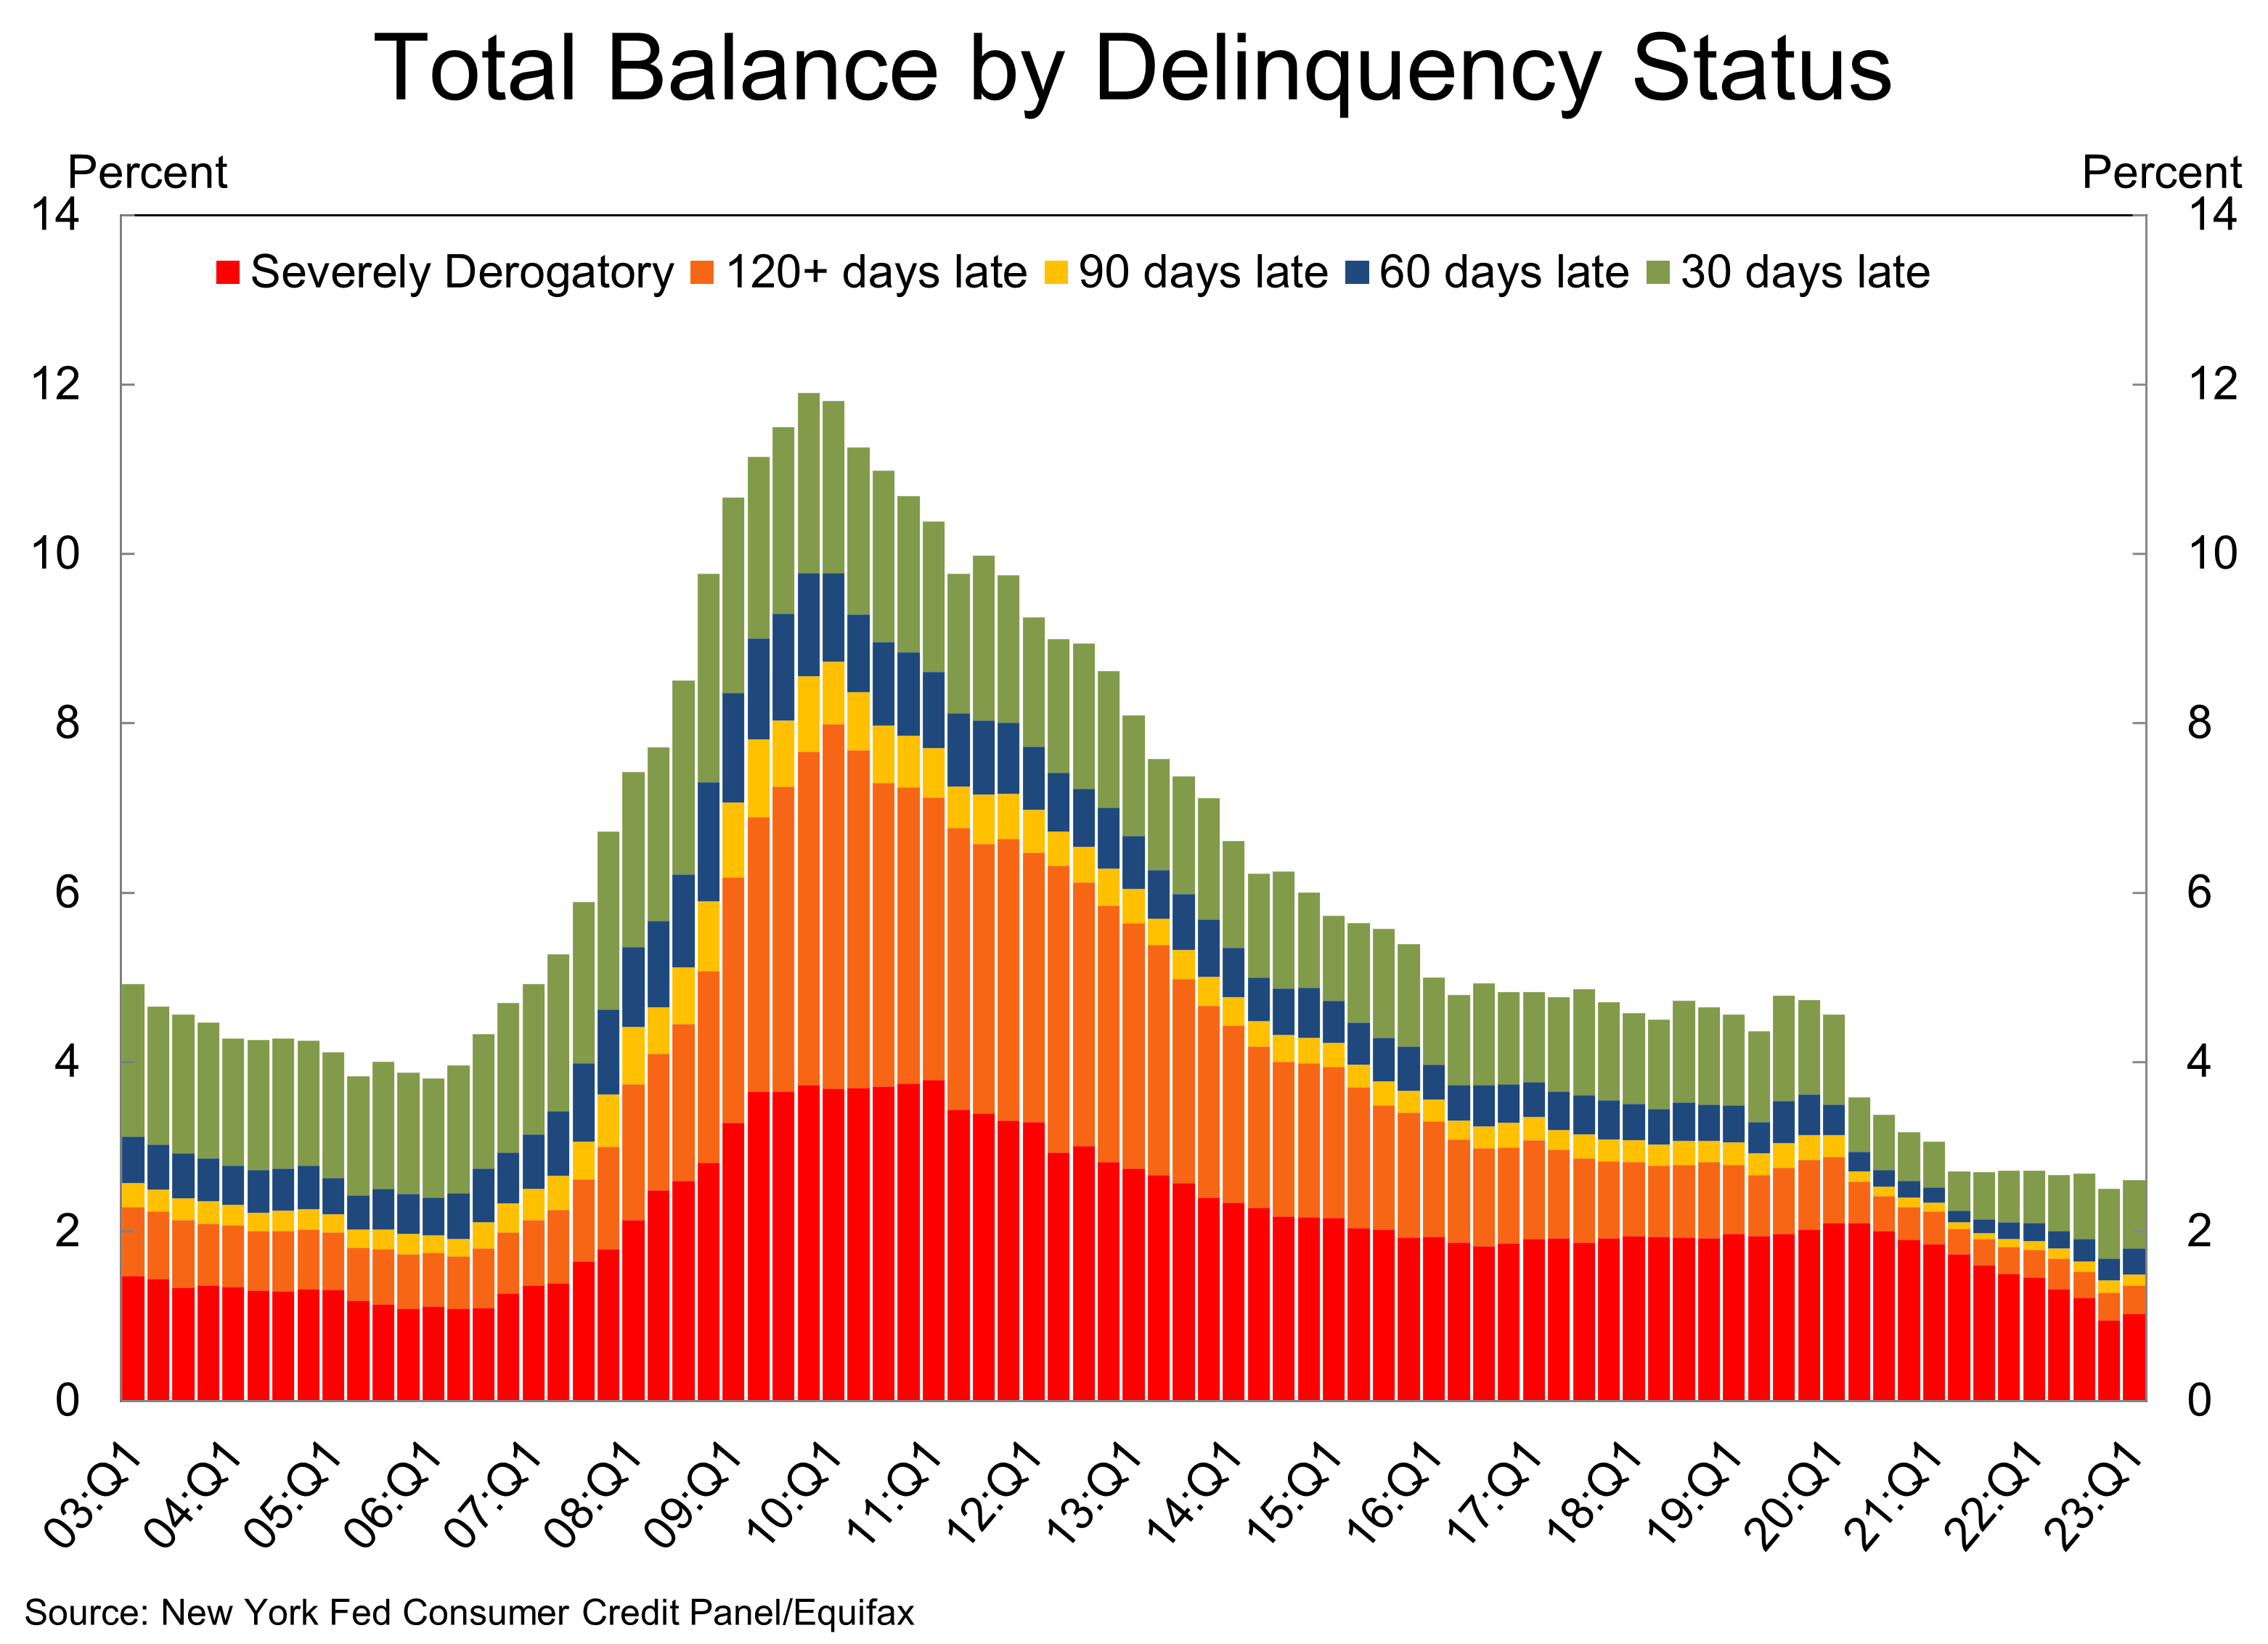
Lack of stress showing in delinquency data as well
Another way to look for signs of consumer stress is to look at the debt delinquency data. As of the first quarter, the NY Fed survey showed that the percent of loan balances that were more than 90 days delinquent was stable around 1.5%. That’s down from 1.9% a year ago, and quite a bit below the 3% average in 2019.
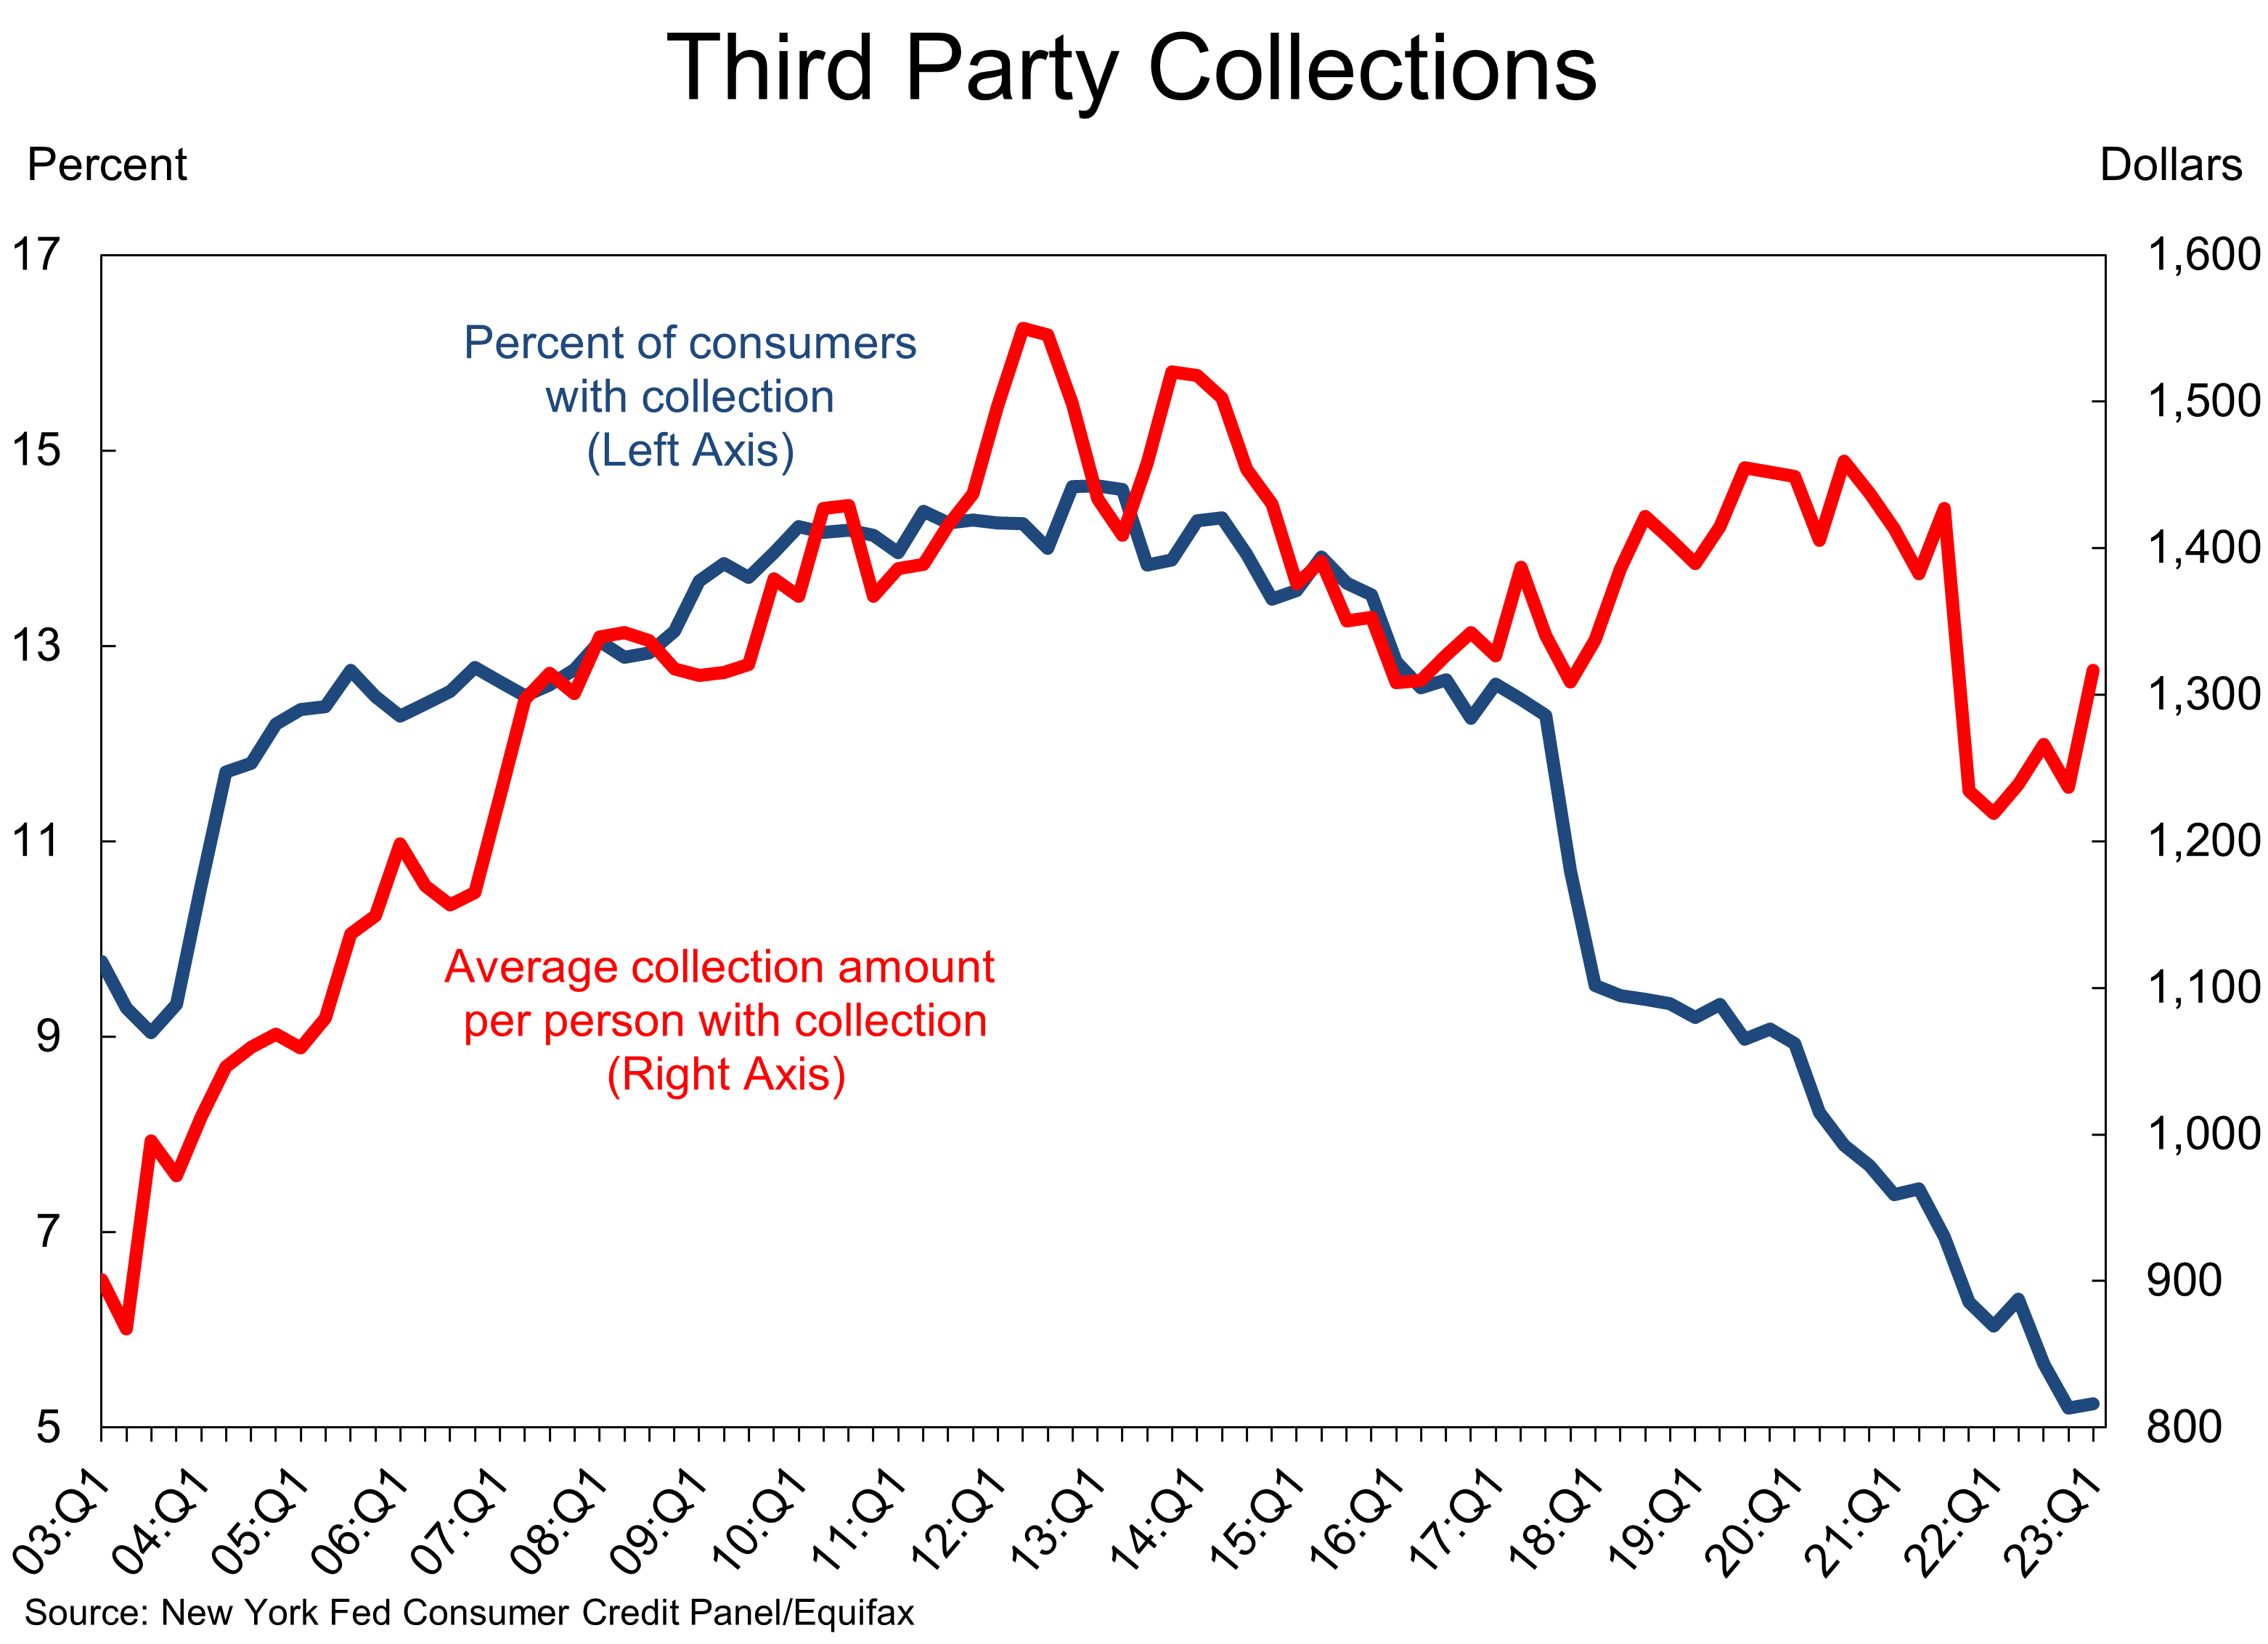
Even third-party collections are at record lows, with just over 5% of consumers having collections against them as of the first quarter. This is down from 6% a year ago and below the 2019 average of 9.2%. The average collection amount per person is $1,316, which is lower than the $1,452 average in late 2019. This is surprising because just with inflation you’d have thought the amount would be higher.
All in all, the data on consumer finances is not showing much cause for concern. So, count us in the “not worried” camp. At least, not yet.
