
- As bond yields have risen, stock valuations have grown more expensive relative to bonds.
- We do believe this reduces the equity risk premium, but it doesn’t erase it.
- Expected earnings growth rates remain largely consistent with history, providing a solid fundamental basis for stock gains if realized.
- Overall, we still expect stocks to earn a meaningful return premium to bonds, and to real rates in particular.
With bond yields higher than they’ve been in over a decade, we’re receiving many questions about what that means for the outlook for stock returns. Over the long run, stocks are expected to earn a premium over the “risk free rate,” usually proxied by some kind of Treasury security. What that premium might be is an important question for investors, since it represents the potential reward for taking on the added risk of stocks. We’ve heard worries from some corners that the premium has disappeared altogether.
Stay on Top of Market Trends
The Carson Investment Research newsletter offers up-to-date market news, analysis and insights. Subscribe today!
"*" indicates required fields
Below is a chart of one way to measure the equity risk premium, comparing the “earnings yield” of the S&P 500 and real Treasury yields via Treasury inflation-protected securities (TIPS). The equity risk premium is low compared to the lookback period but still positive.
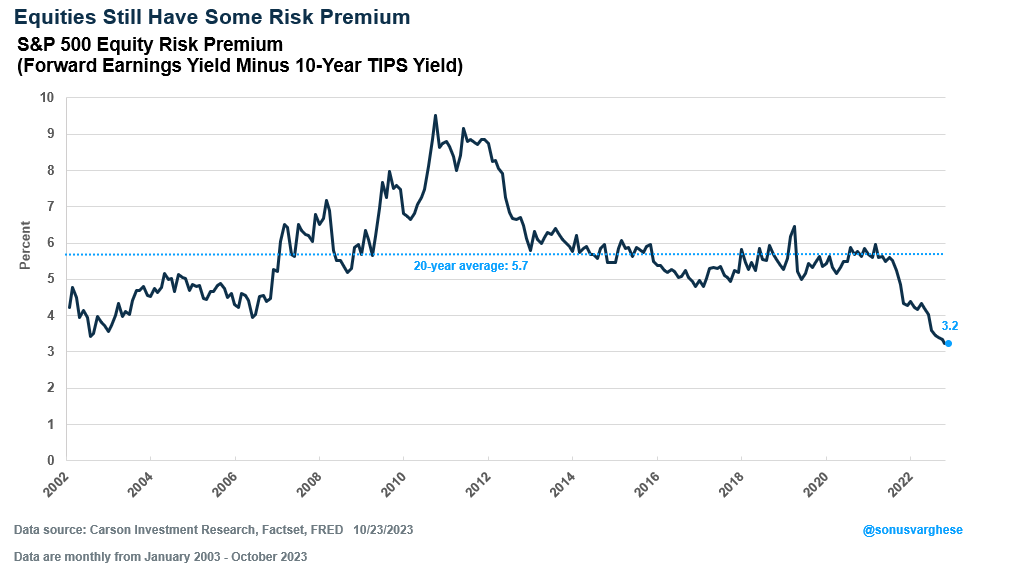
Helped by a solid start to earnings season and stock declines, the price-to-earnings ratio (P/E) for the S&P 500 has fallen to 17.6 P/E based on next 12-month earnings, according to FactSet data. That would correspond to a 1/17.6, or 5.68%, earnings yield. As argued by my colleague Sonu Varghese, VP, Global Macro Strategist and many other leading practitioners, that should be compared to real yields as measured by Treasury inflation-protected securities (TIPS), currently at 2.44% for the 10-year TIPS. That gives you an equity risk premium of 3.2%. (See Sonu’s earlier discussion of the equity risk premium here.)
That’s a lot to absorb, but the basic idea is the more expensive stocks are relative to bonds, the smaller the risk premium, and the lower the expected future return of stocks relative to bonds. This has some historical support, depending on the way you ask the question, but only for a longer-term outlook with no meaningful predictive value over the next year or two.
It is worth noting that higher bond yields replace some of the return expectation for stocks lost from a lower risk premium. Investors just aren’t compensated as well for the added risk from stocks. For example (hypothetically), if the relevant bond yield is at 2% and the expected risk premium is 6%, you expect an 8% return. If bond yields climb to 4% and the expected risk premium falls to 4%, you still expect an 8% return, you’re just getting less compensation for taking on the added risk—you could get 4% from bonds. But if an investor’s return requirement remains constant, they may decide to become less risk averse and take the smaller premium to reach their return target.
Stocks Over the Long Run
The chart below shows the estimated return difference over rolling 10-year periods between the total return of the S&P 500 Index and the return on a 10-year Treasury bond rolled over at the end of each year. Historically, the S&P 500 Index has outperformed 10-year Treasuries in 85% of all rolling 10-year periods and over the entire period has an average risk premium of 4.8%. The S&P 500 Index has been positive in 94% of those periods so most of the periods of a negative realized risk premium, stocks still provided a positive return.

Of the periods with a negative risk premium, four were during the Great Depression, five were in the 1970s, when 10-year rolling stock returns were always positive but bond returns were solid and equity returns were muted. The last had period of underperformance was in the wake of the tech bubble bursting, which then had some crossover with the Great Financial Crisis during some 10-year periods.
The historical premium of stocks over bonds, of course, is backwards looking. Despite the obvious disruptions during periods when stocks underperformed 10-year Treasuries, we can also look at where a version of the equity risk premium was at those times to see the potential forward-looking impact. Nobel laureate Robert Shiller provides another version of the equity risk premium that has a longer history. In order to remove some historical volatility, Shiller averages earnings over a 10-year period, an imperfect but satisfactory representation of a market cycle, and does look at the premium from a real rather than nominal perspective.
As of the end of September, Shiller’s “Excess Cyclically Adjusted Price-to-Earnings Yield” (ECY) was at 1.9%. At the start of the Great Depression and at the peak of the tech bubble, which both preceded periods of negative excess returns of stocks versus bonds, the ECY was in fact negative. Prior to the S&P 500’s underperformance of bonds in the 1970s it was positive, and that was a period when trailing 10-year equity returns didn’t actually turn negative even if the S&P 500 underperformed bonds. Right now, the ECY remains positive, so despite higher bond yields the current situation is not comparable to other major periods of stock underperformance from the perspective of Shiller’s ECY.
Don’t Ignore Fundamentals
Using earnings yield for stock for stock fundamentals is a useful rough estimate, but it doesn’t give us much information about the price-to-earnings ratio that’s justified in the current situation. Next year’s earnings just isn’t enough to provide that. A better estimate requires a deeper look at stock fundamentals. The downside of that approach is that adding inputs opens the door to letting in more bad assumptions that can be more easily manipulated.
Admitting that any analysis from fundamentals can only be an estimate, we can at least choose an approach that is both internally consistent and aligned with basic principles of stock valuation. For that, I turn to Aswath Damodaran of New York University’s Stern School of Business. In my opinion, Damodaran has been updating a thoughtful, thorough, and pragmatic review of the state of the equity risk premium every year since 2008. Below are fundamentally driven estimates of the equity risk premium over time. These estimates do rely on several informed assumptions, but as mentioned above they are internally consistent and aligned with basic principles of valuation.
Because these are fundamentally driven, the estimate varies meaningfully over time, but the variation isn’t so extreme that the equity risk premium turns negative. This does make sense. While the inputs to the models change, there are some things that tend not to see extreme changes. For example, over the long run earnings growth has been fairly steady even if there is some extreme near-term volatility. And investors may discount future cash flows at different rates at different times, but they are consistently discounted, which is part of what creates the premium. Damodaran updates this data monthly and the latest value for the fundamentally-driven equity risk premium was 4.84%, lower than it was at the end of 2022 but in line with the long-term historical data..
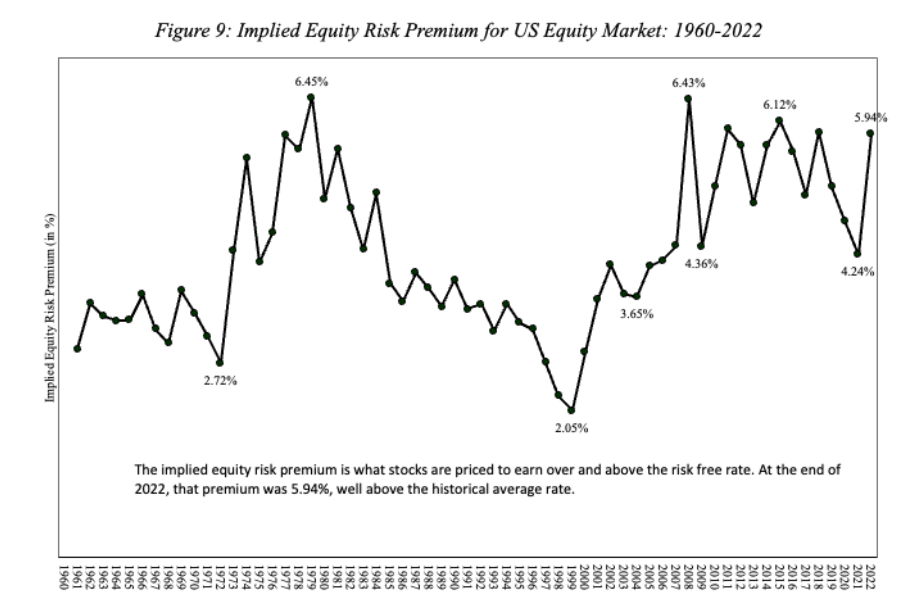
Source: Anand Damodaran, “Equity Risk Premium (ERP): Determinants, Estimation, and Implications – The 2023 Edition,” accessed from https://pages.stern.nyu.edu/~adamodar/ 10/24/2023
There Are Higher Earnings Yields Outside the S&P 500, But There’s Greater Risk
The forward P/E ratio for the S&P 500 is above it’s 20-year median but not currently at an extreme. There are areas of the market with lower P/Es, and therefore higher earnings yields, but they typically come with added risk. Value has a more attractive earnings yield than growth. International stocks typically run at a higher earnings yield than the S&P 500 and the current situation is consistent with history. We believe those differences are currently justified. Perhaps the most interesting case is small and mid cap stocks.
The forward P/E for the small cap S&P 600 Index is 11.4 versus a 20-year median of 14.6, according to FactSet data. The forward P/E for the mid cap S&P 400 Index is 12.3 versus a 20-year median of 14.0. Small and mid cap stocks can be more sensitive to interest rates due to funding needs and greater credit sensitivity. Also, their earnings growth is typically further out in the future and therefore gets more heavily discounted by higher rates, although the S&P 600 and S&P 400 are higher quality indexes that have an earnings requirement. For those oriented toward value investing and concerned about earnings yield, higher quality small and mid cap stocks are interesting options.
We Still Expect Equities to Outperform Bonds
Carson Investment Research maintains an overweight recommendation for stocks in both tactical and strategic portfolios, with a more modest overweight strategically. We believe the equity risk premium, even if smaller, still offers an adequate potential payoff for the added risk of equities. Despite dramatic underperformance by small and mid cap stocks, in fact partially because of it, we believe it is an appropriate time to continue accumulating a small overweight, recognizing that it can sometimes take time for “value” to show. Strategically, we maintain a position for lower volatility equities as well. The opportunity for a reasonable return from even short maturity bonds is a significant development for many investors, but we still view stocks as the main driver of capital accumulation for suitable long-term investors.
1948746-1023-A