
“If there were ironclad rules, we would all be following them.” -Josh Brown of Ritholtz Wealth Management
Although we saw a late October bounce, the S&P 500 officially moved into correction territory last week. By definition, a correction is when stocks are down more than 10% from a recent peak, in this case, down more than 10% from the late July peak.
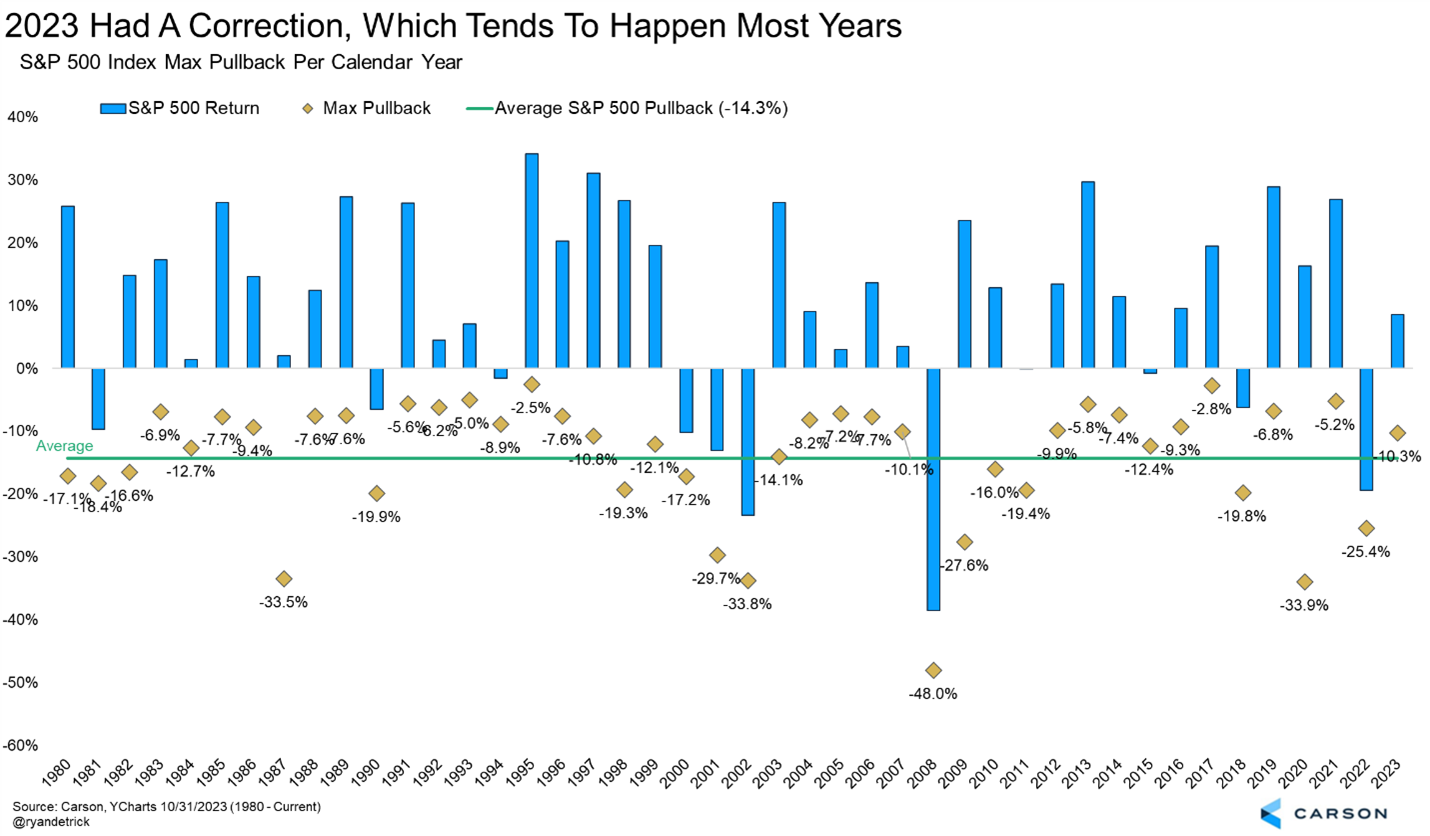
Yes, the past three months haven’t been very fun for bulls, but let’s put some context around market corrections. Going back to 1980, the average calendar year has experienced an average drawdown of 14.3%.22 out of 44 years saw stocks experience a peak-to-trough correction of 10% or more. Out of those 22 years that had a correction we found 12 years still managed to finish higher. So it is quite possible to see a correction and stocks still finish green on the year. Lastly, for the 12 years that saw a correction and still finished higher, the S&P 500 gained 17% on average for the year. So the bottom line is a correction is quite normal and a solid year, when all is said and done, is also quite normal when we have one.
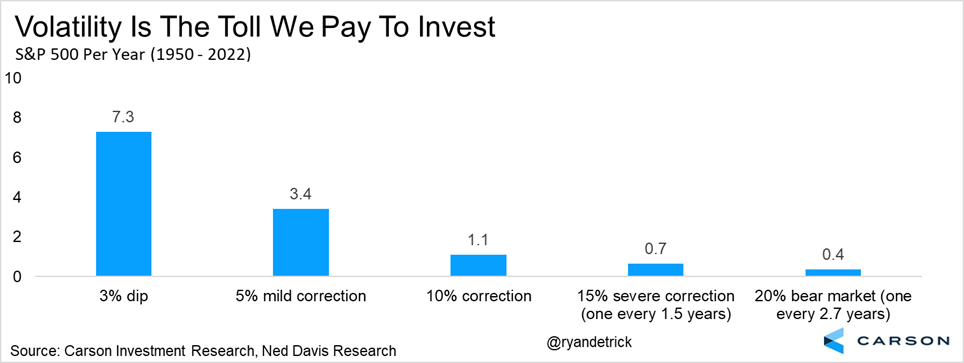
According to our friends at Ned Davis Research, there are 1.1 corrections per year on average, again suggesting that while corrections aren’t fun, they’re not abnormal.
We will be the first to admit the depth of the weakness in October surprised us, but we also didn’t expect to see a major war break out in the Middle East. We remain optimistic for a year-end rally though, as the economy is showing very few signs of weakness, stock valuations are getting quite attractive, and overall sentiment is very negative.
Stay on Top of Market Trends
The Carson Investment Research newsletter offers up-to-date market news, analysis and insights. Subscribe today!
"*" indicates required fields
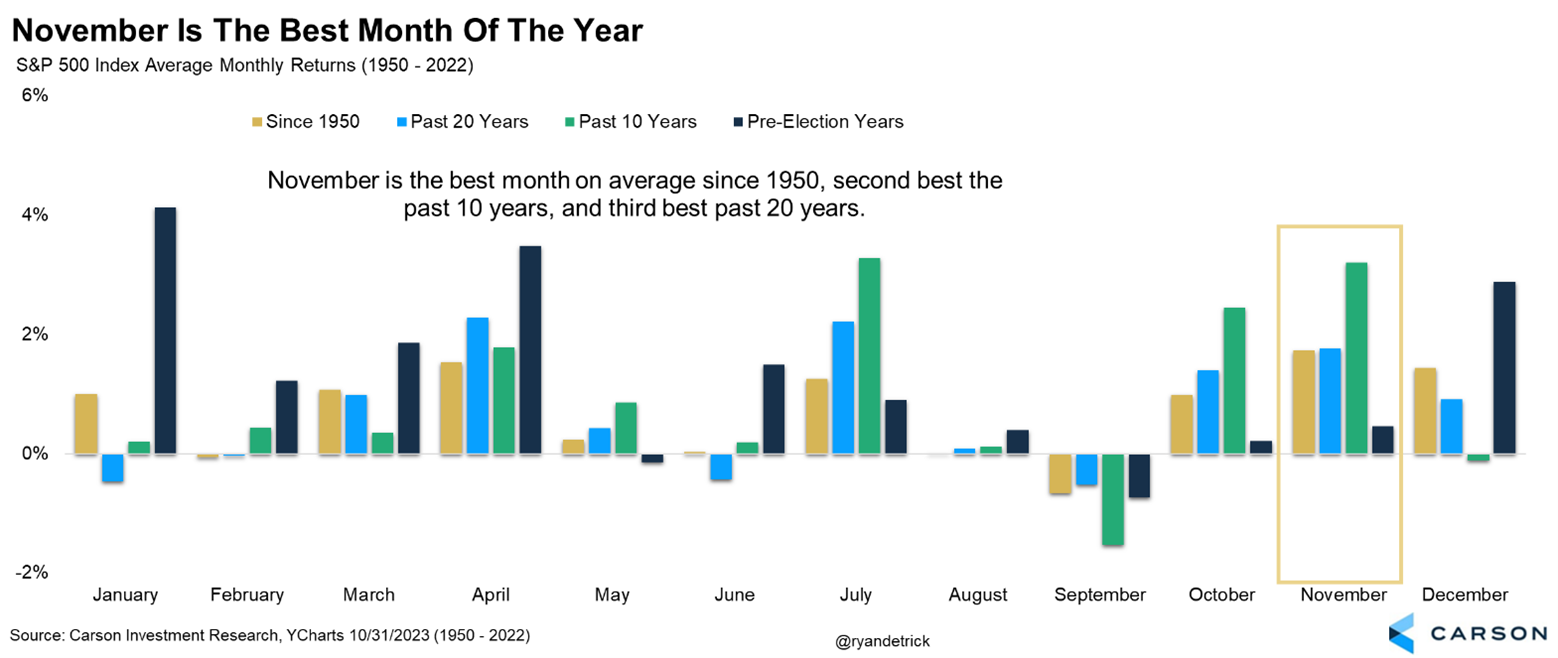
Let’s talk about November for a second. Did you know this has been the best month of the year for the S&P 500? And it has been quite strong the past 10 and 20 years as well? Yes, you should never blindly invest based on just the calendar, but we wouldn’t ignore this information either.
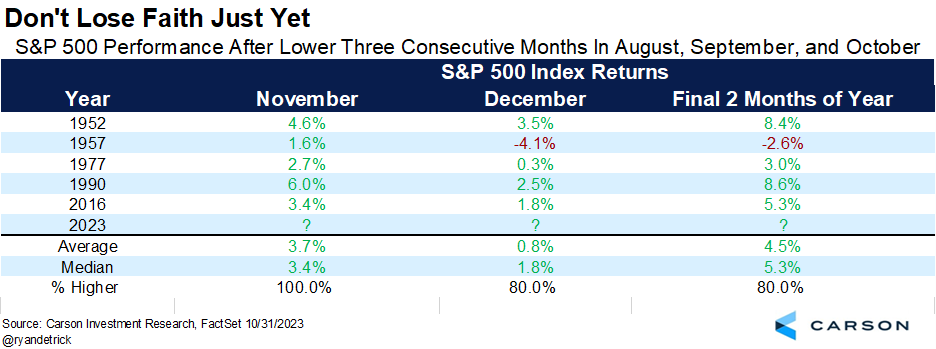
We will end with two interesting studies increasing the odds of a year-end rally. The S&P 500 was down in each of the past three months, heading into the normally bullish month of November. It turns out persistent weakness ahead of November could be a positive sign for the remainder of the year, with November higher every time (back to 1950) and the final two months together tended to do well also. The last two times we’ve seen this were in 1990 and 2016, with both years experiencing big end of year rallies the final two months.
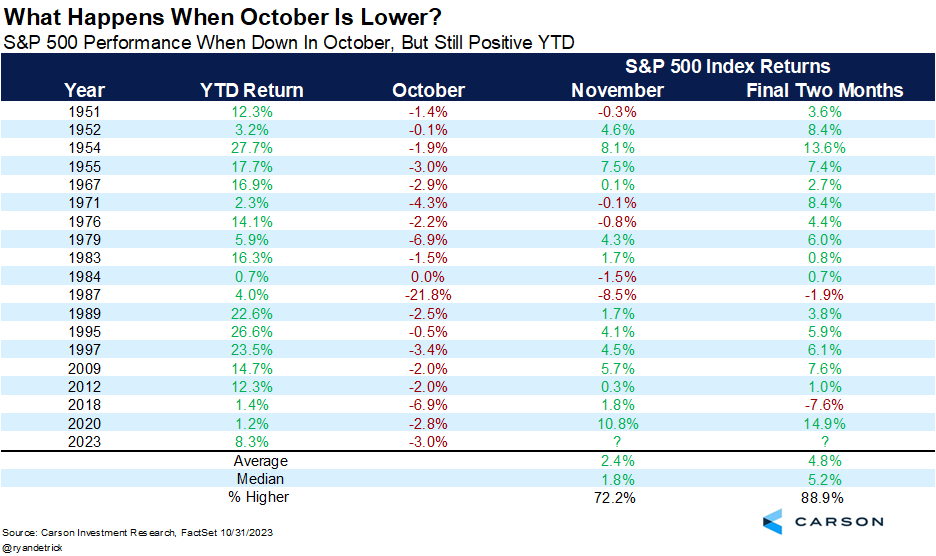
Lastly, stocks were lower in October, but still up on the year. October has seen some spectacular crashes, but this year saw more modest weakness, with stocks still up nicely for the year. We found that under this scenario stocks have been higher the past 7 times in November and the final two months together have been strong overall as well.
For more of our thoughts on the economy, inflation, the Fed, and a year-end rally, be sure to listen to (or watch) our latest Facts vs Feelings podcast with Sonu and myself.
1959927-1123-A
