
“There are no bad assets, only bad prices.” Howard Marks, Co-chairman of Oaktree Capital Management
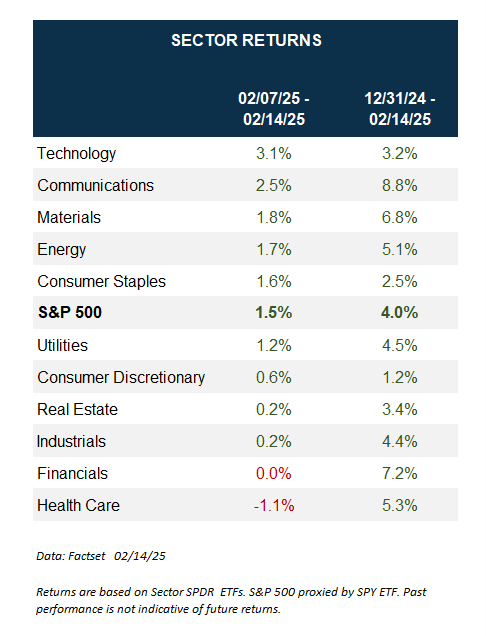
As of last Friday, the S&P 500 was only 0.07% away from yet another new all-time high. It is up a very solid 4.0% year to date, after gaining 23% last year and 24% in 2023. (Both were over 25% if you include dividends.) What stands out to me is how broad this rally has been, with all 11 sectors up on the year and seven outperforming the S&P 500. We’ve been in the camp that this year would see more broadening out and we fully expect this to continue. It isn’t about only seven companies anymore. 💪
Beware the Calendar 📅
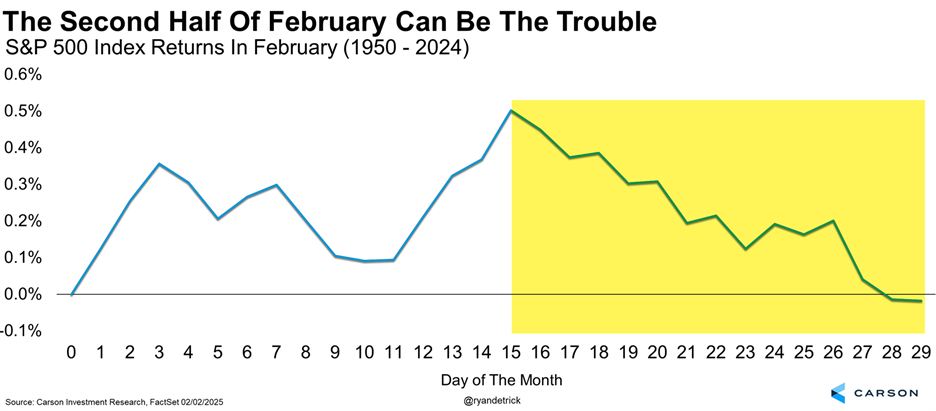
Let’s get the bad news out of the way. Be aware the calendar isn’t doing anyone any favors right now. We’ve noted recently that February in a post-election year tends to be quite weak, but it is really the second half of the shortest month of the year when most of the pain comes. We are still quite bullish overall, but our take here is to be open to some choppy markets over the coming weeks, as that would be perfectly normal.
Here are two ways to show what I’m trying to say, with both showing things tend to turn right around Valentine’s Day.
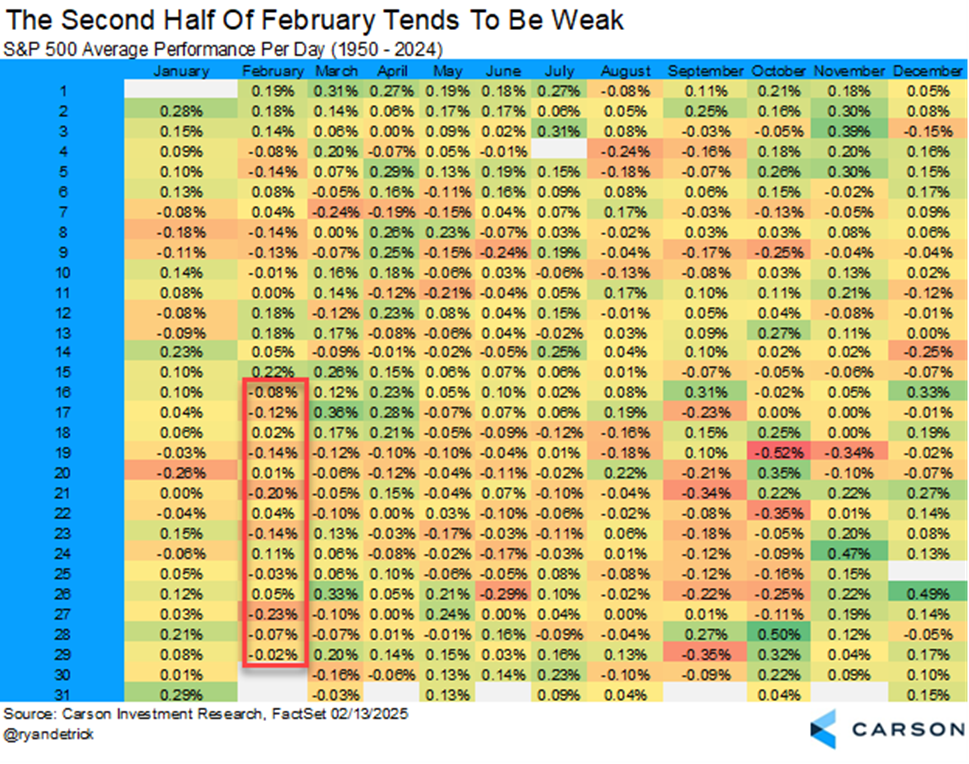
The table above is always a fan favorite and it is good to see that my birthday (October 28) is still the most bullish day of the year. 😁
The Valentine’s Day Indicator 🌹🌷🥀
Now for the good news. Stocks are up more than 3% year to date as of Valentine’s Day (+3.97%) and this is historically a great sign. We dubbed this one the Valentine’s Day Indicator and it suggests a good deal of green could still be in store in 2025.
We found 32 other times the S&P 500 was up more than 3% YTD as of Valentine’s Day and the rest of the year was up an incredible 30 times with an average return over the rest of the year of nearly 14%! This is well above the average rest-of-year return of less than eight percent.
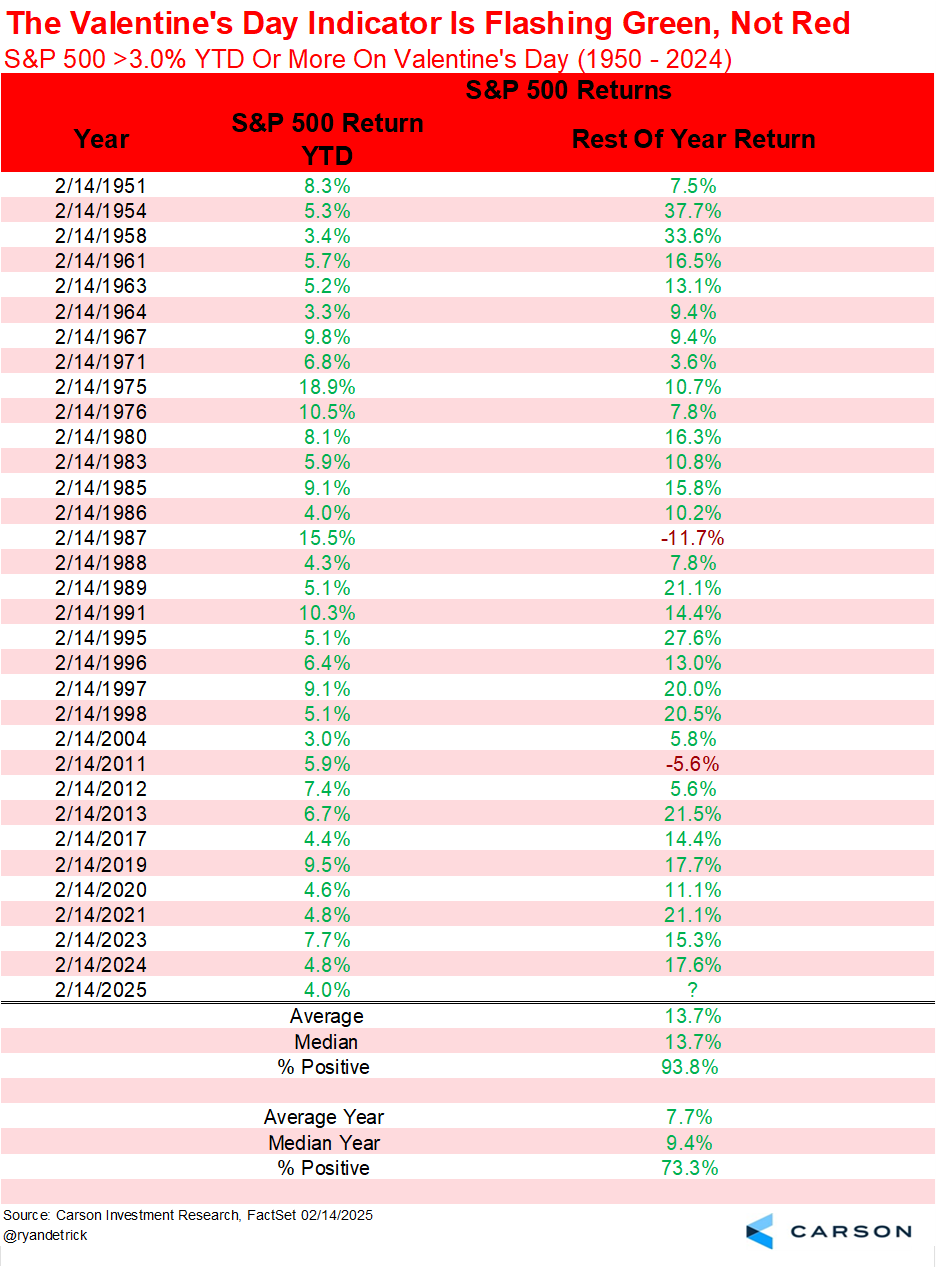
Take a closer look at the table above and you’ll see the past seven times the Valentine’s Day Indicator triggered, the rest of the year was up double digits every single time. Yes, this is just one indicator, but this does little to change our stance of remaining overweight equities with a full year forecasted return of 12–15% for the S&P 500.
Stay on Top of Market Trends
The Carson Investment Research newsletter offers up-to-date market news, analysis and insights. Subscribe today!
"*" indicates required fields
I joined Scott Wapner last Thursday on CNBC’s Closing Bell and we covered many of these concepts. Want to know how the sausage is made? I fully expected to be bumped, as President Trump had a press conference that went long, but they found a way to fit me in and I had a solid four minutes with Scott. Enjoy!
For more content by Ryan Detrick, Chief Market Strategist click here.
7646895-0225-A