
2023 has been a year unlike any other, then again, all years are unlike other years. From everyone expecting a recession and continuation of the bear market at the start of the year, to the regional banking crisis in March, to one of the best first halves to a year for stocks ever, to a seasonally rough third quarter, to the terrible war in the Middle East, to the standard late October low and year-end rally. Yes, I’ve added that last prediction ahead of time, but we do feel confident we will see a chase into the New Year.
It really is amazing though how this year has played out to form. Pre-election years tend to be strong, especially when you have a new President. Not to mention there still hasn’t been a recession in a pre-election year since WWII. August and September were rough and stocks corrected into a typical late October panic low. Sure, things weren’t that simple, but when you look back, it is incredible how well things played out to the potential script.
Stay on Top of Market Trends
The Carson Investment Research newsletter offers up-to-date market news, analysis and insights. Subscribe today!
"*" indicates required fields
So what could be next? Do we think this bull market that started in October 2022 has legs? We sure do. In the end it comes down to the macro backdrop and as we’ve explained for months now, the economy is on firm footing. Sure, things are ‘slowing down’ some, but we like to say they are normalizing, not slowing down. Could we really keep growing at 400k jobs a month like last year? No, but a steady 150k to 200k is perfectly normal and in line with pre-COVID trends. The consumer remains strong and incomes are growing at a very healthy clip as well. If we can avoid a recession next year (our base case), then we think the chances of a year with potential low double digits returns is quite likely.
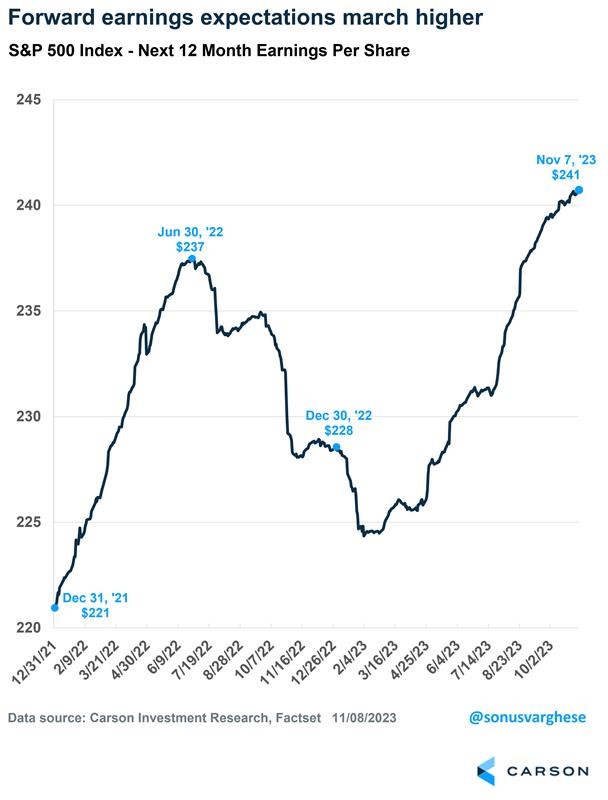
What will help drive stocks higher and likely to new all-time highs during the first half of next year? At the end of the day it is earnings. We’ve seen analysts continue to come in way too low on estimates and this trend likely continues. The third quarter was expected to see earnings fall slightly, now S&P 500 earnings are expected to come in up close to 6 percent. Looking ahead, companies in the S&P 500 now expect to see record profits over the next 12 months. You know what tends to happen when profits are at a record? Stocks tend to follow, something we expect to see in 2024.
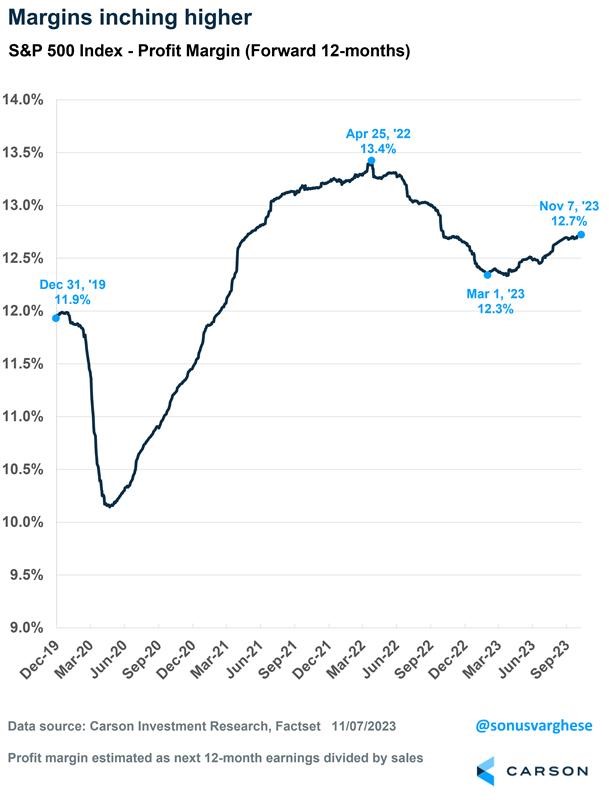
Potentially even more surprising as record profits is profit margins improving. What have we heard nonstop for the past year? Profit margins are too high and must fall. Well, since March we’ve seen forward 12-month profit margins increase. If both profits and profit margins are increasing next year, that should be a nice tailwind for equities.
We noted many times that a pre-election year tends to see strong equity returns, which has played out nicely once again in 2023. Here’s where things get interesting though. Did you know that under a first-term President the returns were weak early, especially during a midterm year, then get much better during the pre-election and election year? Well, so far things have played out quite well with a very weak midterm year and solid pre-election year. Why is this? It could be as simple as when a President is up for re-election there are certain levers they can pull to get the economy and thus stocks into a better mood. In fact, 2000 and 2008 were horrible years for stocks, yet those were lame duck Presidents in an election year.
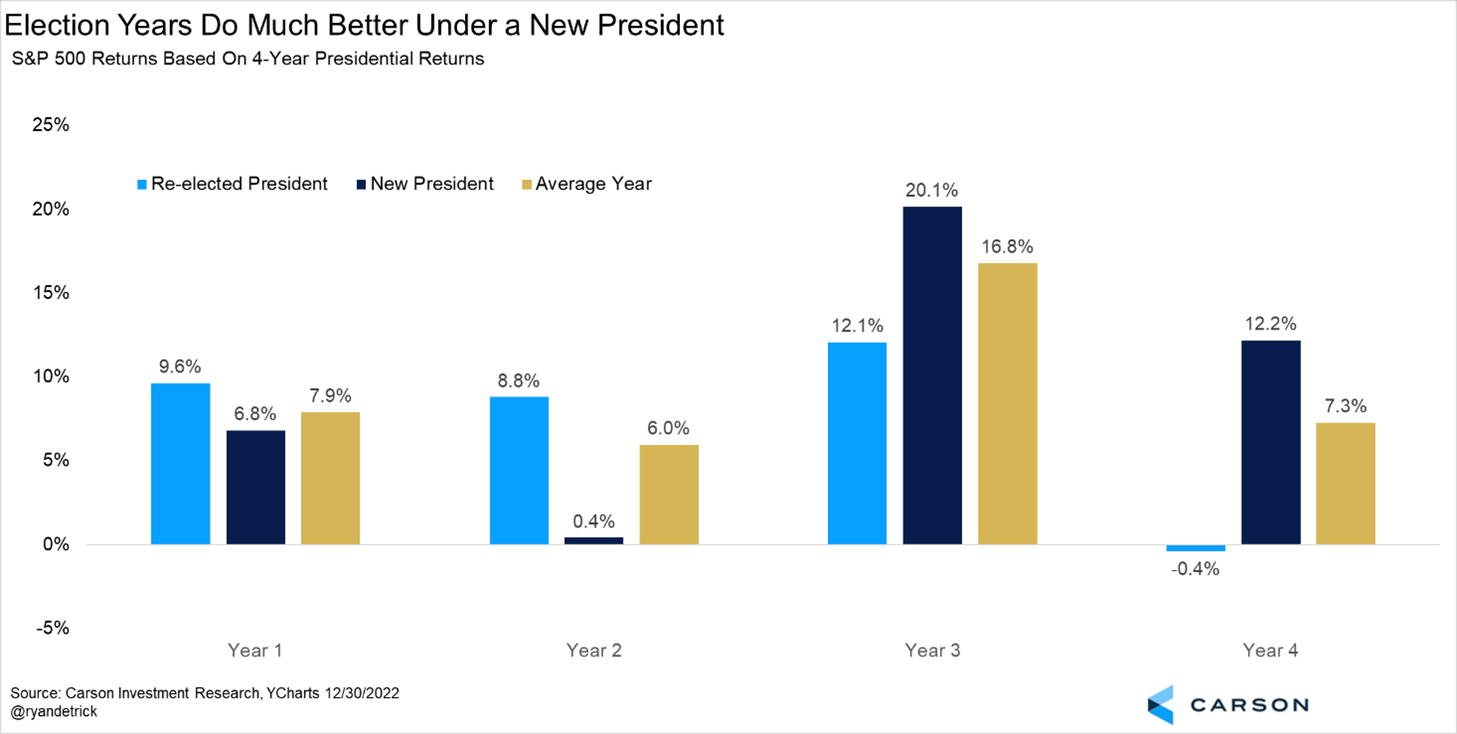
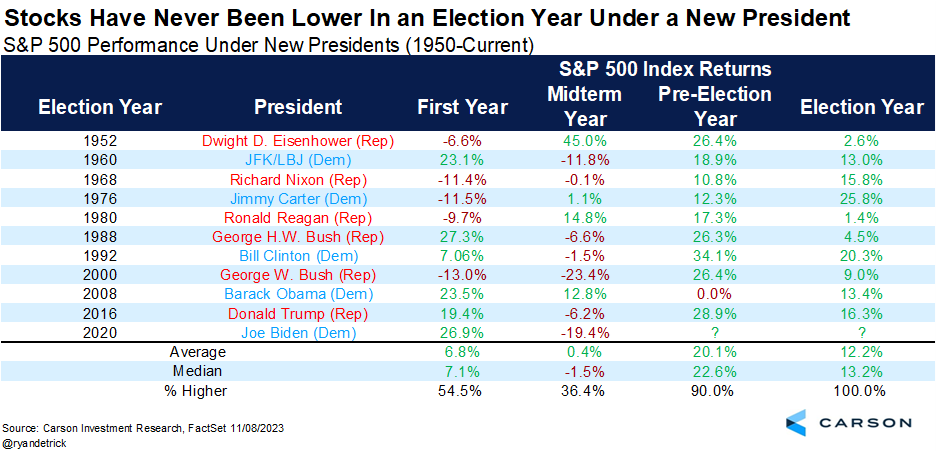
Diving into the data more showed a very interesting development and that is stocks have been higher during an election year of a new President going back to the past 10 Presidents! Even the historically strong pre-election year can’t say that. Higher the past 10 times and up 12.2% on average isn’t anything to ignore and that is inline with a potential low double-digit return in 2024.
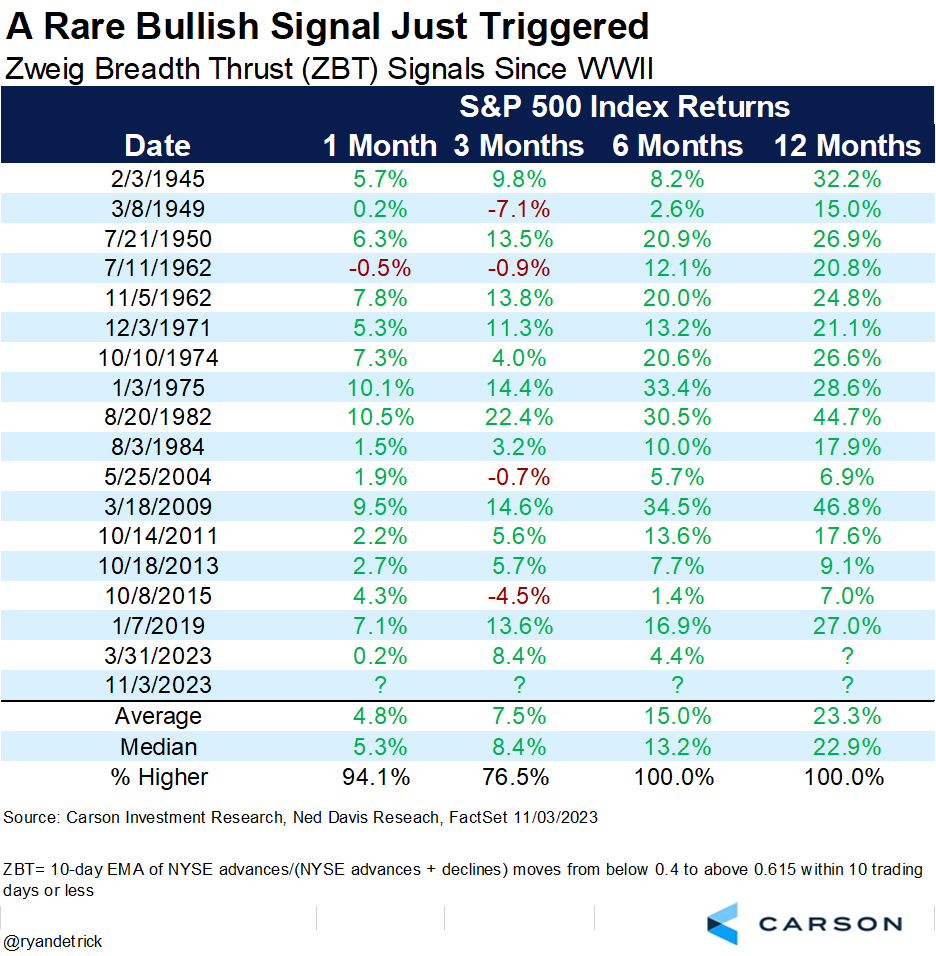
One final bullish development just happened last week, we saw a Zweig Breadth Thrust (ZBT).
From Investopedia:
Known as the Zweig Breadth Thrust Indicator, named for American stock investor and financial analyst Martin Zweig, the calculation measures how quickly sentiment in the market shifts.
It does so by dividing the 10-day moving average of the number of advancing stocks by the total number of stocks. When it “thrusts” from a level below 40% to more than 60% in a 10-day period, it triggers a signal. You can read more about this signal here.
The bottom line for readers is this happens when stocks go from very oversold to very overbought in a quick fashion. Think of it like a washout and then buyers step in big time. Again, this is rare, with the previous 16 times it had happened (back to WWII) that had a year of data after the signal showed higher prices every single time. Look at those green dots below, not the worst time to expect better times coming.
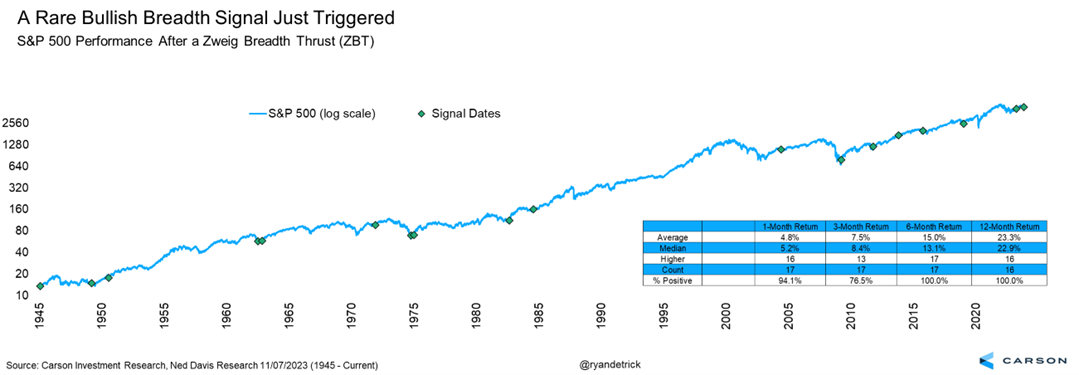
Here’s a table breakdown of all the ZBTs we’ve seen since WWII. Again, up more than 23% a year later and never lower is something I don’t think we should ignore.
For more of our thoughts on the ZBT, why stocks just bottomed, economy, year-end rally, Fed, and more, please be sure to watch or listen to our latest Facts vs Feelings podcast, as Sonu and I break it all down. We also discuss the huge pieces of cake we ate, or rather tried to eat, while hanging out together in Chicago last weekend.
1975262-1123-A
