
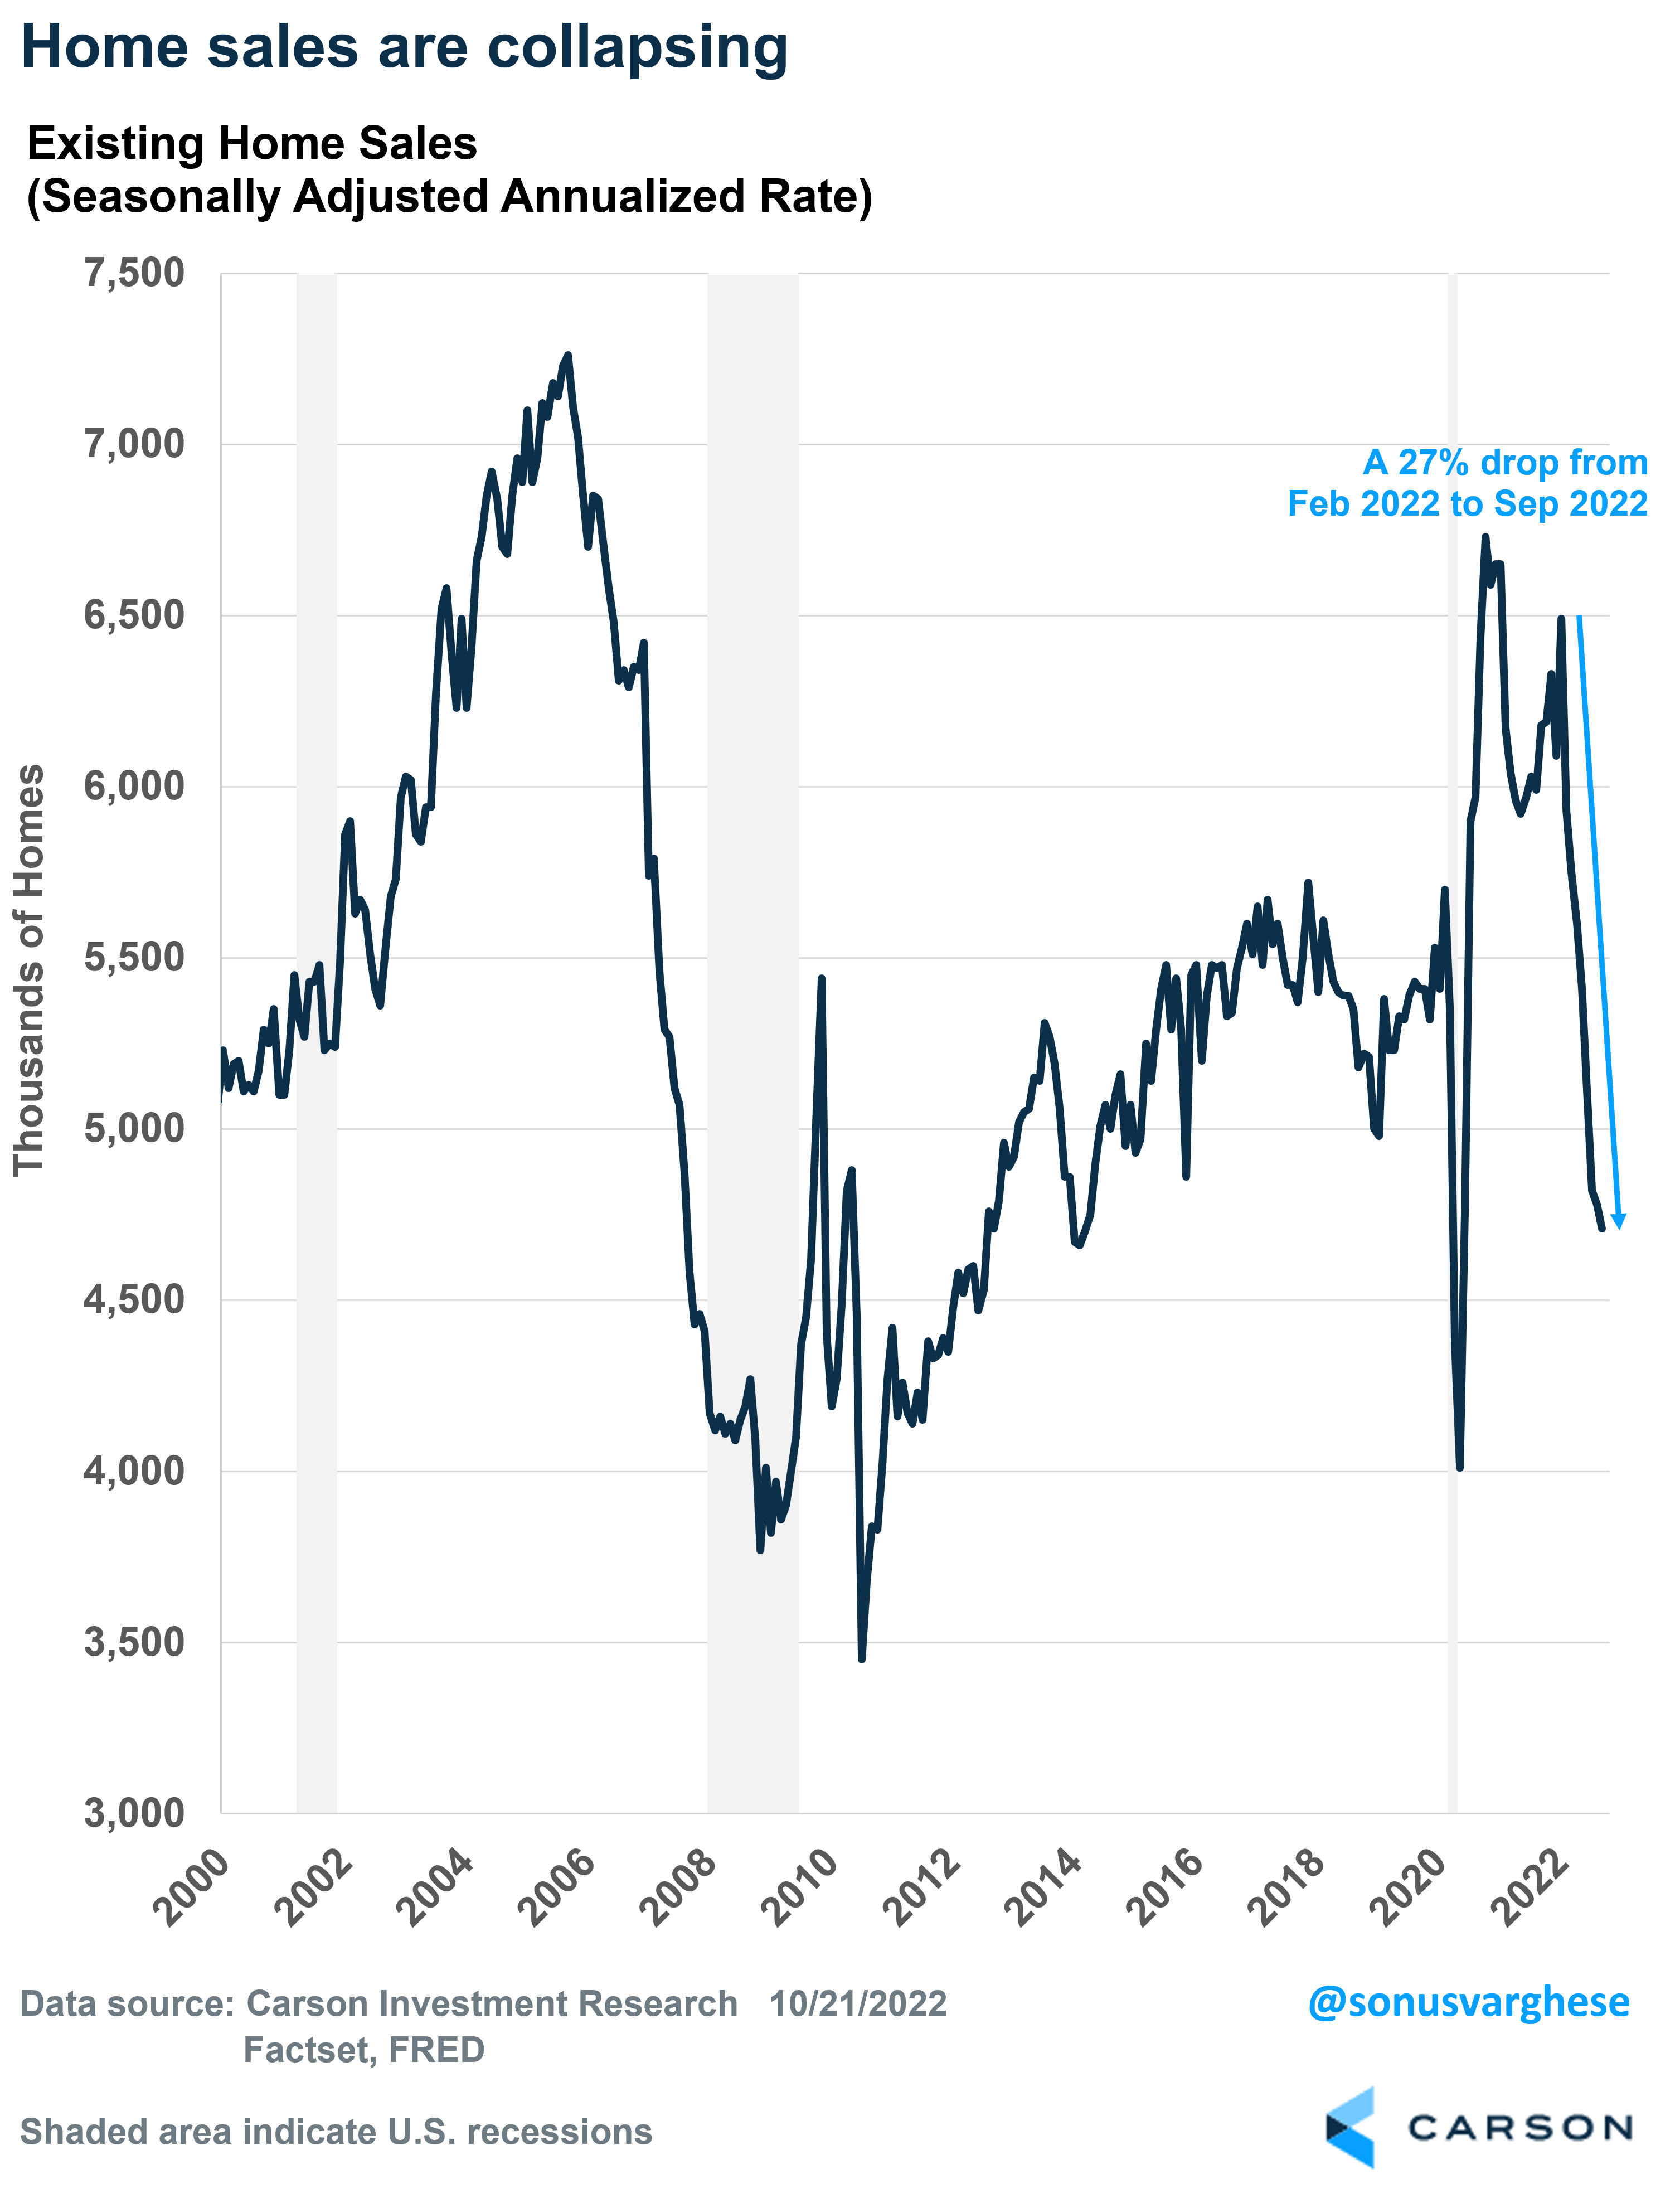
This is a popular question now, and not a surprise given an ultra-aggressive Federal Reserve (Fed) looking to get on top of inflation. Predictably, the housing market is one of the first economic sectors to get hit, as has historically been the case when the Fed raises rates. The 30-year fixed rate mortgage was at 3.11% at the end of 2021. It’s at 6.94% now, the highest level since 2002! So, it’s not really a surprise that sales of existing homes have fallen for 8 straight months through September, for a cumulative decline of 27%.
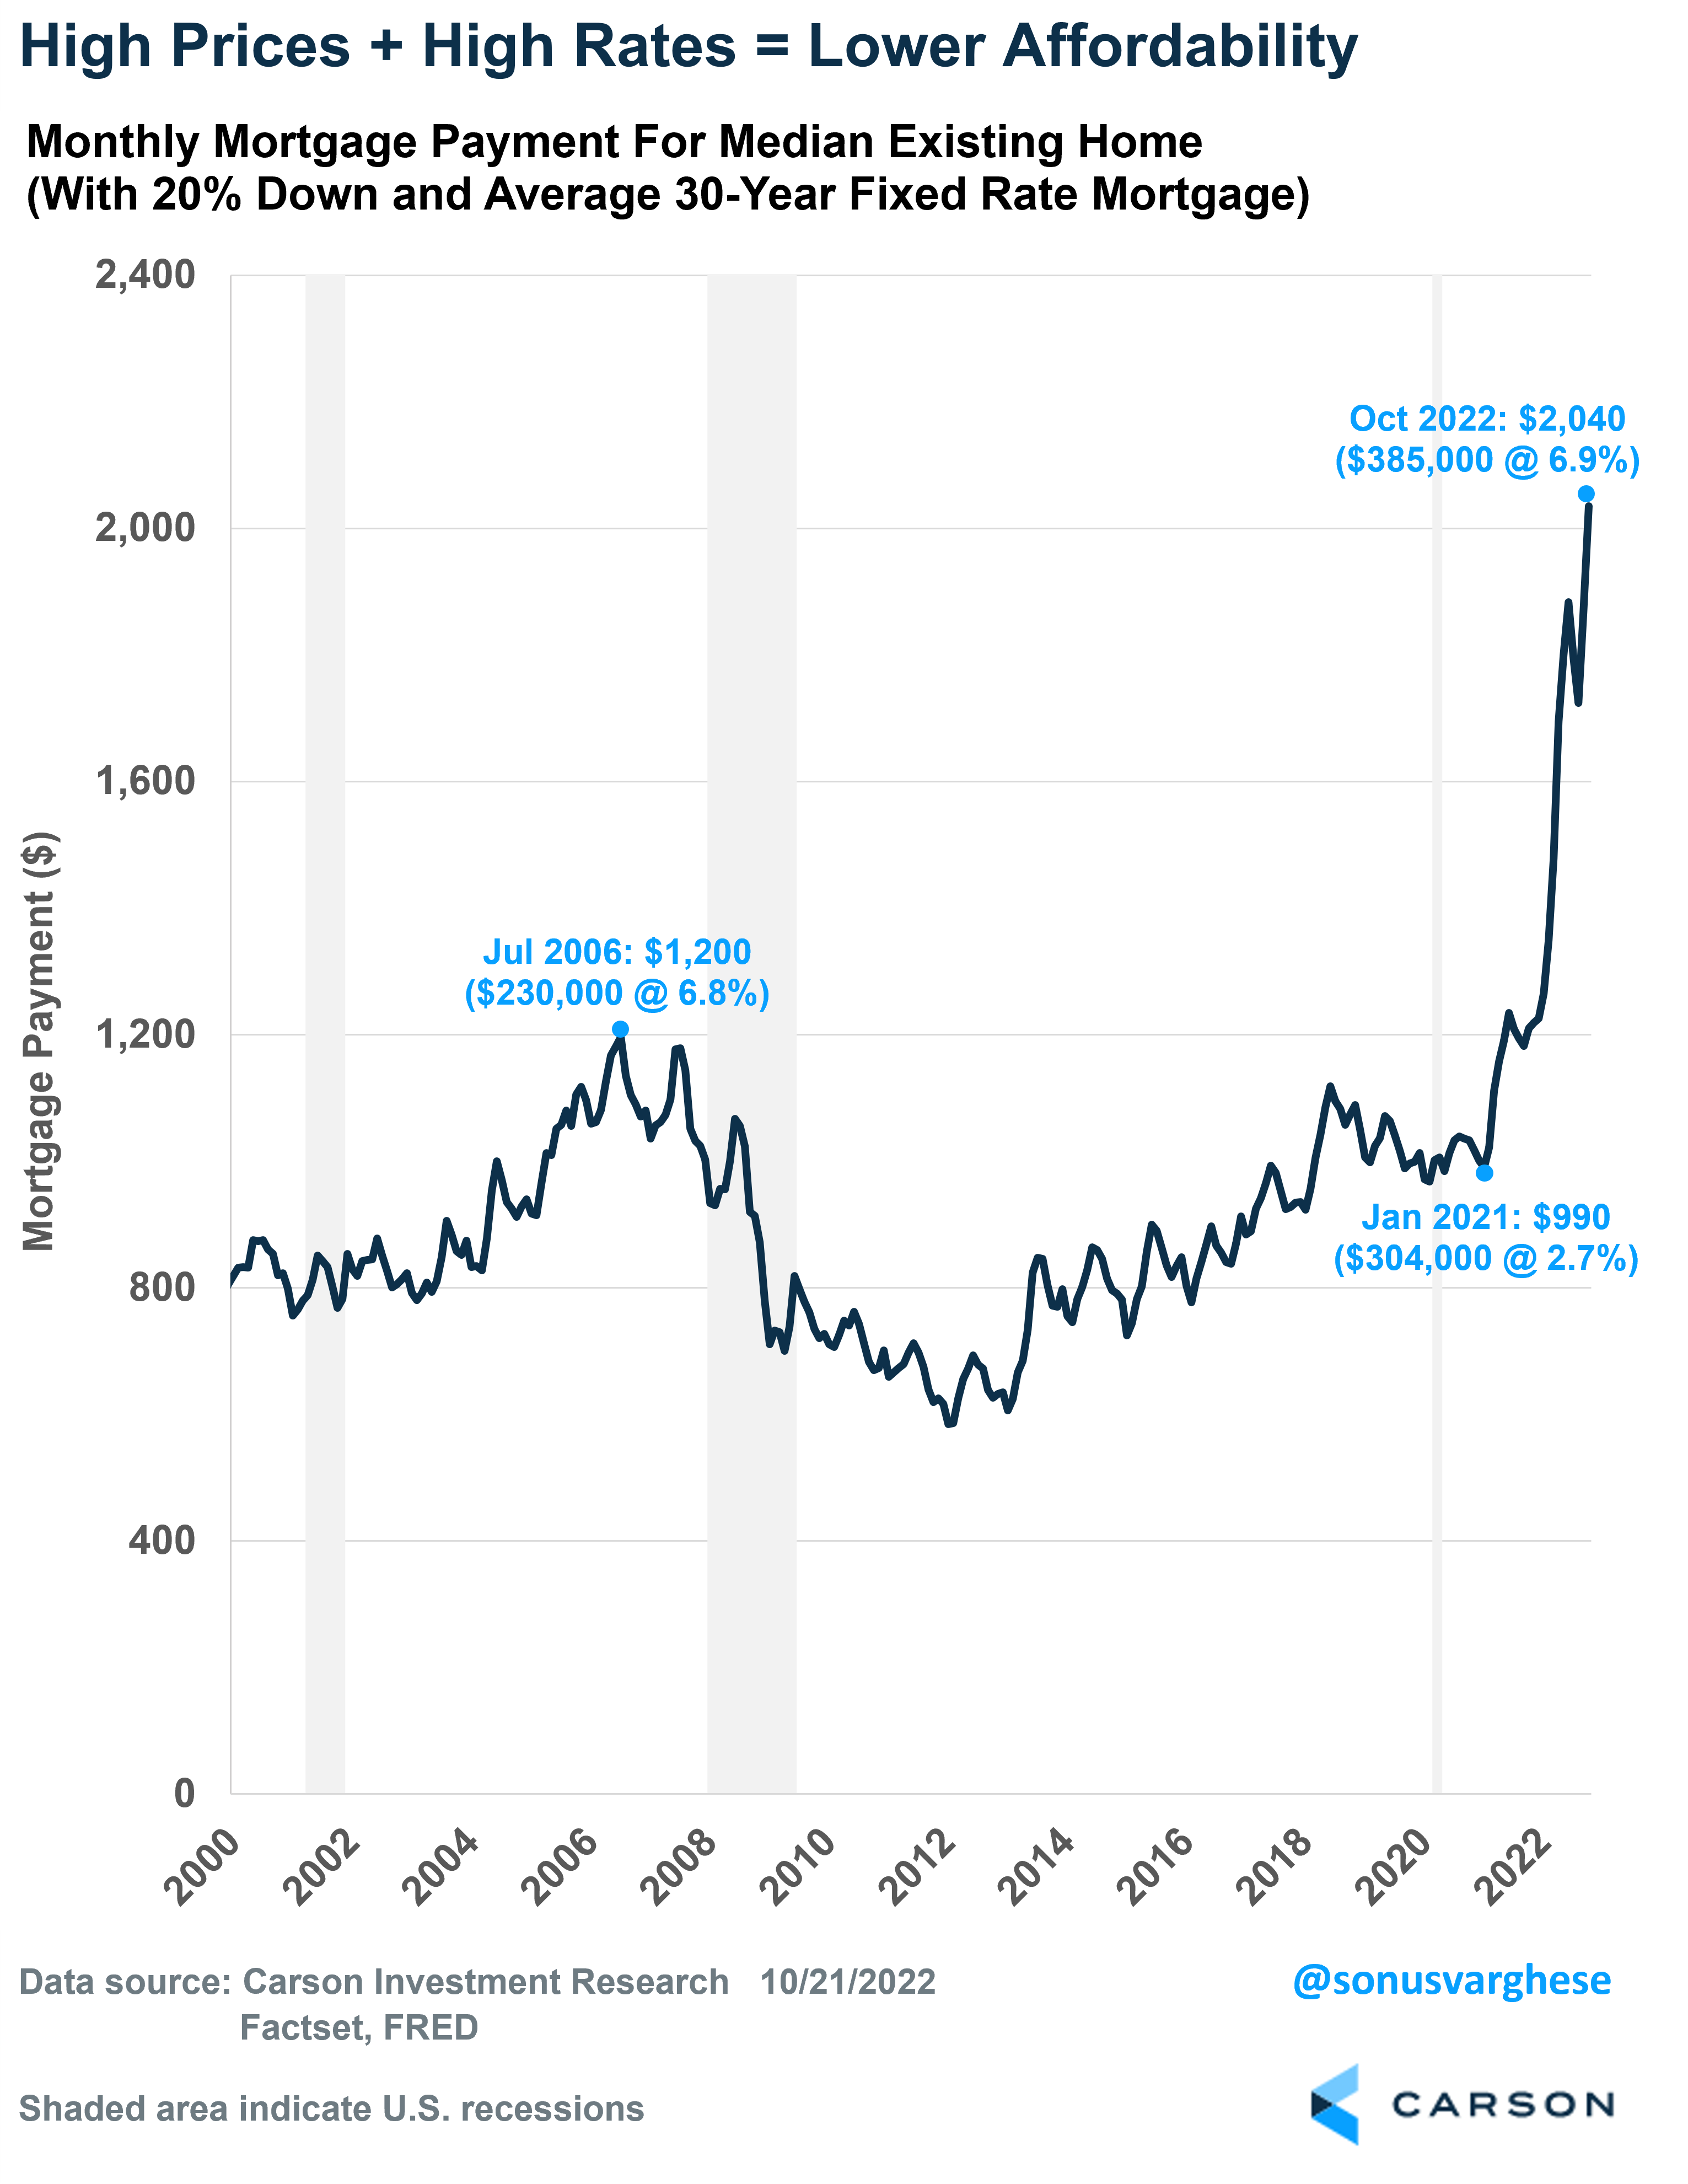
And it doesn’t look like the bottom is in. Home prices have surged almost 40% over the two years through July 2022 (using the Case-Shiller National Home Price Index). Great for homeowners but not great for anyone looking to buy a new home, especially after the surge in mortgage rates. In the following chart I show how the monthly mortgage payment has changed over time – using the median existing-home price, the prevailing 30-year mortgage rate and assuming a 20% down payment. It’s more than doubled since Jan 2021! Affordability is falling at a record pace.
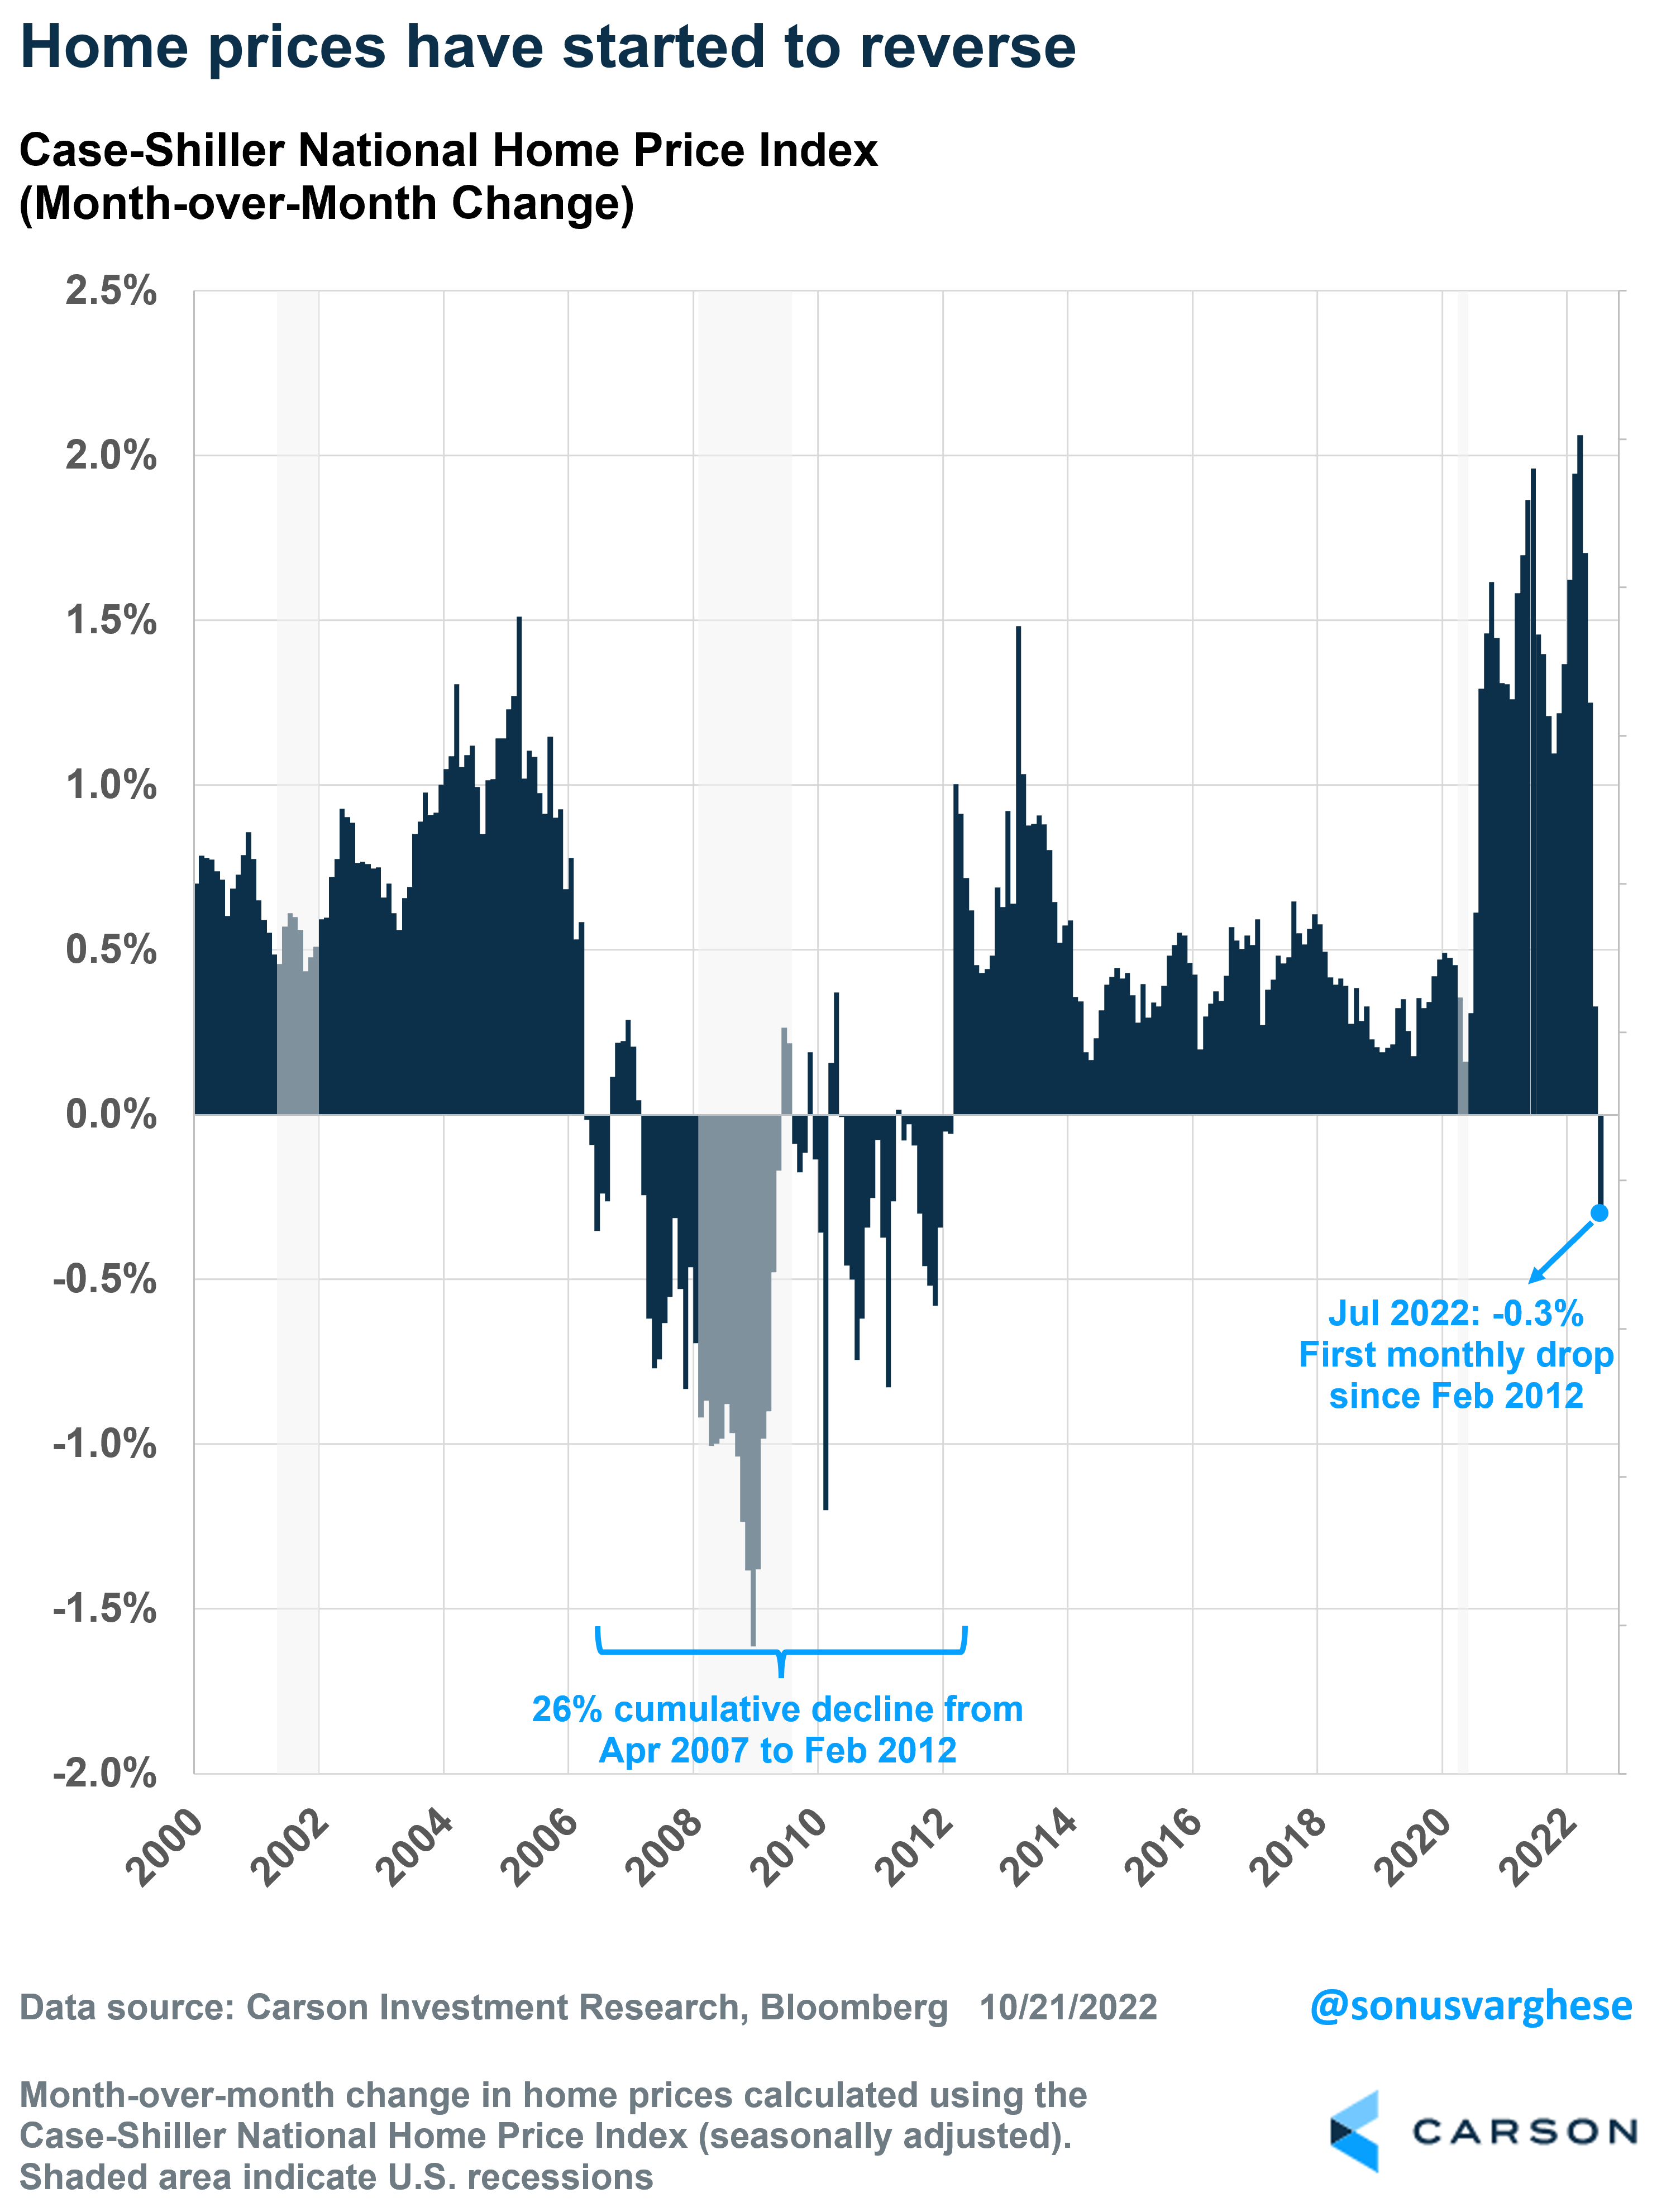
Home prices are responding to lower demand, by moving lower. The Case-Shiller National Home Price Index fell 0.3% in July, its first monthly decline since Feb 2012. On a year-over-year basis, gains peaked at 21% in April and fell to 16% in July – which is still higher than at any point during the bubble, when gains peaked around 14%. However, the deceleration is happening quickly, especially for an index that is a 3-month average.
What about the supply side?
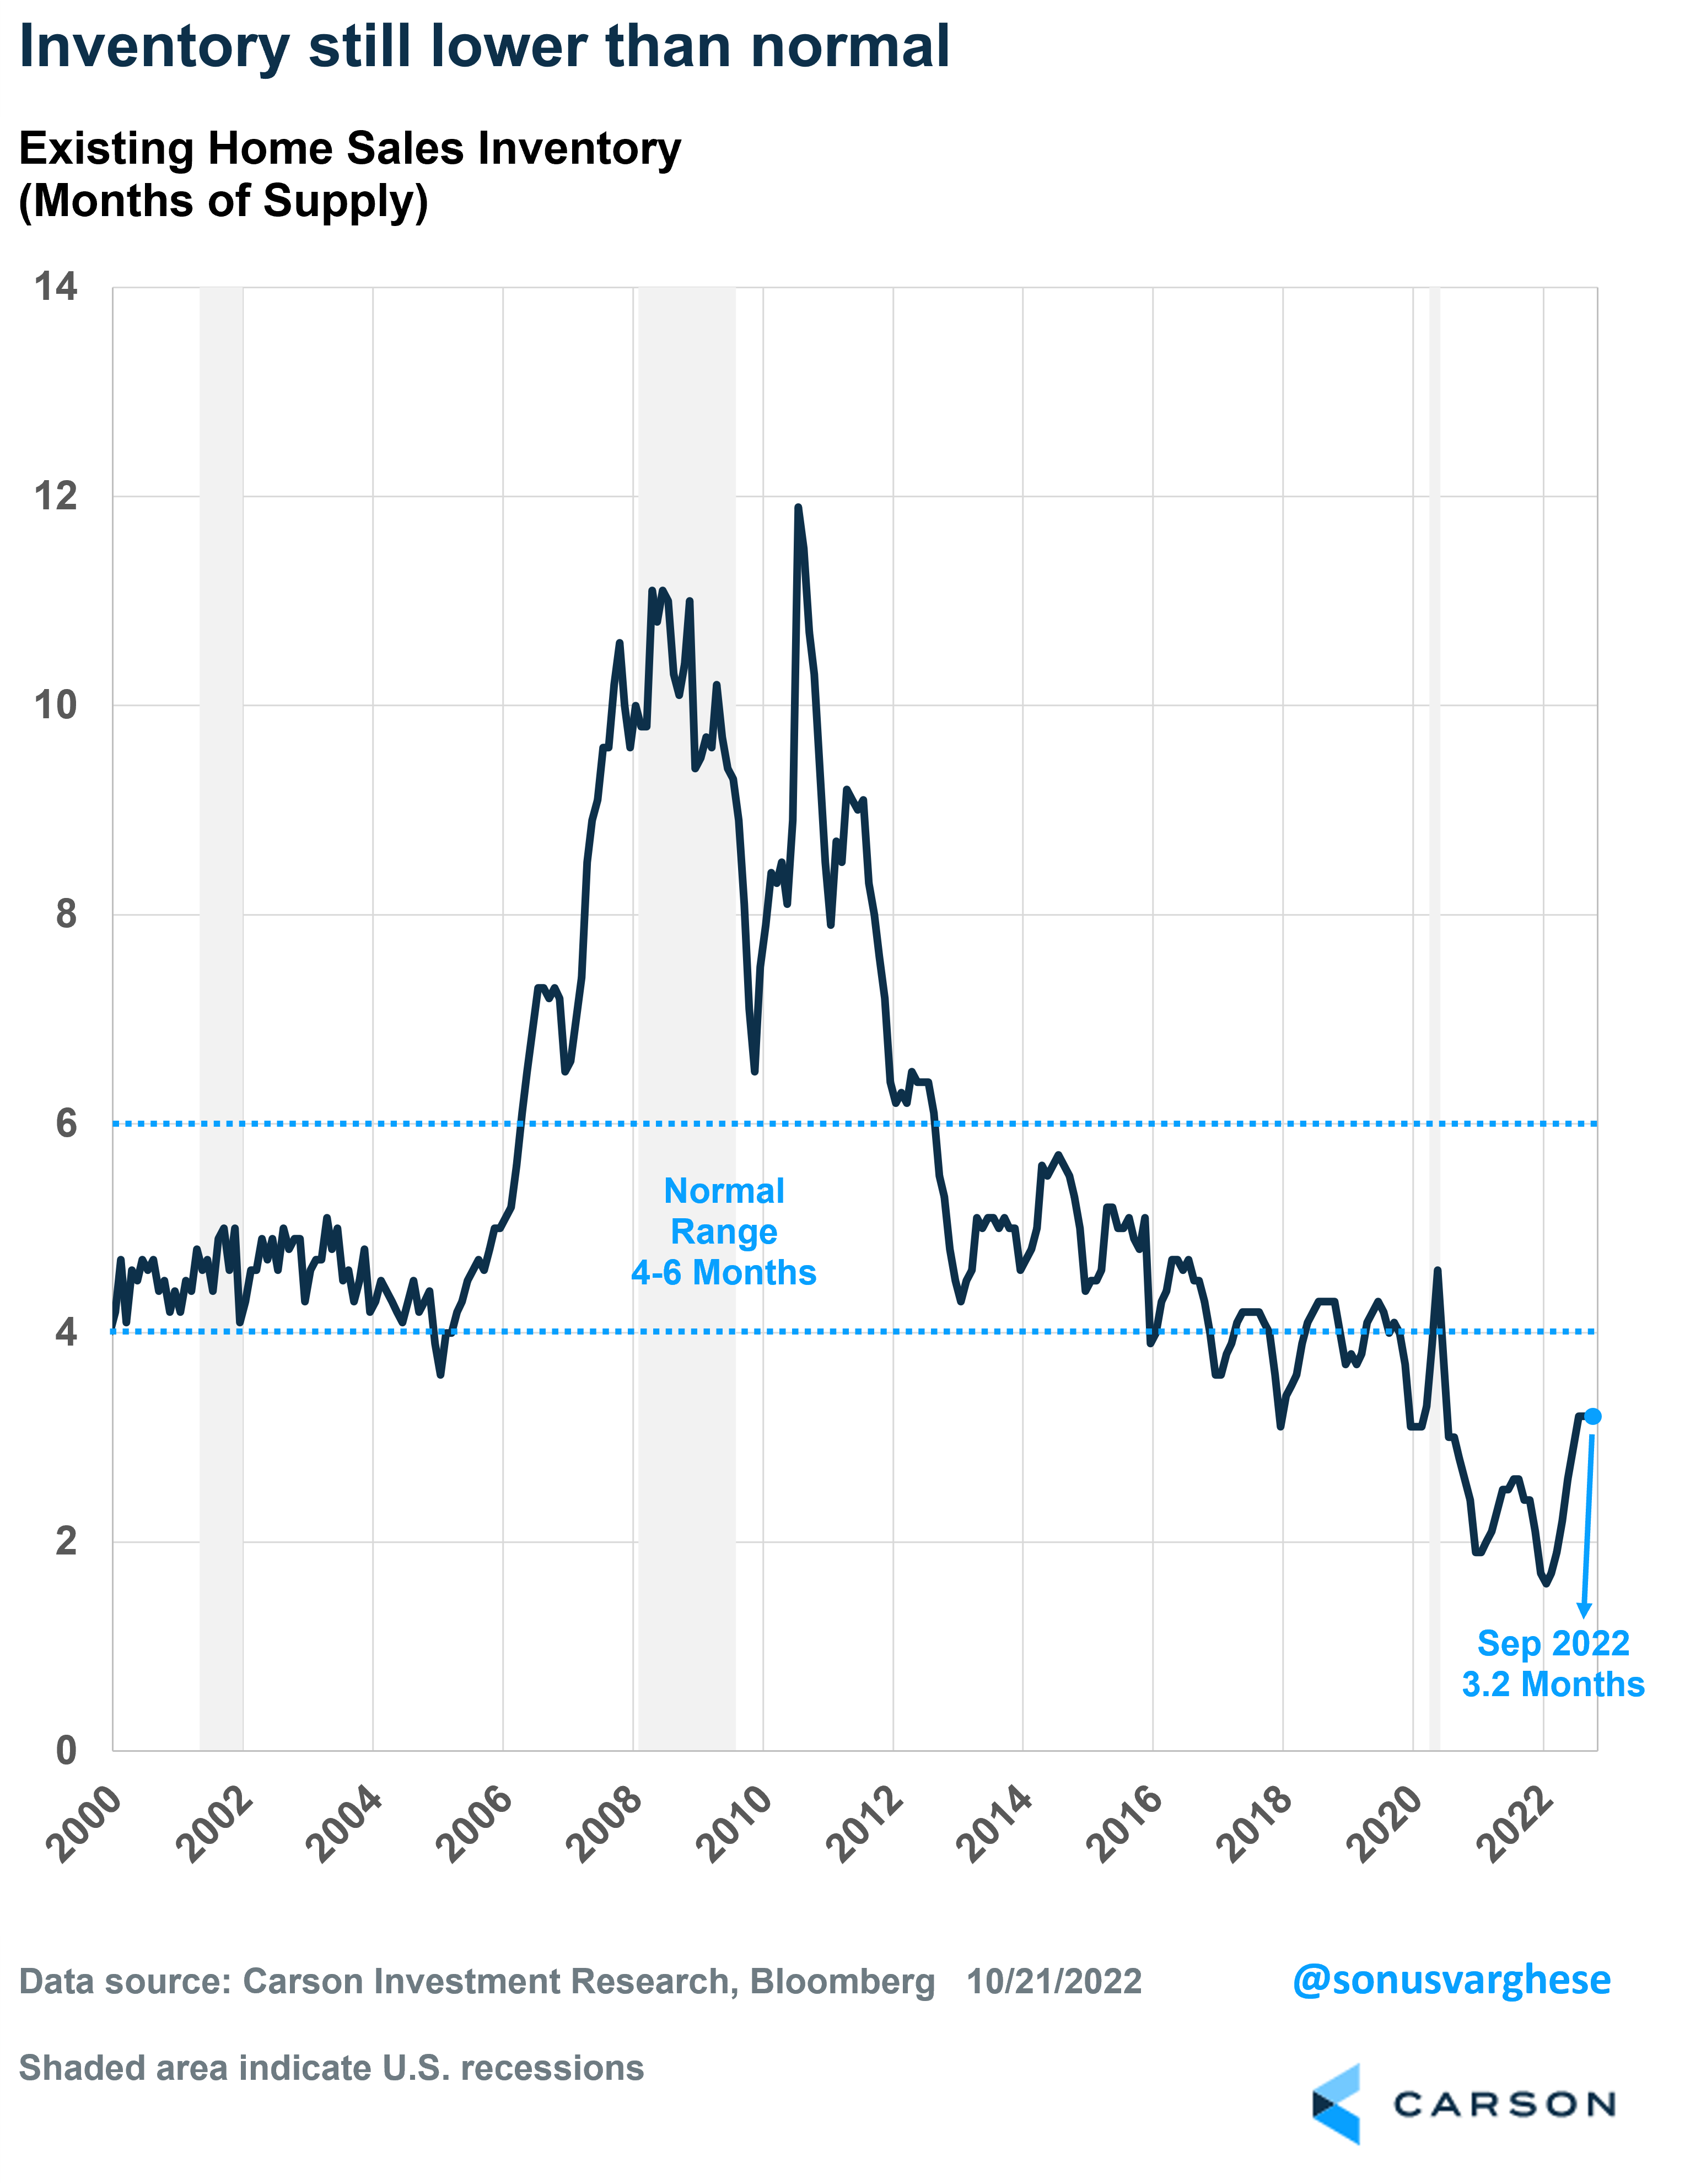
Normally, when demand falls, you would expect supply to increase. Which was what we saw amid the housing crash. Not now. Well, at least not yet. One measure of supply is “months-of-supply”, which is the number of months it will take to sell off the current inventory of homes if sales continue at current pace. This metric is currently at 3.2 months – it hasn’t budged for 3 months now (Jul-Sep). It’s up from the record low of 1.6 months in Jan 2022, but still below what is considered normal, typically 4-6 months.
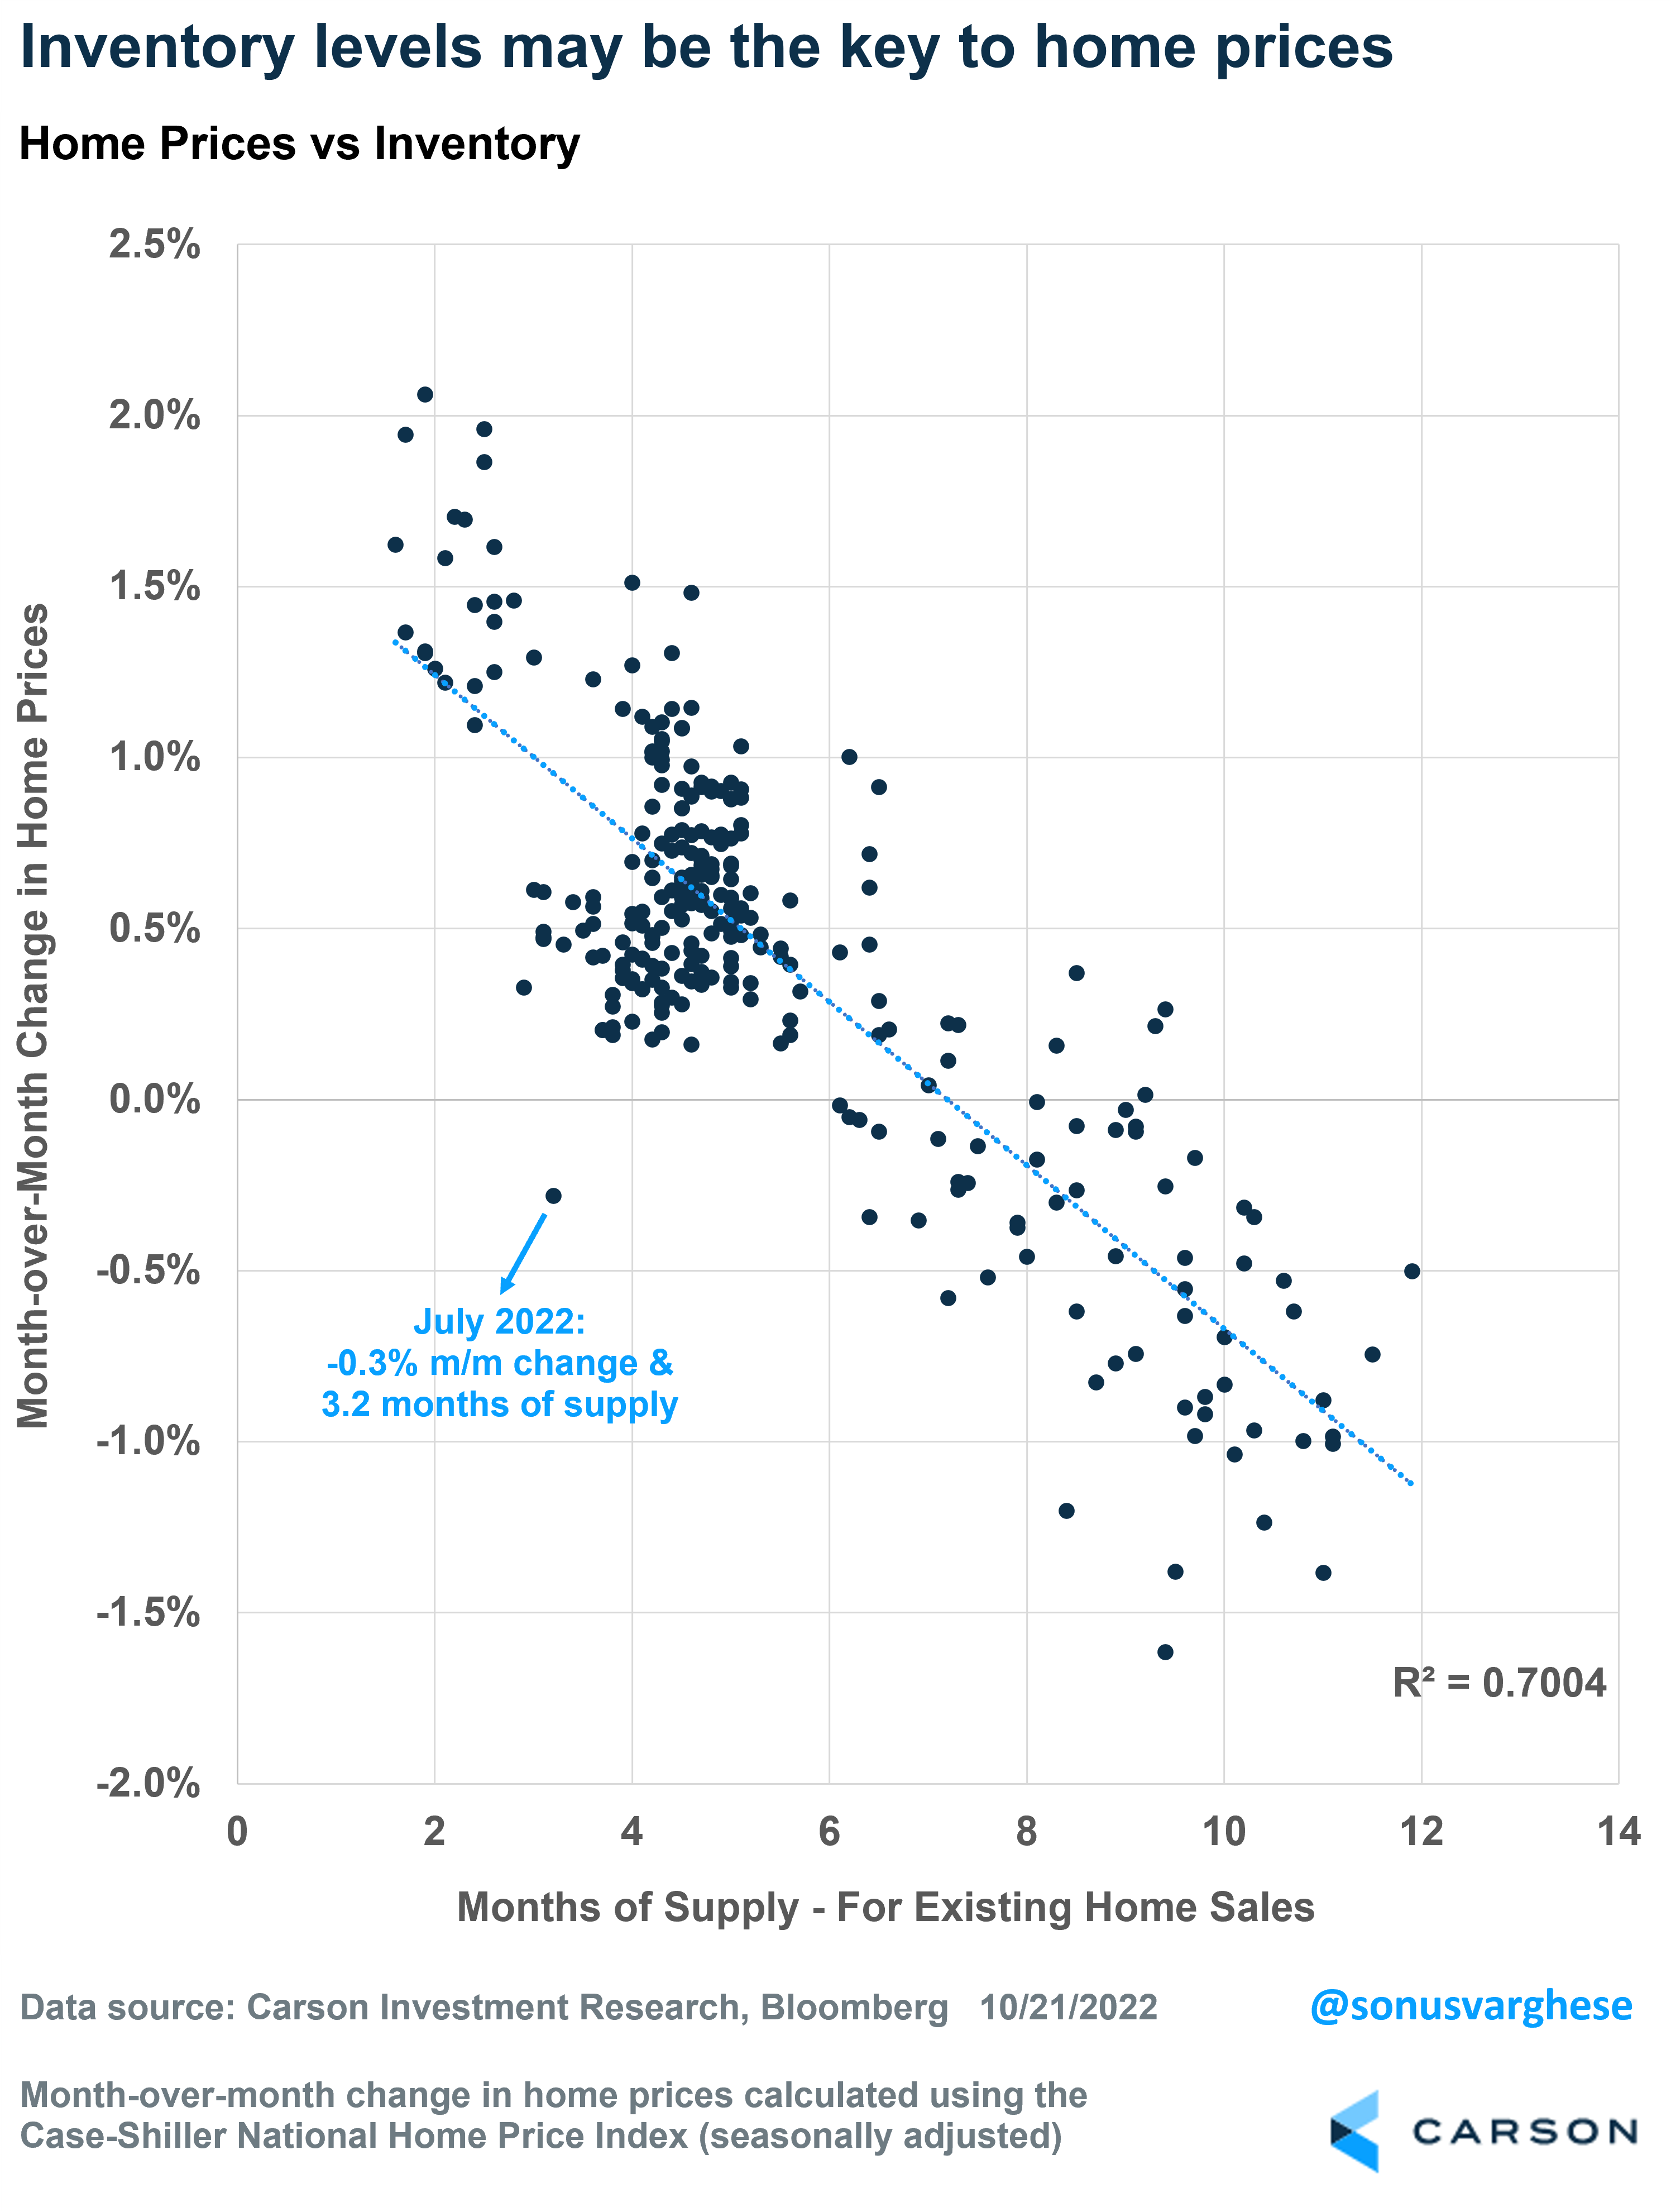
And inventory matters for prices, as the next chart illustrates. Prices rise as inventory falls, and conversely, prices fall as inventory rises. You can see where we are on the chart (as of July), and it is unusual, i.e. for inventory to be well below 6 months-of-supply and for prices to be falling. Something’s got to give – either home prices don’t fall significantly, or inventory rises.
Will inventory rise?
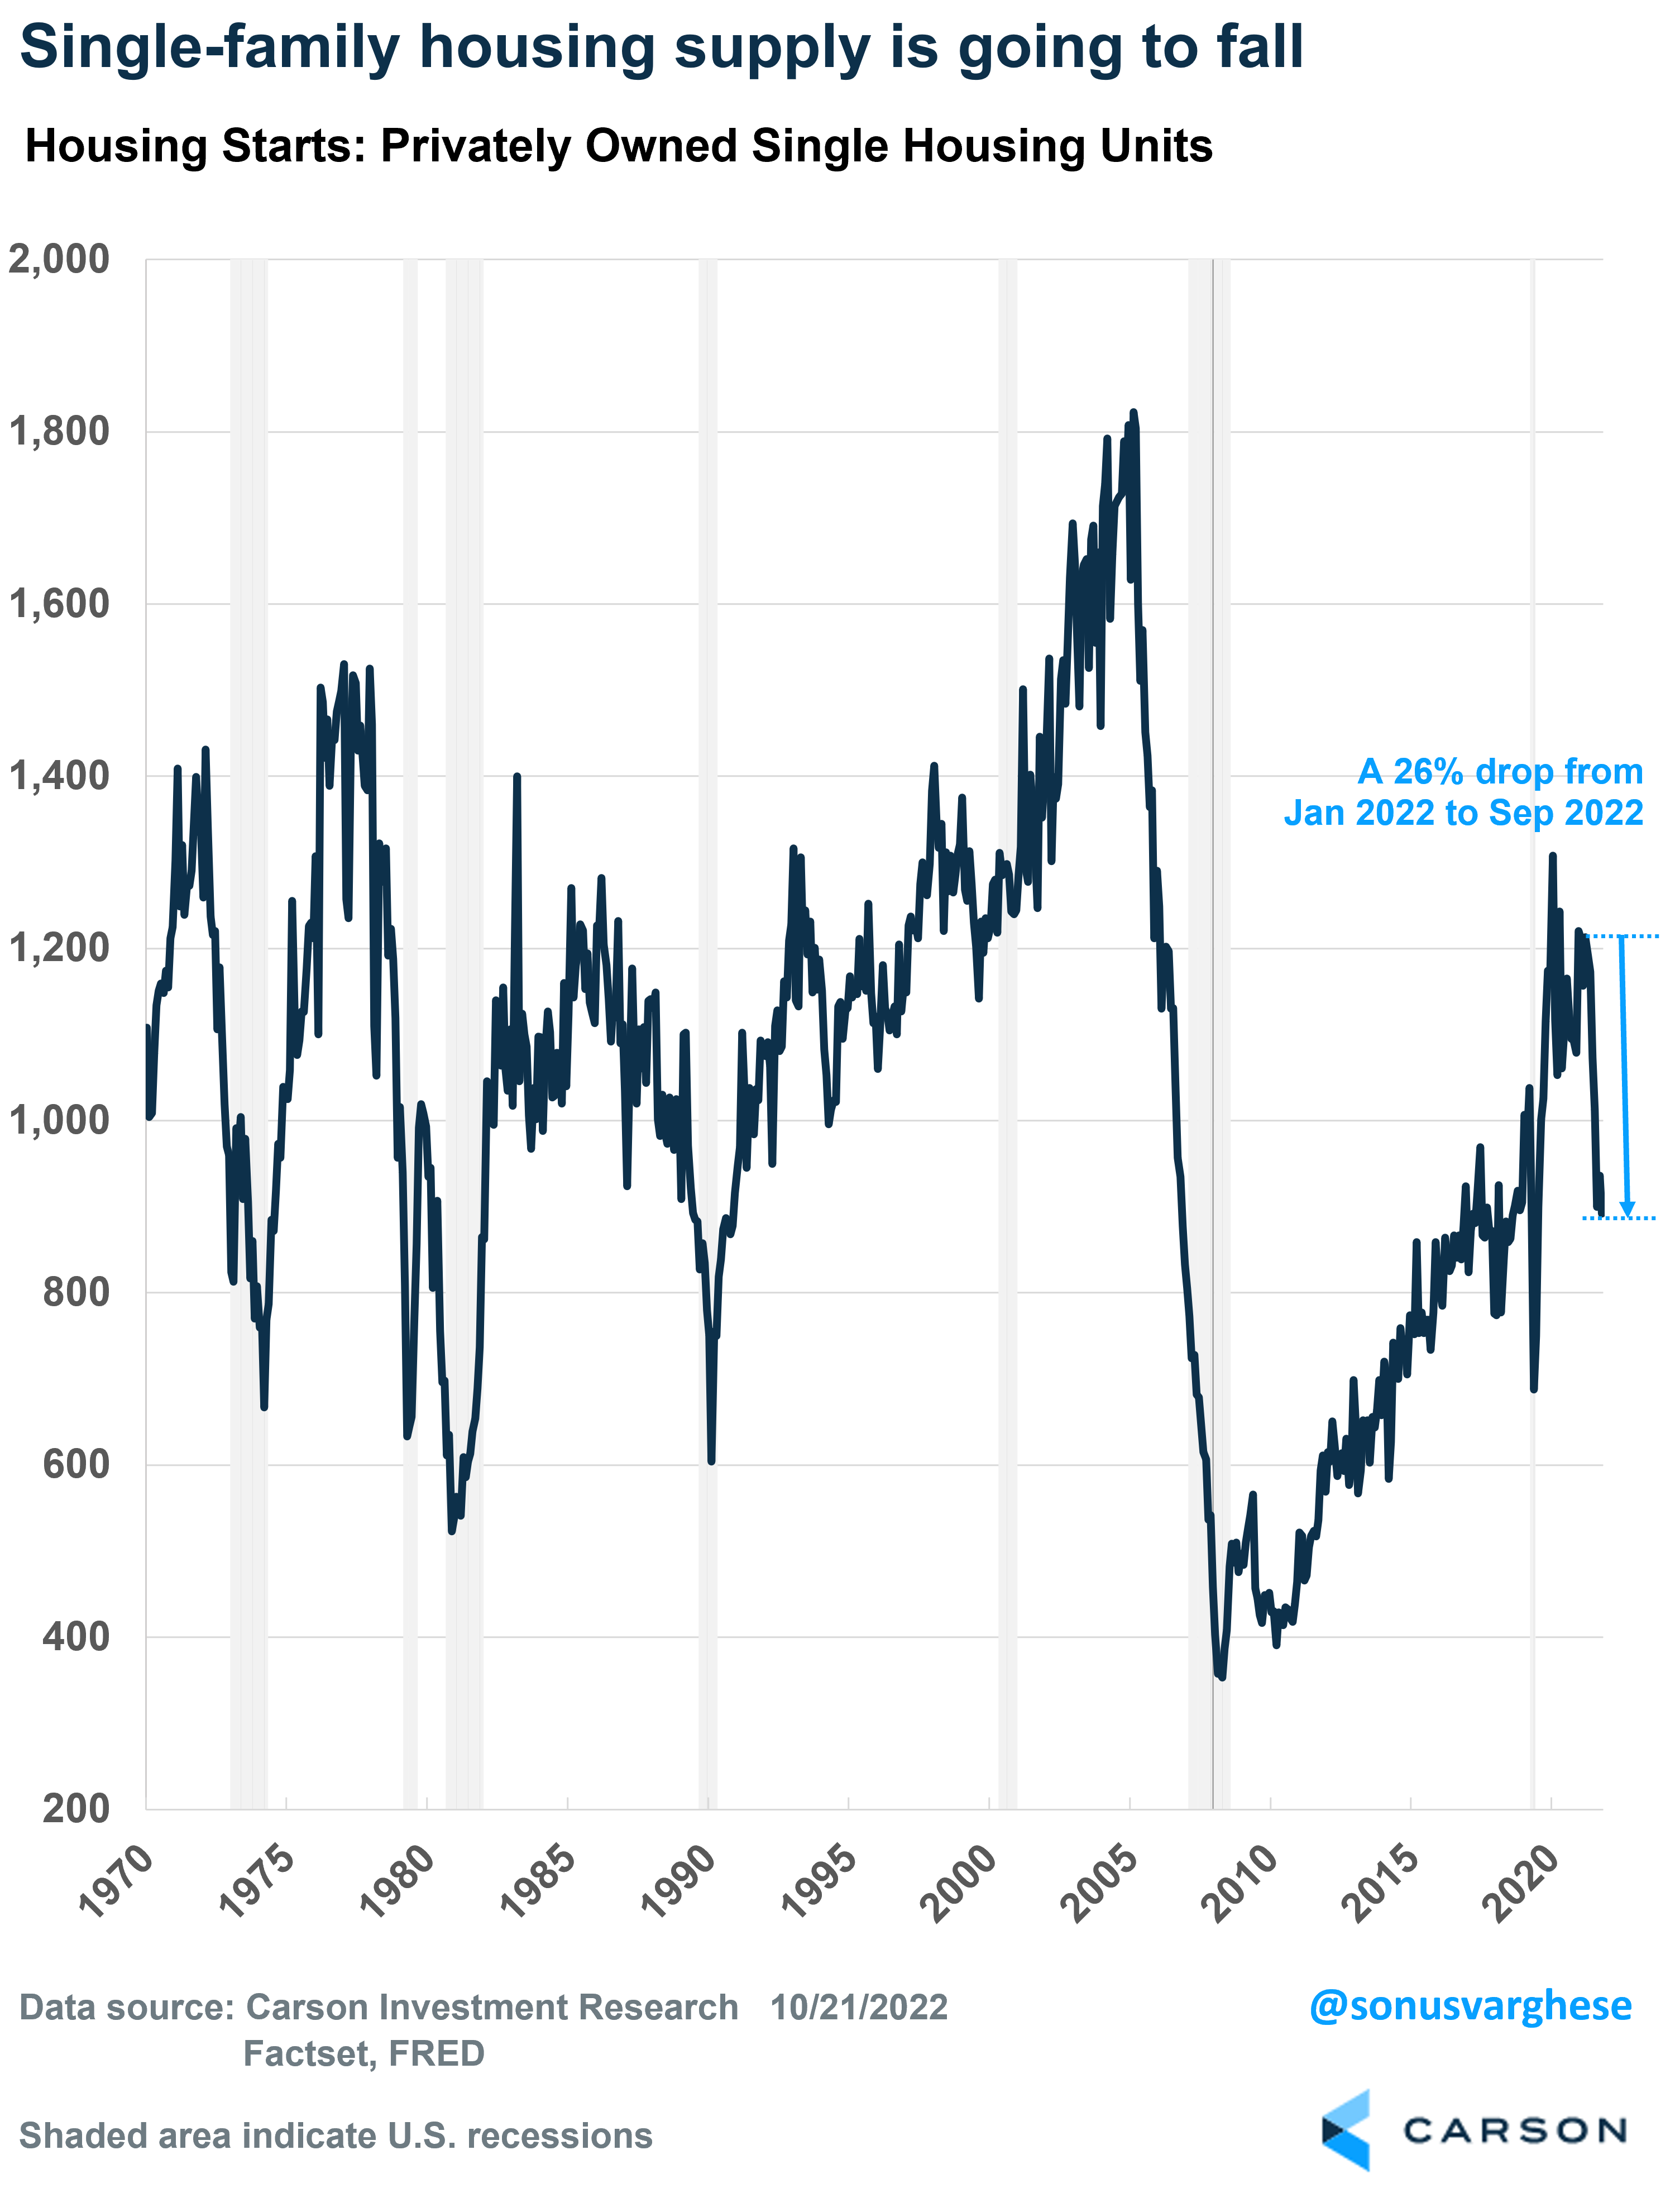
The big question. Well, for one thing there’s not a lot of new supply coming. Single-family housing starts have collapsed by 26% this year (through September) as builders pull back amid rising rates and falling demand. Building permits for single-family homes, which leads starts, have fallen 22% over the first nine months of the year.
Another way for inventory to rise is if distressed sales start flooding the market, which is what happened in 2007-2009 – inventory surged to more than 11 months-of-supply, even as starts crashed. The thing is there’s not a lot of distress now. At least not yet. There are 3 big reasons for this:
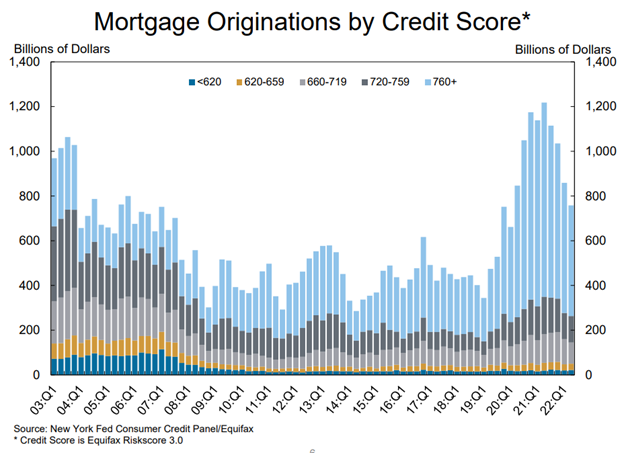
One, as this chart form the New York Federal Reserve illustrates, the quality of mortgage applicants has been much higher in this cycle than in the 2000s. Prior to 2008, less than a quarter of applicants had credit scores more than 760, while more than half were below 720. Lending standards tightened considerably after the crash, and over the past decade, especially over the past few years, majority of borrowers had credit scores 760+.
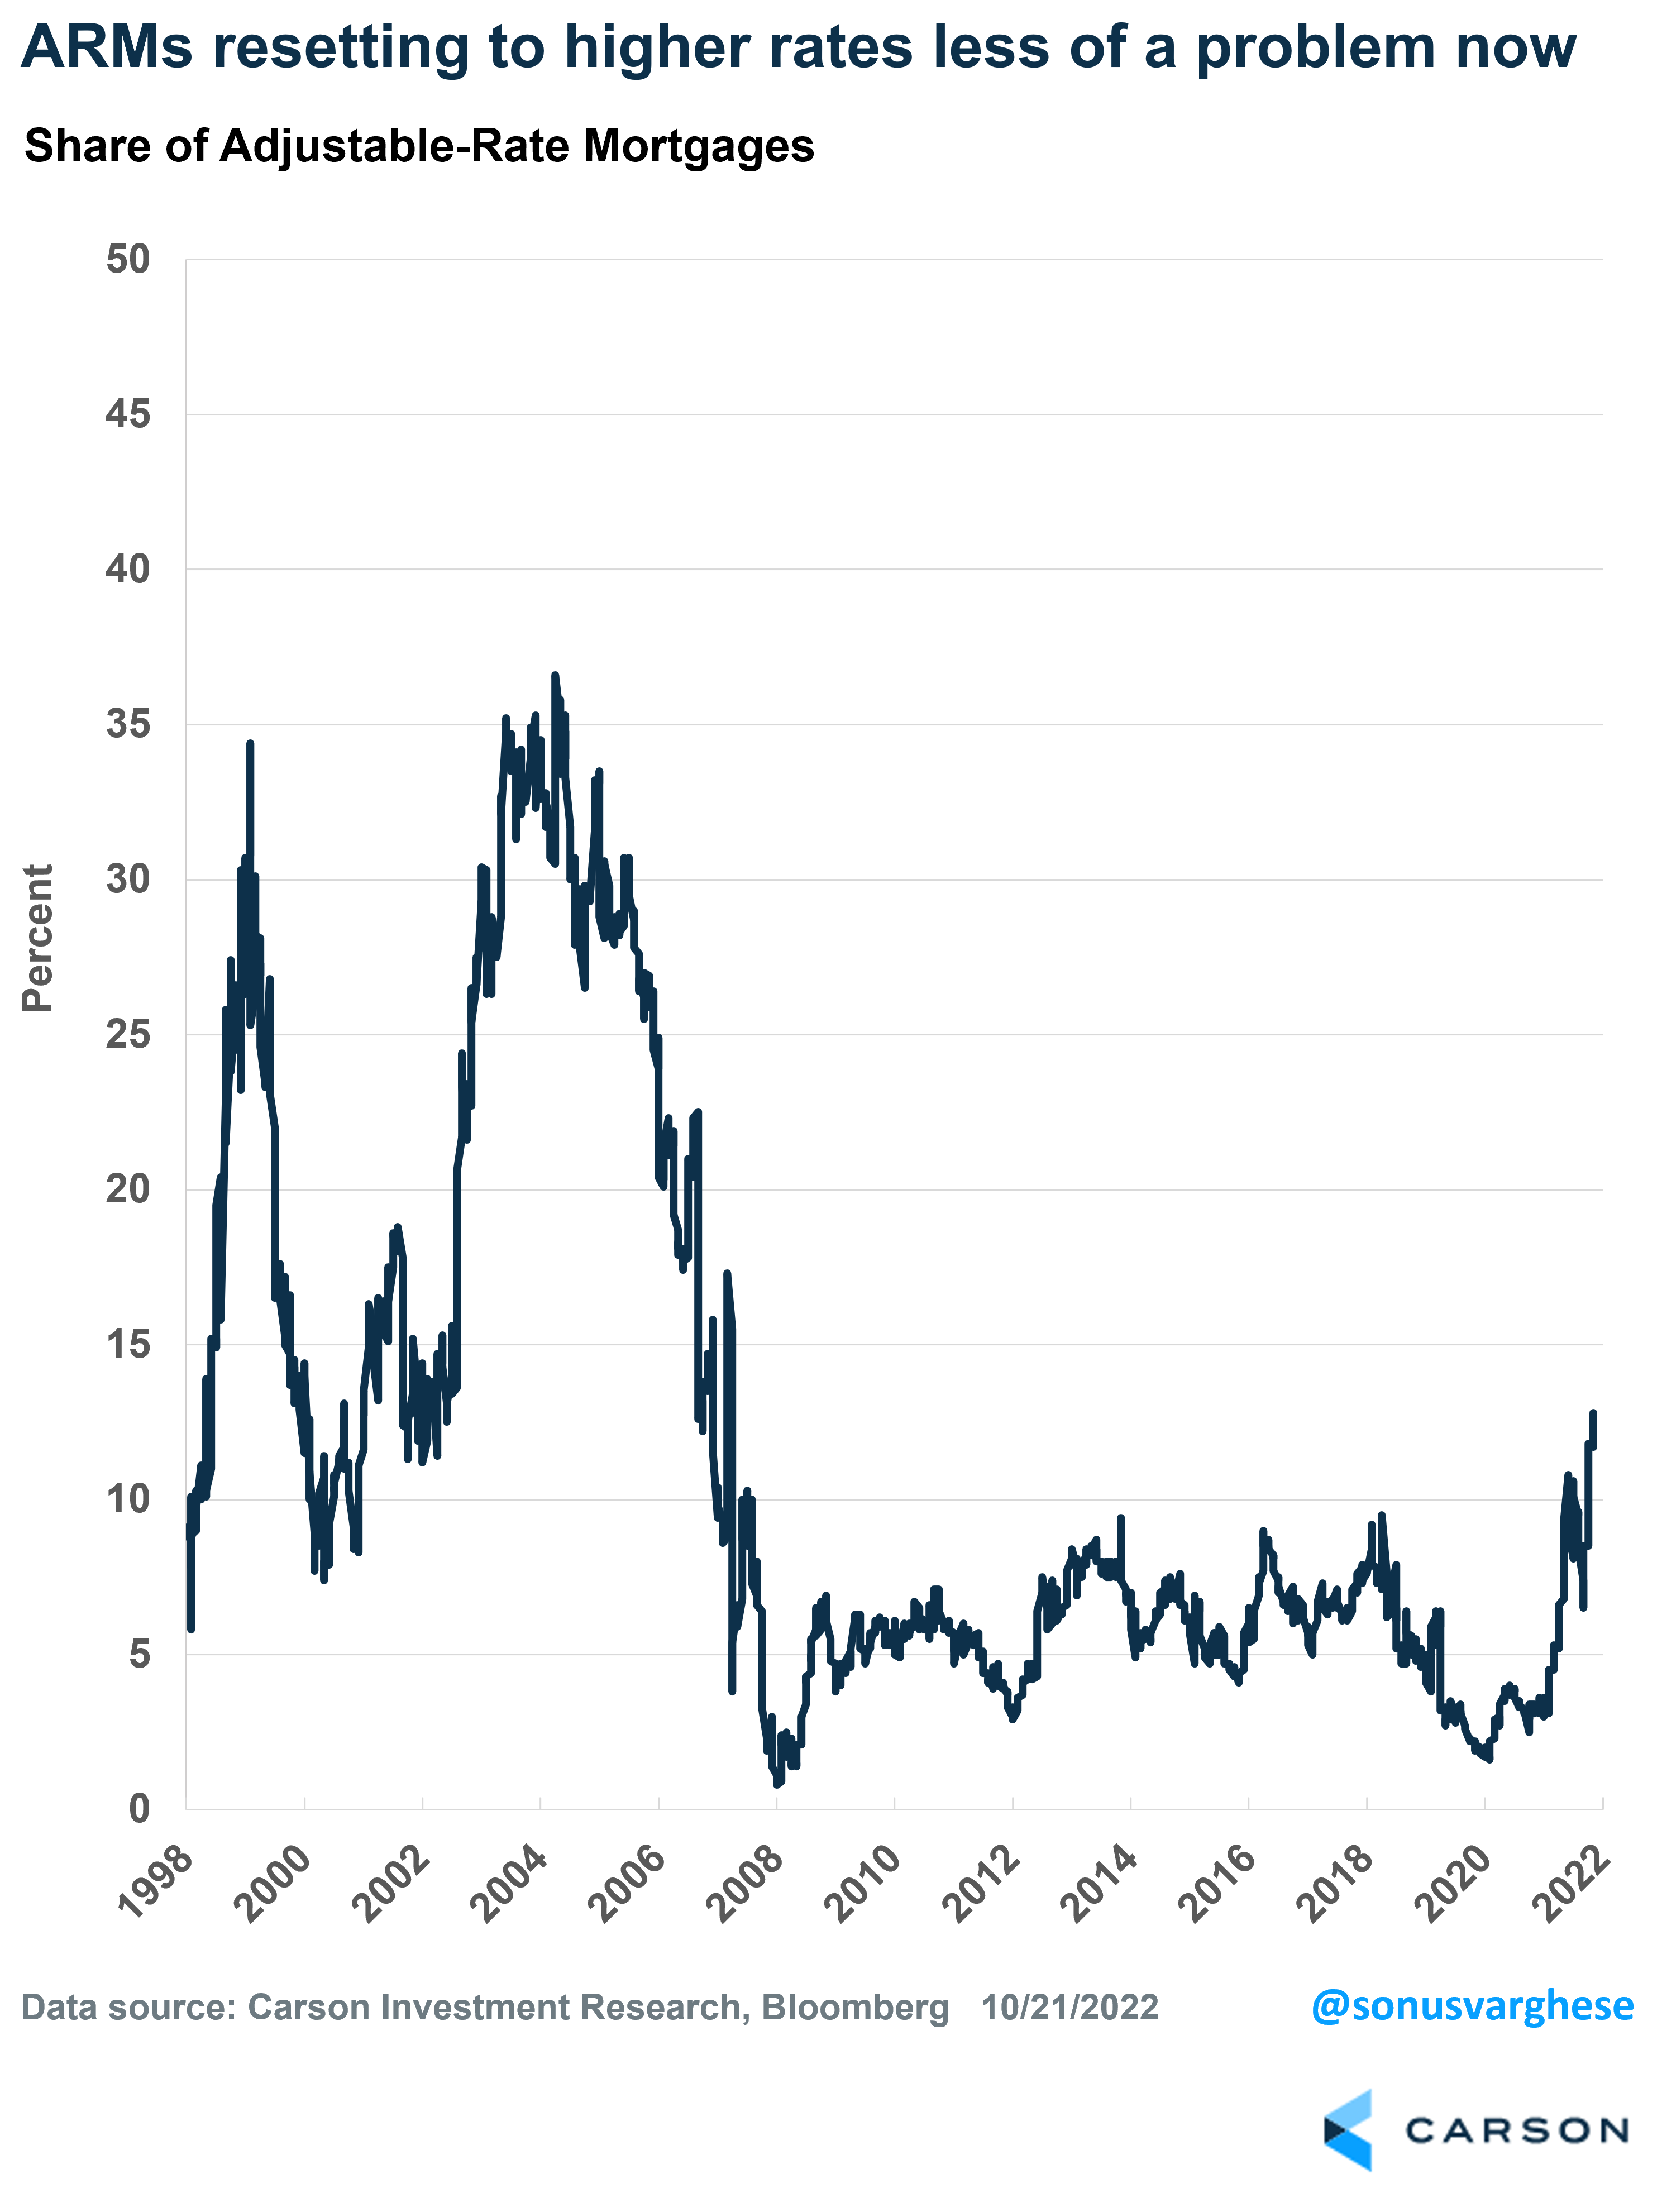
Two, mortgage rates are rising but there aren’t many borrowers with adjustable rate mortgages (ARMs) this time around. The share of ARMs averaged about 6% between 2012-2019 and around 3% in 2020-2021, a huge contrast to the significant share of ARMs in the 2000s (it peaked around 36% in 2005). This became a problem in the last cycle when rates reset higher, and borrowers couldn’t afford payments – leading to a wave of distressed selling. It’s going to be significantly less of an issue this time around, plus the quality of borrowers is much higher.
Three, affordability is falling for new homebuyers, but existing homeowners are in a good place with respect to their mortgage payments. Especially when you account for the fact that most of them probably refinanced over the last couple of years amid record low mortgage rates, and also saw their incomes rise. Mortgage debt service payments as a percent of disposable income is at 3.9% as of the second quarter of 2022, only slightly higher than the record low of 3.5% from Q1 2021.
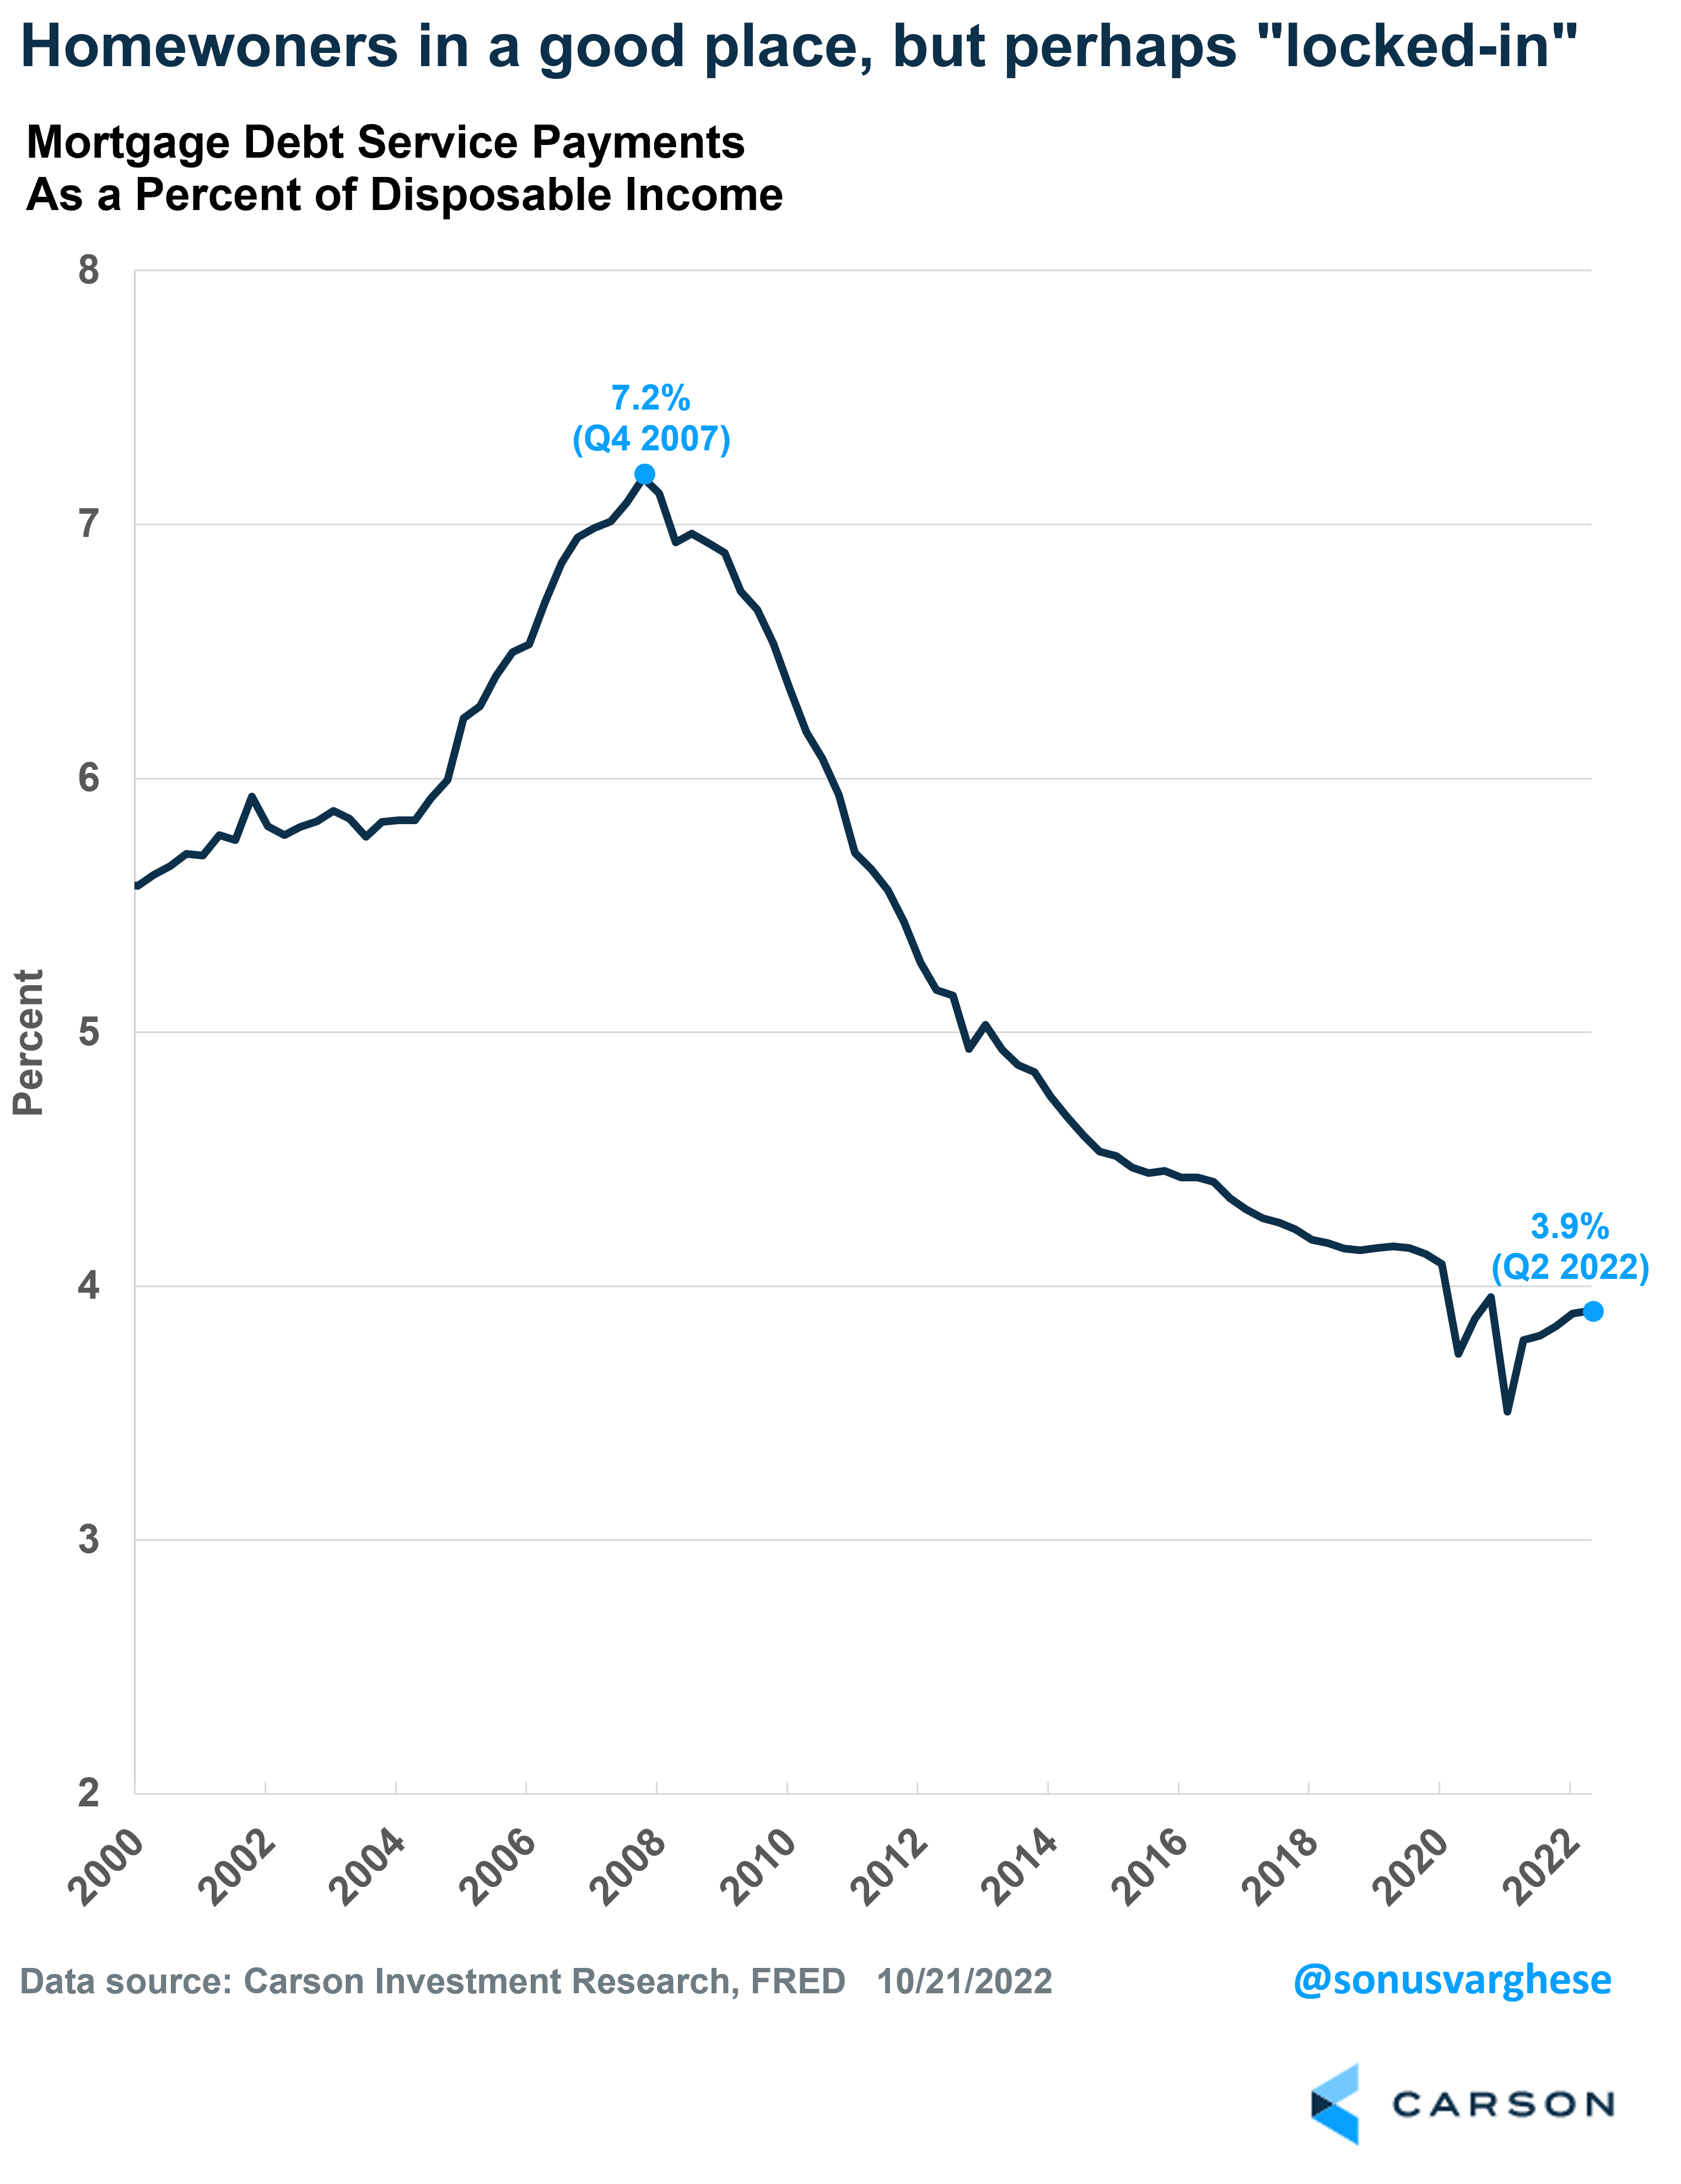
The other side of this is that it probably locks homeowners into their homes, making them reluctant to sell – especially in the face of rising mortgage rates and falling prices. These homeowners are also likely to have a lot of equity in their homes, thanks to the price surge over the past two years. So, they may be more likely to tap into that equity and renovate to make their homes fit growing needs, rather than sell. Obviously, there will be sellers who simply have to do so, whether to relocate for a job, or be closer to family.
In any case, there’s a lot of downward pressure on supply. It’s likely prices will continue to fall from here, especially given the run-up over the last couple of years. The obvious caveat is that its going to be markedly different across various locations. Yet, the supply picture may put some sort of floor on how low prices may go in this cycle, and we may not quite see a repeat of the last housing crash. In any case, inventory will be key to watch.